Energy-transfer upconversion of rare earth ions in ionic crystals Case of Tm3+-Ho3+-codoped LiYF4 c
Journal of Alloys and Compounds408–412(2006)
680–686
Energy-transfer upconversion of rare earth ions in ionic crystals:
Case of Tm3+/Ho3+-codoped LiYF4crystals
Taiju Tsuboi?,Hideyuki Murayama
Faculty of Engineering,Kyoto Sangyo University,Kamigamo,Kita-ku,Kyoto603-8555,Japan
Received30July2004;accepted25November2004
Available online13June2005
Abstract
Up-conversion spectra of Tm3+and Ho3+ions in LiYF4crystals have been investigated at various temperatures between10and320K. The photoluminescence is investigated under excitation with Xe-lamp and laser diode.In addition to blue up-converted emission of Tm3+ and Ho3+and green up-converted Ho3+emission,anti-Stokes emission bands are observed at687and703nm under excitation in the3H4 state of Tm3+with785nm laser diode.These bands are observed above200K,and their intensities increase exponentially with increasing temperature.They are attributed to endothermic Tm3+emission due to the transition to the3H6ground state from the upper3F3state,which is thermally populated from the3H4state.Discussion is given on the optical process of green up-converted Ho3+emission,which is generated by the785nm laser diode excitation.
?2005Elsevier B.V.All rights reserved.
Keywords:Luminescence;Rare-earth ions;Upconversion;Tm3+;Ho3+;LiYF4
1.Introduction
Tm3+/Ho3+-codoped crystals have been of interest because the infrared lasers of about2?m wavelength are important for medical applications[1–4].Tm3+-doped crys-tals show an additional infrared laser oscillation at about 1.47?m.Optical communication has been currently per-formed using lasers operating in the C-band(1.53–1.67?m) region where silica?bers have the ultra low loss.The wave-length region of1.45–1.50?m is also a low-loss region.This wavelength region will be important in near future as it will enable us to extend the optical communication bandwidth to S-band(1.48–1.53?m)region[5,6].Therefore,Tm3+-doped materials are suggested to be necessary as optical ampli?ca-tion device in the future optical communications.
There are many kinds of host materials such as oxides, chlorides and?uorides for doping rare-earth ions.Of them the oxides have been intensively studied.Unlike the oxides,
?Corresponding author.Tel.:+81757051899;fax:+81757051899.
E-mail address:tsuboi@cc.kyoto-su.ac.jp(T.Tsuboi).intense emission is obtained in?uorides because the oxides have much higher phonon energy than the?uorides.The high phonon energy easily gives rise to non-radiative multi-phonon transition from the emitting state to the nearest low-energy state,resulting in degradation of photolumines-cence.Additionally the?uorides are more transparent in the ultra violet spectral region than the oxides,i.e.not only the blue luminescence but also ultra violet luminescence is observed in?uorides.This indicates that the?uorides are more useful to obtain the blue and ultra violet emis-sions than the oxides.Such a short-wavelength lumines-cence is necessary for the optical memory,optical recording and full-color display.Therefore,we investigate the?u-oride host material such as LiYF4(YLF)in the present study.
The Tm3+-and Tm3+/Ho3+-codoped crystals are also of interest because they generate ultraviolet,blue,green and red up-converted emissions by infrared laser pumping.Of various Tm3+-doped crystals,Tm3+-doped and Tm3+/Ho3+-codoped YLF crystals are materials well known for the high ef?cient up-conversion process,indicated by blue and red
0925-8388/$–see front matter?2005Elsevier B.V.All rights reserved. doi:10.1016/j.jallcom.2004.11.079
T.Tsuboi,H.Murayama /Journal of Alloys and Compounds 408–412(2006)680–686681
emissions [7–9].Laser action in the visible has been obtained under infrared laser diode (LD)excitation at room tem-perature.Spectroscopic study of the upconversion helps to achieve high ef?cient laser action.Here we report the opti-cal properties of Tm 3+/Ho 3+-codoped YLF crystals under excitation with 785nm LD.Taking into account the results obtained by excitation with 460,680and 780nm light of Xe lamp,we suggest a new optical process for the anti-Stokes 687and 703nm emissions generated by 785nm LD excitation.
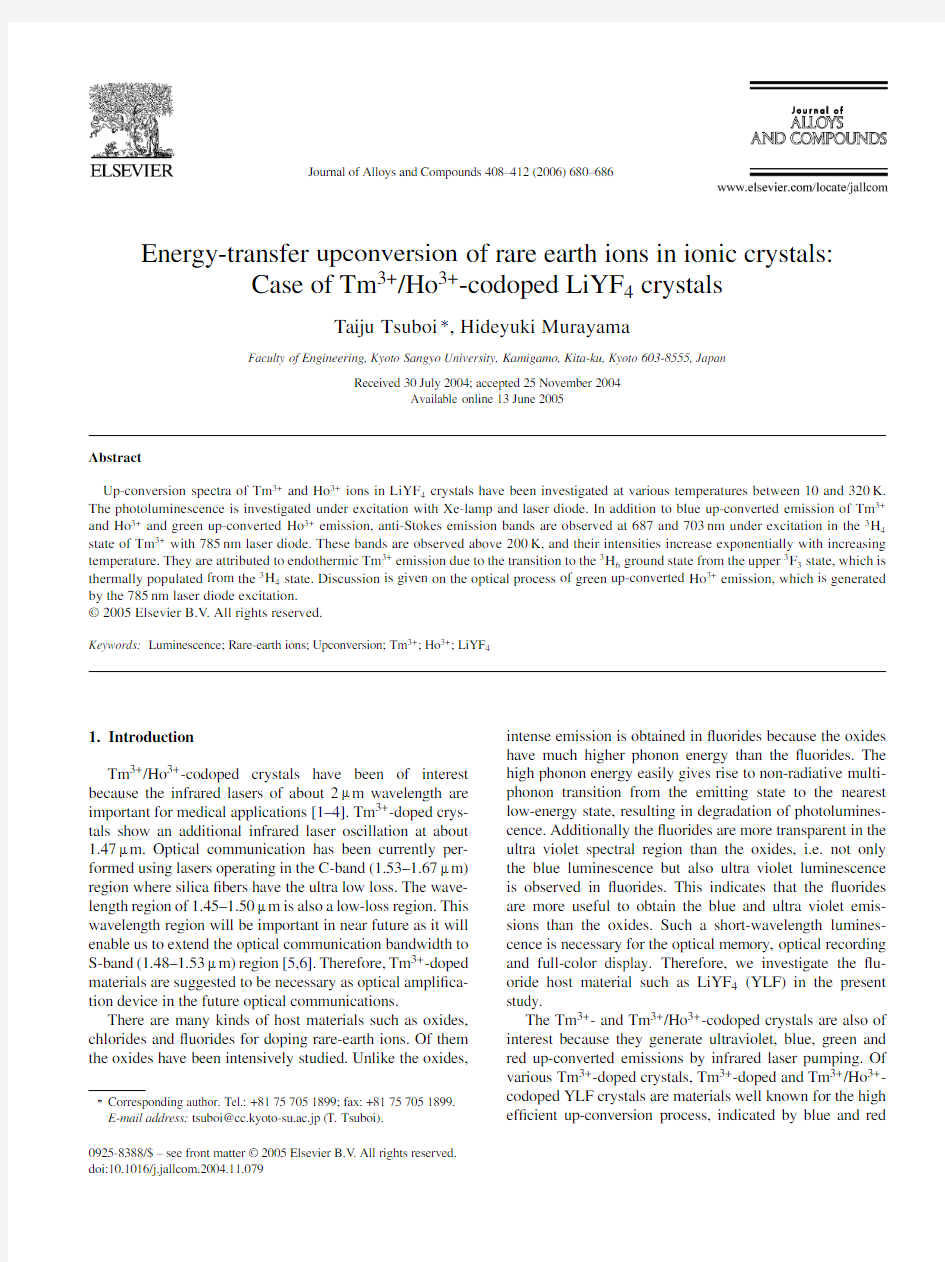
There are various up-conversion processes in rare-earth-doped materials.The simple process is the two-,three-or multi-photon absorptions where two,three or n photons with the same photon energy h νare absorbed by one rare-earth ion simultaneously and excited to the excited state at 2h ν,3h νor nh ν,respectively,and then luminescence with energy of 2h ν,3h νor nh νis generated by one-photon process.The second type of up-conversion process is via excited state absorption.For example,a Tm ion (Tm1)is excited to the 3H 4state by 785nm laser,followed the relaxation to the 3H 5state non-radiatively,then the second 785nm laser light gives rise to the transition from the 3H 5state to the 1G 4state (the excited state absorption).As a result the upconversion occurs by the transition from the 1G 4state to the ground state (as shown in the left-hand side of Fig.1).Alternatively,the nearby Tm ion (Tm2)is possible to be excited to the 3H 4state,followed the photon emission by the reversed transition.The Tm1is excited to the 1G 4state by absorbing the emitted photon from Tm2through the cross relaxation (see the right-hand side of Fig.1).Such an energy transfer between the two Tm 3+ions is possible in heavily Tm 3+-doped crystals.In the case of co-doped materials (i.e.materials doped with different rare-earth ions like Tm 3+and Ho 3+),the cross relaxation process is frequently observed.In this paper we study which kind of up-conversion processes occurs in Tm/Ho-codoped YLF
crystals.
Fig.1.Two kinds of up-conversion processes by two-photon absorption via (1)the excited state absorption in a Tm 3+ion (Tm1)and (2)the cross-relaxation between two Tm 3+ions (Tm1and Tm2)and the excited state absorption in Tm1.
2.Experimental procedure
Single crystals of Ho 3+/Tm 3+-codoped YLF crystals were grown in a standard RF-heating Czochralski furnace.An irid-ium crucible was put in the furnace.Two kinds of crystals were studied here;one is a very-lightly Ho 3+-doped crys-tal (called TmYLF,hereafter)with 6%Tm 3+and 0.01%Ho 3+ions,the other is YLF crystal with 8%Tm 3+and 0.5%Ho 3+ions (called HoYLF).The concentrations of Tm 3+and Ho 3+ions are 1.12×10²¹and 7.00×1019cm ?3in HoYLF,respectively.The emission and excitation spectra were measured with a Spex Fluorolog-3?uorophotometer in 350–1600nm spectral region.The excitation was under-taken by 450W Xe-lamp.The spectral resolution was set to be 0.2nm.Crystals were also excited with 785nm LD with maximum power of 42mW to investigate the upconversion.Absorption spectra of the crystal were measured with a Cary-5E spectrophotometer.Emission and absorption spectra were measured at various temperatures between 10and 320K.
3.Experimental results and discussion
Tm 3+ions have absorption bands at about 1600–1780,1120–1230,770–800,680–700,645–670,450–480,350–365,285–290,280–284,270–275and 255–264nm,which are due to the 4f 12→4f 12electronic transitions from the 3H 6ground state to the 3F 4,3H 5,3H 4,3F 3,3F 2,1G 4,1D 2,1I 6
,3P 0,3P 1and 3P 2states of Tm 3+,respectively [9–12].Tm 3+gives rise to many emission bands in infrared
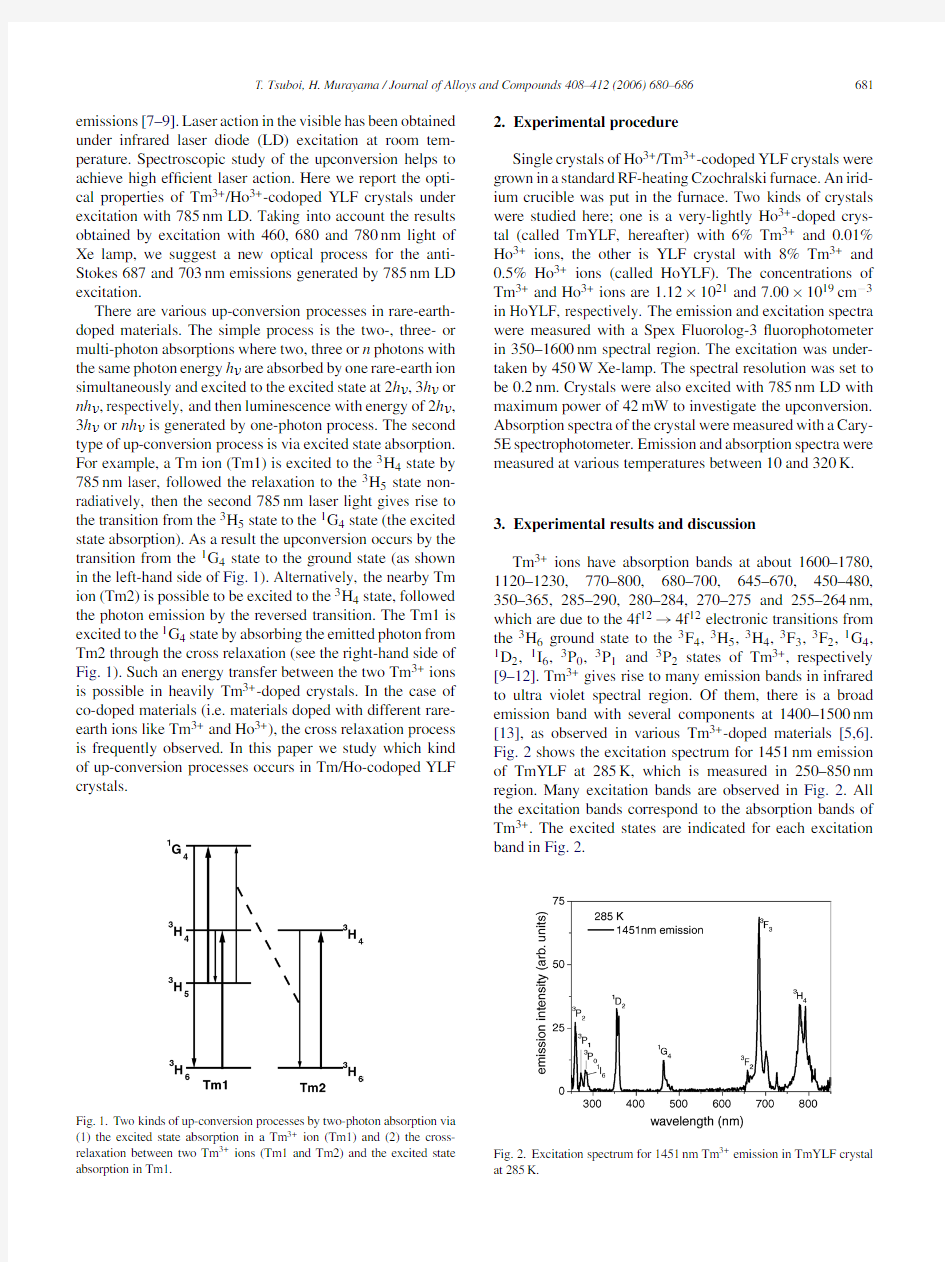
to ultra violet spectral region.Of them,there is a broad emission band with several components at 1400–1500nm [13],as observed in various Tm 3+-doped materials [5,6].Fig.2shows the excitation spectrum for 1451nm emission of TmYLF at 285K,which is measured in 250–850nm region.Many excitation bands are observed in Fig.2.All the excitation bands correspond to the absorption bands of Tm 3+.The excited states are indicated for each excitation band in Fig.2
.
Fig.2.Excitation spectrum for 1451nm Tm 3+emission in TmYLF crystal at 285K.
682T.Tsuboi,H.Murayama /Journal of Alloys and Compounds 408–412(2006)
680–686
Fig.3.(a)Up-conversion emission spectra,in 340–600nm spectral region,of TmYLF and HoYLF crystals excited with 785nm laser diode with 35mW at 290K.(b)Up-conversion emission spectra,in 600–900nm spectral region,of TmYLF and HoYLF crystals excited with 785nm laser diode with 35mW at 290K.An intense line at 785nm is due to the excitation laser diode.
Fig.3(a)and (b)shows the ultraviolet to near-infrared emission spectra of TmYLF and HoYLF crystals excited in the 3H 4state of Tm 3+with 785nm LD at room temperature.No upconversion are observed at 300–350nm,but many up-converted emission bands are observed at wavelength longer than 350nm.Fig.4shows the enlarged spectrum of Fig.3(a)in the blue region.Nguyen et al.reported the blue emission bands appearing at 443–458nm region in Tm 3+-doped YLF crystal by two-color excitation with 780.78and 648.77nm lights at room temperature [14].The spectrum is consistent with the spectrum of TmYLF shown in https://www.360docs.net/doc/0f9459715.html,paring the TmYLF spectrum with the HoYLF spectrum,we can
attribute
Fig.4.Enlarged spectrum of Fig.3(a)in a 430–470nm spectral region.
the emission bands at 456nm to Ho 3+and the other bands to Tm 3+as shown in Fig.4.
The emission bands with peaks at 360,449,477,666,687,703,806and 814nm are due to Tm 3+ions,while the emis-sion bands at 383.5,385,406,418,456,520,541,549,579,649.5,and 750nm are due to Ho 3+ions.The 360,449,477,483.5,666,806and 814nm Tm 3+bands are attributed to the transitions 1D 2→3H 6,1D 2→3F 4,1G 4→3H 6,1G 4→3H 6,3H 4→3H 6,and 3H 4→3H 6
,respectively.The 385,406,418,456,483.5,520,541,549,579,649.5,and 750nm Ho 3+bands are attributed to the transitions 5G 4→5I 8,3D 3→5I 6,5G 5→5I 8,5D 3→5I 5,5D 3→5I 4,3H 5→5I 6
,5D 2→5I 8,
5S 2→5I 8,5G 4→5I 6,5F 5
→5I 8,and 5I 4→5I 8,respec-tively.These assignments are made by comparison of the up-conversion spectrum with the energy levels of Tm 3+and Ho 3+ions as shown in Fig.5.For example,if the energy of emission band peak coincides with that of excited state of Tm 3+or Ho 3+,the emission band is assigned to the transition from the excitated state to the ground state.The assignments are also made by comparison with the usual photolumines-cence (down-conversion)measurement using Xe lamp light with different excitation wavelengths such as 260,360,460and 680nm.
Weak emission band is observed at 885–895nm in HoYLF in Fig.3(b).It consists of three components at 887,890and 893nm.This emission band is due to the transition 5I 5→5I
8
https://www.360docs.net/doc/0f9459715.html,parison of up-conversion spectrum of HoYLF excited by 35-mW 785nm LD (right-hand side of the ?gure)with the energy levels of Tm 3+and Ho 3+ions.The up-conversion intensity is shown in log-scale.A sharp peak at 12739cm ?1is due to the 785nm LD used for excitation.
T.Tsuboi,H.Murayama/Journal of Alloys and Compounds408–412(2006)680–686
683
Fig.6.Peak intensities of the360,449,687and814nm Tm3+emission bands in TmYLF crystal plotted against the785nm laser diode intensity at 290K.
of Ho3+.In Fig.3(b),two weak emission bands are observed
at687and703nm by785nm LD excitation.These emission
bands were not observed by the down-conversion measure-
ment with,e.g.360,460and680nm light from Xe lamp.We
discuss the687and703nm emission bands later.In TmYLF
the549nm emission band is observed as the Ho3+emission
in TmYLF.The intensity is comparable with the650–670nm
Tm3+emission intensity although the Ho3+concentration is
much smaller than the Tm3+one in TmYLF,indicating ef?-
cient energy transfer from Tm3+to Ho3+.
Fig.6plots the intensity of the360,449,687and814nm
Tm3+emissions observed in TmYLF against the785nm LD
power.The360,449,687and814nm emissions take slopes
of3.0,3.0,1.2and1.0in the log–log scale.This indicates
that the360and449nm emission is due to the upconver-
sion by three-photon process.The360and449nm emission
bands arise from the transition from the1D2state to the3H6
ground state and3F4state,respectively,as mentioned above.
To excite into the1D2state by785nm photon,the follow-
ing processes are necessary.The?rst photon excites Tm3+
ion from the ground state to the3H4state from which Tm3+
relaxes to the3H5state.The second785nm photon excites
from the3H5state into the1G4state from which Tm3+relaxes
to the3F3state.The third785nm photon excites from the 3F3state into the1D2state.On the other hand,the814nm emission is con?rmed to arise from the one-photon down
conversion.It was observed that the up-converted687and
703nm emissions take the same slope of1.0.
We plot the intensities of the other emission bands,which
were observed in TmYLF and HoYLF crystals,against LD
power in Figs.7and8,respectively.The slope in the log–log
plotted power dependence is1.98,1.87and1.86for the477,
483and489nm emissions,1.93,1.93,1.91,1.96and2.02for
the517,520,528,541and549nm emissions,1.59,1.52,1.56
and1.59for the648,653,663and666nm emissions,1.41
and1.42for the642and656nm emissions,1.8,1.9,2.0and
2.1for the690,705,740and750nm emissions,respectively.
These up-conversion emission bands have the slope values of
much higher than1.0.The results of Fig.7are the same as
the Fig.7.Peak intensities of various emission bands in TmYLF crystal plotted against the785nm laser diode intensity at290K.
results of Fig.8except for the360and386nm emissions.The 360nm Tm3+and386nm Ho3+emissions take slope of3in TmYLF,while both of the two emissions take slope of2at low LD power range and slope of3at high power range in HoYLF as shown in Fig.8.This indicates that different optical process occurs to give rise to these up-converted emissions between the TmYLF and HoYLF crystals.We consider this optical process as follows.
The concentration of Ho3+ions is higher in HoYLF than in TmYLF.The360nm Tm3+emission arises from the transi-tion from the1D2state at about27800cm?1above the ground state.Therefore,at least three785nm photons(with photon energy of12740cm?1)are needed to excite into the1D2state as shown in Fig.9(b).This interpretation is consistent with the slope of3obtained for the360nm emission in TmYLF.In HoYLF,however,the360nm emission was obtained by two-photon absorption process at low785nm LD power range. Why only two photons are possible to excite into the1D2 state in HoYLF?
The?rst785nm photon excites Tm3+ion from the ground state to the3H4state.Ho3+ion has the5I4state which is quite close to the3H4state.Therefore,the energy transfer occurs easily from Tm3+to Ho3+because Tm3+ions are more possible to locate near Ho3+sites in heavily Tm3+
-doped Fig.8.Peak intensities of various emission bands in HoYLF crystal plotted against the785nm laser diode intensity at290K.A letter“s”means the value of slope for a straight line drawn in the log–log scale.
684T.Tsuboi,H.Murayama/Journal of Alloys and Compounds408–412(2006)
680–686
Fig.9.(a)The360nm Tm3+up-converted emission and386nm Ho3+up-converted emission by two-photon process with785nm LD photon by energy transfer between Tm3+and Ho3+ions.(b)The360nm Tm3+up-converted emission by three-photon process(see text).
(8%)HoYLF crystal than in the very lightly Ho3+-doped (0.01%)TmYLF crystal.The second785nm photon excites Ho3+from the excited5I4state to the3G4state of Ho3+,from which the386nm Ho3+emission is generated(see Fig.9(a)). At the same time the3F2state of Tm3+locates close to the 5I4state.Thus,the energy transfer occurs to the3F2state,
followed the excitation from the3F2state to the1D2state of Tm3+by the second785nm photon(as shown in Fig.9(a)). In this way we can understand the presence of the386and 360nm upconversions by two-photon absorption process.
The687and703nm emission bands show the slope of almost1.00as mentioned above.The slope of1means that excitation with one-photon absorption process gives rise to emission.Why the up-converted687and703nm emis-sions are possible by the one-photon excitation process?We explain this unusual result as follows.
Fig.10shows the temperature dependence of the687and 703nm emission bands.It is observed when crystal is heated from15K up to320K that these bands appear above200K. The band intensities increase exponentially with temperature in a form of a i exp(? E/kT)as shown in Fig.11.The best?t was observed at E=1700cm?1and a2/a1=1.77where a1 and a2are parameters for the687and703nm emission bands, respectively.This indicates that the two emission bands arise from the thermally excited states.
Fig.12shows the3H6→3H4,3F3and3F2absorption spectra of655–805nm region at15and290K,together with the spectrum of the687and703nm emission
bands.Fig.10.The687and703nm emission bands of TmYLF,which was excited with785nm laser diode,at various temperatures between215and296
K. Fig.11.Temperature dependence of the intensities of the687and703nm emission bands observed in Fig.10.Solid curves are the best?t to the experimental points,which were derived using a form of a i exp(? E/kT) (see
text).
Fig.12.Absorption spectra of TmYLF at15and290K,together with the spectrum of the687and703nm emission bands obtained by785nm laser diode excitation at290K.
T.Tsuboi,H.Murayama/Journal of Alloys and Compounds408–412(2006)680–686
685
Fig.13.Schematic energy level diagram of the3F3,3H4and3H6states of Tm3+and the optical transitions of the absorption bands at687,703,780 and786nm at290K and the687and703nm emission bands obtained by 785nm laser diode excitation.
The687nm band peak wavelength coincides with the wave-length of the3H6→3F3absorption band peak.Absorption band at703nm is observed at room temperature.Its inten-sity decreases with decreasing temperature and the703nm absorption band is not observed at low temperatures such as15K.This means that the703nm absorption band is a hot band which is due to transition from a thermally excited Stark substate of the3H6ground state(see Fig.13).The wavelength of the703nm absorption band peak coincides with that of the 703nm emission band peak.This coincidence allows us to attribute the703nm emission to the reverse electronic tran-sition of the703nm absorption(Fig.13).
The3F3state is at about1700cm?1above the3H4state which is excited by the785nm LD.The energy gap between the3F3and3H4states agrees with E value derived from the experimental results.Taking into account these results and considering that the LD irradiation gives rise to heating of crystal,it is con?rmed that the687and703nm emission bands are caused by transition from the3F3state which is thermally populated from the3H4state as shown in Fig.11. The687and703nm emissions are attributed to the transition from the3F3state to the Stark levels at0and300cm?1in the 3H6ground state,respectively.The presence of the300cm?1 Stark level is con?rmed by the appearance of the703nm hot absorption band.
An intense Ho3+up-conversion band is observed at549nm in TmYLF by785nm LD excitation as shown in Fig.3(a). Their slope values in the log–log plotted power dependence are quite close to2.0,indicating these emissions are due to the two-photon excitation.The LD light excites Tm3+to the 3H4state.Ho3+is not excited by the785nm LD because Ho3+has no absorption band around785nm.Therefore,the 549nm Ho3+emission band is caused by energy transfer
from Fig.14.Two possible energy transfers from Tm3+to Ho3+by non-resonant process in the up-converted549nm Ho3+emission generated by excitation in the3H4state of Tm3+with785nm laser diode.The dotted arrow means the non-radiative relaxation.
Tm3+to Ho3+.Two processes are conceivable for the energy transfer,which are due to the non-resonant energy transfer[8] assisted by creation or annihilation of phonons.The energies of the5I5and5I4states of Ho3+are close to that of the3H4 state of Tm3+as shown in Fig.14.Therefore,the energy in the 3H4state of Tm3+excited by the?rst785nm LD photon is
transferred to the5I5and5I4state,subsequently excited to the upper states5G5and5G4of Ho3+by the second785nm pho-ton,respectively(see Fig.14(a)and(b)).In fact,two-photon excited up-converted419and386nm emission bands,which are due to the5G5→5I8and5G4→5I8transitions of Ho3+, are observed in HoYLF crystal,respectively,although these emission intensities are not as intense as the other upconver-sion.Therefore,the two processes of Fig.14(a)and(b)occur in HoYLF.It is dif?cult to determine at this moment which process occurs more strongly and more ef?ciently.
4.Summary
Photoluminescence and up-conversion spectra of Tm3+ and Ho3+ions in LiYF4crystals with6%Tm3+and0.01% Ho3+ions and with8%Tm3+and0.5%Ho3+ions were investigated in350–1600nm spectral region at various tem-peratures between10and320K.The photoluminescence was investigated using excitation with460,680and780nm light of Xe-lamp,while up-conversion and down-conversion was investigated by785nm laser diode with maximum power of35mW.The1150–1250nm1G4→3H4emission of Tm3+was observed under the460nm excitation but not observed under the680and780nm excitation.In addition to the386and419nm Ho3+,477–489nm Tm3+,541–549nm Ho3+,648–666nm Tm3+up-converted emissions due to two-photon excitation,anti-Stokes emission bands were observed at687and703nm under excitation in the3H4state of Tm3+with785nm laser diode.The687and703nm bands were observed to appear above200K,and their intensities
686T.Tsuboi,H.Murayama/Journal of Alloys and Compounds408–412(2006)680–686
increased exponentially with increasing temperature.They were attributed to endothermic Tm3+emission due to the transition to the3H6ground state from the upper3F3state, which is thermally populated from the3H4state.Optical pro-cesses by energy transfer from Tm3+to Ho3+were suggested for the green up-converted Ho3+emission. Acknowledgments
We thank Prof.K.Shimamura for providing crystals which were used in the present work.The present work is partially supported by the Grant-in-Aid for Scienti?c Research from the Japan Society for Promotion of Science.
References
[1]G.L.Bourdet,G.Lescroart,R.Muller,https://www.360docs.net/doc/0f9459715.html,mun.150(1998)
141.
[2]F.Cornacchia,A.Di Lieto,P.Maroni,P.Minguzzi,A.Tonelli,M.
Tonelli,E.Sorokin,I.T.Sorokina,Appl.Phys.B73(2001)191. [3]V.Sudesh,K.Asai,K.Shimamura,T.Fukuda,IEEE.J.Quant.
Electr.38(2002)1102.
[4]V.Sudesh,K.Asai,J.Opt.Soc.Am.B20(2003)1829.
[5]T.Komukai,T.Yamamoto,T.Sugawa,Y.Miyajima,IEEE J.Quant.
Electr.31(1995)1880.
[6]S.Kawanishi,K.Uchiyama,H.Takara,T.Morioka,M.Yamada,T.
Kanamori,Electron.Lett.33(1997)1553.
[7]G.¨Ozen,B.Di Bartolo,Appl.Phys.B70(2000)189.
[8]G.¨Ozen,S.Salihoglu,https://www.360docs.net/doc/0f9459715.html,mun.180(2000)323.
[9]A.Brener,J.Rubin,R.Moncorge,C.Pedrini,J.Phys.50(1989)
1463.
[10]T.Tsuboi,Y.F.Ruan,N.Kulagin,in:J.C.Krupa,N.A.Kulagin
(Eds.),NATO Scienti?c Series II:Mathematics,Physics and Chem-istry,126,Kluwer Sci.Publ.,London,2003,pp.171–185(Chapter
12).
[11]T.Tsuboi,M.Tanigawa,K.Shimamura,https://www.360docs.net/doc/0f9459715.html,mun.186(2000)
127.
[12]T.Tsuboi,J.Electrochem.Soc.147(2000)1997.
[13]T.Tsuboi,K.Shimamura,Rare Earths44(2004)120(in Japanese).
[14]D.C.Nguyen,G.E.Faulkner,M.Dulick,Appl.Opt.28(1989)
3553.
线性调频信号数字脉冲压缩技术分析_郑力文
2011年1月1日第34卷第1期 现代电子技术 M odern Electro nics T echnique Jan.2011V ol.34N o.1 线性调频信号数字脉冲压缩技术分析 郑力文,孙晓乐 (中国空空导弹研究院,河南洛阳 471009) 摘 要:在线性调频信号脉冲压缩原理的基础上,利用M atlab 对数字脉冲压缩算法进行仿真,得到了雷达目标回波信号经过脉冲压缩后的仿真结果。运用数字脉冲压缩处理中的中频采样技术与匹配滤波算法,对中频采样滤波器进行了优化,降低了实现复杂度,减少了运算量与存储量。最后总结了匹配滤波的时域与频域实现方法,得出在频域实现数字脉冲压缩方便,运算量小,更适合线性调频信号。 关键词:线性调频信号;脉冲压缩;中频采样;匹配滤波 中图分类号:T N911-34 文献标识码:A 文章编号:1004-373X(2011)01-0039-04 Digital Pulse C ompression Technology of Linear Frequency Modulation Signal ZH ENG L-i w en,SU N X iao -le (Chi na Airborne Missi le Academy,L uo yang 471009,China) Abstract :Based o n the pr inciple of pulse com pr essio n techno lo gy o f linear fr equency mo dulat ion signal,the simulatio n r e -sult of radar echo sig nal co mpressed by the pulse can be ga ined by using M atlab to simulate the dig ital pulse com pr essio n algo -r ithm.Co mbining the techno log y o f IF sampling with the matching filt er alg or ithm in the digit al pulse compression processing and optimazing the I F sampling filter,which can remarkably reduce the complex ity and decr ease t he mult iplier operation and the memo ry.Finally ,the implementation methods of matching filter algo rithm in time domain and fr equency doma in are summar ized,the dig ital pulse compression can be im plemented on frequency do main. Keywords :linear frequency modulatio n signal;pulse com pr essio n;IF sampling ;matching f ilter 收稿日期:2010-07-22 为了提高雷达系统的发现能力,以及测量精度和分 辨能力,要求雷达信号具有大的时宽带宽积[1-2]。但是,在系统的发射和馈电设备峰值功率受限制的情况下,大的信号能量只能通过加大信号的时宽来得到。然而单载频脉冲信号的时宽和带宽乘积接近1,故大的时宽和带宽不可兼得。因此,对这种信号来说,测距精度和距离分辨力同测速精度和速度分辨力以及作用距离之间存在着不可调和的矛盾。在匹配滤波器理论的指导下,提出了线性调频脉冲压缩的概念,即在宽脉冲内附加线性调频,以扩展信号的频带,提供了一类信号,其时宽带宽乘积大于1,称之为脉冲压缩信号或大时宽带宽积信号。线性调频信号是应用最广泛的脉冲压缩信号,因此线性调频信号的特性、脉冲压缩的原理及其实现技术都是比较受人关注的[3-5]。 1 线性调频信号脉冲压缩基本原理1.1 线性调频信号简介 线性调频信号是通过非线性相位调制或线性频率调制(LFM )来获得大的时宽带宽积[6-7],这种信号又称 为chirp 信号,它是研究得最早而且应用最广泛的一种脉冲压缩信号。线性调频信号的时域波形如图1所示, 其频谱如图2所示。 线性调频信号可以表示为: x (t)=A #r ect t S #exp j 2P f 0t +L t 2 2 (1) 式中:A 为信号幅度;rect (t/S )为矩形函数,即: rect (t/S )= 1, t/S \1/20, t/S <1/2 (2) 线性调频信号的瞬时角频率X i 为: X i =d U d t =2P f 0+L t (3) 图1 线性调频信号的时域波形 在脉冲宽度S 内,信号的角频率由2P f 0-L S /2变
7-ZIP 制作软件安装包详细教程+7-Zip自解压软件安装包制作工具箱
7-Zip自解压软件安装包制作工具箱 本工具箱包含以下工具: 1.7-Zip解压缩软件:7-Zip v4.57 简体中文版 2.7-Zip自解压包生成工具:7Zip高级自解压包生成工具(SfxMaker7Zip) 3.7-Zip自解压文档分离器:7z自解压文档分离器汉化版(7z SFX Archives splitter) 4.程序文件图标提取工具:零度文件图标提取器 5.程序文件资源替换工具:ResHacker远景专用 以上这些工具在制作7z自解压软件安装*****程中,是很有用的,并且简单易学。 声明:本工具箱所收集的工具均来自网络,所有权归原作者所有,本人仅仅收集而已。 1.7-Zip解压缩软件:7-Zip v4.57 简体中文版 7-Zip是一款号称有着现今最高压缩比的压缩软件,它不仅支持独有的7z文件格式,而且还支持各种其它压缩文件格式,其中包括Zip、RAR、CAB、GZip、BZip2和TAR等等。此软件压缩的压缩比要比普通Zip文件高30-50% ,因此,它可以把Zip格式的文件再压缩2-10% 。 7-Zip 的主要特征: 更新了算法来加大7z 格式的压缩比 7-Zip 是基于GNU LGPL之下发布的软件 支持格式:压缩及解压缩:7z、Zip、GZip、BZip2 和TAR 仅解压缩:RAR、CAB、ISO、ARJ、LZH、CHM、Z、CPIO、RPM、DEB 和NSIS 对于Zip 及GZIP 格式,7-Zip 能提供比使用PKZip 及WinZip 高2-10% 的压缩比 7z 格式支持创建自释放(SFX)压缩档案 集成Windows 外壳扩展 强大的的文件管理 强大的命令行版本 支持FAR Manager 插件 软件界面
GB化学品安全周知卡模板
化学品安全技术说明书空白文档 第一部分化学品及企业标识 化学品中文名称: 化学品英文名称: 企业名称: 地址: 邮编: 电子邮件地址: 联系电话: 传真号码: 企业应急电话: 产品代码: 产品推荐用途: 产品限制用途: 第二部分危险性概述 紧急情况概述: GHS危险性类别:根据化学品分类、警示标签和警示性说明规范系列标准,该产品属于 标签要素: 象形图:
警示词: 危险信息: 防范说明: 预防措施: 事故响应: 安全储存: 废弃处置: 物理化学危险: 健康危险: 环境危害: 第三部分成分/组成信息 物质□混合物□ 危险组分浓度,% CAS No. 第四部分急救措施 皮肤接触: 眼睛接触:
吸入: 食入: 接触该化学品的主要症状和对健康的影响: 对施救者的忠告: 医生的特别提示: 及时的医疗护理和特殊的治疗: 第五部分消防措施 灭火方法及灭火剂: 特别危险性: 特殊灭火方法: 保护消防人员的防护装备: 第六部分泄露应急处理 作业人员防护措施、防护装备和应急处置程序: 环境保护措施: 泄漏化学品的收容、清除方法及所使用的处置材料:防止发生次生危害的预防措施: 第七部分操作处置与储存 操作处置: 储存: 第八部分接触控制和个体防护
职业接触限值: 监测方法: 生物限值: 监测方法: 工程控制方法: 呼吸系统防护: 手防护: 眼睛防护: 皮肤和身体防护: 特殊防护措施: 第九部分理化特性 外观与性状:气味: pH 值:熔点/凝固点(℃):沸点、初沸点和沸程(℃):闪点(℃): 爆炸上限%(V/V):爆炸下限%(V/V):蒸气压(KPa):蒸气密度(空气=1):相对密度(水=1):溶解性: 辛醇/水分配系数:自燃温度(℃): 分解温度(℃):气味阈值: 蒸发速率:易燃性: 临界温度(℃):临界压力(MPa):
线性调频脉冲压缩雷达仿真
一. 线性调频(LFM )信号 脉冲压缩雷达能同时提高雷达的作用距离和距离分辨率。这种体制采用宽脉冲发射以提高发射的平均功率,保证足够大的作用距离;而接受时采用相应的脉冲压缩算法获得窄脉冲,以提高距离分辨率,较好的解决雷达作用距离与距离分辨率之间的矛盾。 脉冲压缩雷达最常见的调制信号是线性调频(Linear Frequency Modulation )信号,接收时采用匹配滤波器(Matched Filter )压缩脉冲。 LFM 信号(也称Chirp 信号)的数学表达式为: 22() 2()()c K j f t t t s t rect T e π+= (2.1) 式中c f 为载波频率,()t rect T 为矩形信号, 11()0,t t rect T T elsewise ? , ≤? =?? ? (2.2) B K T = ,是调频斜率,于是,信号的瞬时频率为()22c T T f Kt t + -≤≤,如图 2.1 图2.1 典型的chirp 信号(a )up-chirp(K>0)(b )down-chirp(K<0) 将2.1式中的up-chirp 信号重写为: 2()()c j f t s t S t e π= (2.3) 式中, 2 ()( )j Kt t S t rect e T π= (2.4) 是信号s(t)的复包络。由傅立叶变换性质,S(t)与s(t)具有相同的幅频特性,只是中心频率不同而以,因此,Matlab 仿真时,只需考虑S(t)。以下Matlab 程序产生2.4式的chirp 信号,并作出其时域波形和幅频特性,如图2.2。
%%demo of chirp signal T=10e-6; %pulse duration10us B=30e6; %chirp frequency modulation bandwidth 30MHz K=B/T; %chirp slope Fs=2*B;Ts=1/Fs; %sampling frequency and sample spacing N=T/Ts; t=linspace(-T/2,T/2,N); St=exp(j*pi*K*t.^2); %generate chirp signal subplot(211) plot(t*1e6,real(St)); xlabel('Time in u sec'); title('Real part of chirp signal'); grid on;axis tight; subplot(212) freq=linspace(-Fs/2,Fs/2,N); plot(freq*1e-6,fftshift(abs(fft(St)))); xlabel('Frequency in MHz'); title('Magnitude spectrum of chirp signal'); grid on;axis tight; 仿真结果显示: 图2.2:LFM信号的时域波形和幅频特性
【转】制作软件自动安装,软件全自动安装包解析
【转】制作软件自动安装,软件全自动安装包 经常需要帮别人安装一些常用软件,“下一步”、修改安装目录等等,总得做很多重复的工作,很久之前就看到一些高手用autoit 来做一些软件的“自动安装”,软件的整个安装过程是全自动的,不需要点击或者输入任何东西,非常方便。 方法一: 由于对autoit不是很了解,一直没做出自己需要的“自动安装”,虽然也尝试用其他的工具制作过类似的“自动安装”,但是效果不是太好。 今天无意看到一篇文章《制作软件自动化安装的最简便的方法[By Gooker]》,如茅塞顿开,获益匪浅,感谢原作者。 下载自动化编写任务脚本autoit v3.2.55中文绿色版-目前最新是v3版本,类似BASIC语言风格的脚本程序的免费软件,它被设计用来在Windows GUI中进行自动操作.通过它可以组合使用模拟键击,鼠标移动和窗口/控件操作等来实现自动化任务,这是其它语言所无法做到或尚无可靠方法实现的。 这个方法不是用别的工具,正是AU3自带的。最简便的方法是什么样子的: 执行一遍软件的安装,就出来代码了,编译一下就出来工具了。 OK,先说明用的不是用Autoit宏生成器,总感觉那个玩意不准(不知道是不是没用过的原因),其实可能大家也在使用的时候碰到过,偶然按出来了,或者老手都知道这个软件。 好了,现在告诉你如何做: 1、打开 目录是:AutoIt3\SciTe\ScriptWriter 下面的AU3Record.exe文件 2、主角就出现了,建议选中"Record Window Text"(记录窗口文字),另外"Record Mouse"必选,然后browse选择你想要自动安装的软件; 3、选择好之后就点击"Click To Record"的图标,之后就安装你的软件,你的操作都会被记录,这个记录方式是完全模拟的,包括鼠标的移动、点击等等; 4、软件安装完毕之后,我们点击右上角这个 完成,程序会自动把代码写到SciTE里面。
易制爆危化品周知卡(样本)
危险化学品安全周知卡(样式) 危险性类别 腐蚀 品名、英文名及分子式、CC码及CAS号 双氧水(工业过氧化氢) Hydrogen peroxide H2O2 CAS号:7722-84-1 危险性标志 危险性理化数据 熔点(℃):-0.89℃(无水) 沸点(℃):152.1℃(无水) 相对密度(水=1):1.46(无水) 饱和蒸气压(kPa):0.13(15.3℃) 危险特性 是强氧化剂并具有腐蚀性,在碱性液,本身不 燃烧,但能与可燃物反应放出大量热量和气氛 而引起着火爆炸。遇强光、受热与许多无机化 合物或杂质等存在条件下易加速分解,甚至爆 炸,与许多有机物接触易形成爆炸性混合物。接触后表现 吸入该品蒸气或雾对呼吸道有强烈刺 激性。眼直接接触液体可致不可逆损伤 甚至失明。口服中毒出现腹痛、胸口痛、 呼吸困难、呕吐、一时性运动和感觉障 碍、体温升高等。个别病例出现视力障 碍、癫痫样痉挛、轻瘫。[ 现场急救措施 皮肤接触:脱去被污染的衣着,用大量流动清 水冲洗。眼睛接触:立即提起眼睑,用大量流 动清水或生理盐水彻底冲洗至少15分钟。就医。 吸入:迅速脱离现场至空气新鲜处。保持呼吸 道通畅。如呼吸困难,给输氧。如呼吸停止, 立即进行人工呼吸。就医。食入:饮足量温水, 催吐,就医。 身体防护措施 灭火方法:消防人员必须穿全身防火防毒服,在上风向灭火。尽可能将容器从火场移至空旷处。喷水保持火场容器冷却,直至灭火结束。处在火场中的容器若已变色或从安全泄压装置中产生声音,必须马上撤离。灭火剂:水、雾状水、干粉、砂土。 泄漏应急处理:迅速撤离泄漏污染人员至安全区,并进行隔离,严格限制出入。建议应急处理人员戴自给正压式呼吸器,穿防酸碱工作服。尽可能切断泄漏源,防止进入下水道、排洪沟等限制性空间。小量泄漏:用砂土、蛭石或其它惰性材料吸收。也可以用大量水冲洗,洗水稀释后放入废水系统。大量泄漏:构筑围堤或挖坑收容;喷雾状水冷却和稀释蒸汽、保护现场人员、把泄漏物稀释成不燃物。用泵转移至槽车或专用收集器内,回收或到家至废物处理场所处置。 浓度 MAC(mg/m3):28% 当地应急救援单位名称 泰兴市消防大队 泰兴市人民医院 当地应急救援单位电话 市消防中心:119 市人民医院:120
雷达线性调频信号(LFM)脉冲压缩
西南科技大学 课程设计报告 课程名称: 设计名称:雷达线性调频信号的脉冲压缩处理 姓名: 学号: 班级: 指导教师: 起止日期: 2010.12.25-----2011.1.5
课程设计任务书 学生班级:学生姓名:学号: 设计名称:雷达线性调频信号的脉冲压缩处理 起止日期:2010、12、25——2011、1、03 指导教师: 课程设计学生日志
课程设计考勤表 课程设计评语表
雷达线性调频信号的脉冲压缩处理 一、 设计目的和意义 掌握雷达测距的工作原理,掌握匹配滤波器的工作原理及其白噪声背景下的匹配滤波的设计,线性调频信号是大时宽频宽积信号;其突出特点是匹配滤波器对回波的多普勒频移不敏感以及更好的低截获概率特性。LFM 信号在脉冲压缩体制雷达中广泛应用;利用线性调频信号具有大带宽、长脉冲的特点,宽脉冲发射已提高发射的平均功率保证足够的作用距离;而接受时采用相应的脉冲压缩算法获得窄脉冲已提高距离分辨率,较好的解决了雷达作用距离和距离分辨率之间的矛盾;。而利用脉冲压缩技术除了可以改善雷达系统的分辨力和检测能力,还增强了抗干扰能力、灵活性,能满足雷达多功能、多模式的需要。 二、 设计原理 1、匹配滤波器原理: 在输入为确知加白噪声的情况下,所得输出信噪比最大的线性滤波器就是匹配滤波器,设一线性滤波器的输入信号为)(t x : )()()(t n t s t x += 其中:)(t s 为确知信号,)(t n 为均值为零的平稳白噪声,其功率谱密度为2/No 。 设线性滤波器系统的冲击响应为)(t h ,其频率响应为)(ωH ,其输出响应: )()()(t n t s t y o o += 输入信号能量: ∞<=?∞ ∞-dt t s s E )()(2 输入、输出信号频谱函数: dt e t s S t j ?∞ ∞--=ωω)()( )()()(ωωωS H S o = ωωωπωωd e S H t s t j o ?∞ -=)()(21)( 输出噪声的平均功率: ωωωπ ωωπd P H d P t n E n n o o ??∞∞-∞∞-==)()(21)(21)]([22 ) ()()(2)()(21 2 2 ωωωπ ωωπ ωωd P H d e S H SNR n t j o o ? ? ∞ ∞ -∞ ∞-=
用 7-ZIP 制作软件安装包详细教程
用 7-ZIP 制作软件安装包详细教程 一、准备工具 1. 要使用到的工具有 7-ZIP压缩软件、自释放模块7zS.sfx 、ResHacker。 2. 首先先下载最新的7-ZIP压缩软件,百度一下,到处都是!下载后安装好! 3. 自释放模块7zS.sfx (附件中下载) 4. 如果你的安装程序是*.msi格式的,还要用到一个工具:Msistub.exe (附件中下载) 5. ResHacker(附件中下载、远景论坛的ResHacker) 二、制作开始(这里我以制作MS_Office2003SP3的安装包为例) (一). 首先是安装7-ZIP压缩软件,这步不用多说了! (二). 压缩安装文件: 1. 新建一个文件夹,将要安装的文件全部复制进去,如果你安装程序是*.msi格式的,请保证文件 Msistub.exe 也在这个文件夹中。同时确认要制作的文件包的文件名在8个字符以下且没有空格。 2. 打开7Z压缩工具,找到整合好的Office2003SP3安装文件,全选,然后点击"添加"按钮,如图1所示: 3. 为你的压缩文件命名为任何自己想要的文件名,但不要有空格(比如我这次是命名为office2003.7z),选择"压缩等级"为"极限压缩",单击"确定"开始创建压缩文件,如图2所示:
"极限压缩"是非常消耗内存和CPU,建议你先停下所有操作!如果你要压缩的文件很大,那就要花比较长的时间来压缩,这段时间你可以去抽支烟(善意提醒:吸烟有害身体!)或喝杯咖啡、或者喝茶也行! 4. 压缩文件完成后,你就可以删除除该压缩文件以外的所有文件! (三) 修改 7zs.sfx 1. 复制7zs.sfx 到文件夹包括那个刚创建的文档; 2. 现在我们开始用ResHacker来修改自释放模块 7zS.sfx,在这里你可以为你将要制作的安装包定制属性,如图标、文件描述、版本、公司、备注等待!打开 ResHacker,选择“文件”-“打开”,打开文件夹中的 7zS.sfx 文件,具体修改如下:
危险化学品安全周知卡(样本)
危险性类别 腐蚀 品名、英文名及分子式、CC码及CAS号 硫酸 Sulfuric acid 危险性标志 危险性理化数据 熔点(℃): 沸点(℃):330 危险特性 遇水爆溅;遇H发泡剂会引起燃烧;遇易燃 物;有机物会引起燃烧;遇氰化物会产生剧接触后表现 对皮肤、粘膜等组织有强烈的刺激和腐蚀 作用。口服后引起消化道烧伤以致溃疡形 成;皮肤灼伤轻者出现红斑,重者形成溃 疡;溅入眼内可造成灼伤,甚至角膜穿孔、 全眼炎以至失明。 现场急救措施 皮肤接触:立即脱去所污染的衣服,用大量 流动清水冲洗至少15分钟上;就医。 眼睛接触:立即提起眼睑,用大量流动清水 或生理盐水彻底冲洗至少15分钟;就医。 吸入:迅速转移到空气新鲜处,给输氧,就身体防护措施 泄漏应急处理 迅速撤离泄漏污染区人员至安全区,并进行隔离,严格限制出入。建议应急处理人员戴自给正压式呼吸器,穿防酸碱工作服。不要直接接触泄漏物。尽可能切断泄漏源。防止进入限制浓度 MAC(mg/m3):2 当地应急救援单位名称 临海市消防中心 当地应急救援单位电话 市消防中心:119
危险性类别 腐蚀 品名、英文名及分子式、CC码及CAS码 氢氧化钠(液碱) Sodiun hydroxide 危险性标志 危险性理化数据 熔点(℃): 沸点(℃):1390 危险特性 遇酸发生剧烈反应;触及皮肤有强烈刺激作 用而造成灼伤;有强腐蚀性;水解后产生腐接触后表现 本品有强烈刺激和腐蚀性。粉尘刺激眼和 呼吸道,腐蚀鼻中隔;皮肤和眼直接接触 可引起灼伤;误服后可造成消化道灼伤, 粘膜糜烂、出血和休克。 现场急救措施 皮肤接触:立即脱去所污染的衣服,用大量 流动清水冲洗至少15分钟上;就医。 眼睛接触:立即提起眼睑,用大量流动清水 或生理盐水彻底冲洗至少15分钟;就医。 吸入:迅速转移到空气新鲜处,给输氧,就身体防护措施 泄漏处理及防火防爆措施 隔离泄漏污染区,限制出入。建议应急处理人员戴自给式呼吸器,穿防酸工作服。不要直接接触泄漏物。小量泄漏:避免扬尘,用洁净的铲子收集于干燥、洁净、有盖的容器中。也可浓度 MAC(mg/m3): 当地应急救援单位名称 临海市消防中心 当地应急救援单位电话 市消防中心:119
线性调频(LFM)脉冲压缩雷达仿真
线性调频(LFM )脉冲压缩雷达仿真 一. 雷达工作原理 雷达是Radar (RAdio Detection And Ranging )的音译词,意为“无线电检测和测距”,即利用无线电波来检测目标并测定目标的位置,这也是雷达设备在最初阶段的功能。典型的雷达系统如图1.1,它主要由发射机,天线,接收机,数据处理,定时控制,显示等设备组成。利用雷达可以获知目标的有无,目标斜距,目标角位置,目标相对速度等。现代高分辨雷达扩展了原始雷达概念,使它具有对运动目标(飞机,导弹等)和区域目标(地面等)成像和识别的能力。雷达的应用越来越广泛。 图1.1:简单脉冲雷达系统框图 雷达发射机的任务是产生符合要求的雷达波形(Radar Waveform ),然后经馈线和收发开关由发射天线辐射出去,遇到目标后,电磁波一部分反射,经接收天线和收发开关由接收机接收,对雷达回波信号做适当的处理就可以获知目标的相关信息。 假设理想点目标与雷达的相对距离为R ,为了探测这个目标,雷达发射信号()s t ,电磁波以光速C 向四周传播,经过时间R C 后电磁波到达目标,照射到目标上的电磁波可写成: ()R s t C - 。电磁波与目标相互作用,一部分电磁波被目标散射,被反射的电磁波为()R s t C σ?-,其中σ为目标的雷达散射截面(Radar Cross Section ,简称RCS ) ,反映目标对电磁波的散射能力。再经过时间R C 后,被雷达接收天线接收的信号为(2)R s t C σ?-。 如果将雷达天线和目标看作一个系统,便得到如图1.2的等效,而且这是一个LTI (线性时不变)系统。 图1.2:雷达等效于LTI 系统 等效LTI 系统的冲击响应可写成: 1 ()()M i i i h t t σδτ== -∑ (1.1)
线性调频(LFM)信号脉冲压缩仿真
随机信号处理实验 ————线性调频(LFM)信号脉冲压缩仿真 姓名:钱振宇 学号: 0904210144
一、实验目的: 1、了解线性FM 信号的产生及其性质; 2、熟悉MATLAB 的基本使用方法; 3、利用MATLAB 语言编程匹配滤波器。 4、仿真实现FM 信号通过匹配滤波器实现脉压处理,观察前后带宽及增益。 5、步了解雷达中距离分辨率与带宽的对应关系。 二、实验内容: 1、线性调频信号 线性调频矩形脉冲信号的复数表达式为: ()()2001222j f t j f t ut lfm t t u t Arect S e e ππτ??+ ?????== ??? ()211,210,2 j ut t t t u t Arect rect t e πττττ?≤??????==? ? ??????>??为信号的复包络,其中为矩形函数。 0u f τ式中为脉冲宽度,为信号瞬时频率的变化斜率,为发射频率。 当1B τ≥(即大时宽带宽乘积)时,线性调频信号特性表达式如下: 0()2LFM f f f rect u B S -??= ???幅频特性: 2 0()()4LFM f f f u ππφ-=+相频特性: 20011222i d f f t ut f ut dt ππ????=+=+ ???? ???信号瞬时频率: 程序如下: %%产生线性调频信号 T=10e-6; %脉冲宽度 B=400e6; %chirp signal 频带宽度400MHz K=B/T; %斜率 Fs=2*B;Ts=1/Fs; %采样频率与采样周期 N=T/Ts %N=8000 t=linspace(-T/2,T/2,N); %对时间进行设定 St=exp(j*pi*K*t.^2) %产生chirp signal
Autoit制作软件自动安装包
经常需要帮别人安装一些常用软件,“下一步”、修改安装目录等等,总得做很多重复的工作,很久之前就看到一些高手用autoit 来做一些软件的“自动安装”,软件的整个安装过程是全自动的,不需要点击或者输入任何东西,非常方便。 方法一: 由于对autoit不是很了解,一直没做出自己需要的“自动安装”,虽然也尝试用其他的工具制作过类似的“自动安装”,但是效果不是太好。 今天无意看到一篇文章《制作软件自动化安装的最简便的方法[By Gooker]》,如茅塞顿开,获益匪浅,感谢原作者。 下载自动化编写任务脚本autoit v3.2.55中文绿色版-目前最新是v3版本,类似BASIC语言风格的脚本程序的免费软件,它被设计用来在Windows GUI中进行自动操作.通过它可以组合使用模拟键击,鼠标移动和窗口/控件操作等来实现自动化任务,这是其它语言所无法做到或尚无可靠方法实现的。 这个方法不是用别的工具,正是AU3自带的。最简便的方法是什么样子的: 执行一遍软件的安装,就出来代码了,编译一下就出来工具了。 OK,先说明用的不是用Autoit宏生成器,总感觉那个玩意不准(不知道是不是没用过的原因),其实可能大家也在使用的时候碰到过,偶然按出来了,或者老手都知道这个软件。 好了,现在告诉你如何做: 1、打开 目录是:AutoIt3\SciTe\ScriptWriter 下面的 AU3Record.exe文件 2、主角就出现了,建议选中"Record Window Text"(记录窗口文字),另外"Record Mouse"必选,然后browse选择你想要自动安装的软件; 3、选择好之后就点击"Click To Record"的图标,之后就安装你的软件,你的操作都会被记录,这个记录方式是完全模拟的,包括鼠标的移动、点击等等; 4、软件安装完毕之后,我们点击右上角这个
线性调频脉冲雷达信号matlab仿真
二〇一年十月 课题小论文 题 目:线性调频(LFM )脉冲压缩雷达仿真学院:专 业: 学生姓名:刘斌学号:年 级: 指导教师:
线性调频(LFM )脉冲压缩雷达仿真 一.雷达工作原理 雷达是Radar (RAdio Detection And Ranging )的音译词,意为“无线电检测和测距”,即利用无线电波来检测目标并测定目标的位置,这也是雷达设备在最初阶段的功能。典型的雷达系统如图1.1,它主要由发射机,天线,接收机,数据处理,定时控制,显示等设备组成。利用雷达可以获知目标的有无,目标斜距,目标角位置,目标相对速度等。现代高分辨雷达扩展了原始雷达概念,使它具有对运动目标(飞机,导弹等)和区域目标(地面等)成像和识别的能力。雷达的应用越来越广泛。 图1.1:简单脉冲雷达系统框图 雷达发射机的任务是产生符合要求的雷达波形(Radar Waveform ),然后经馈线和收发开关由发射天线辐射出去,遇到目标后,电磁波一部分反射,经接收天线和收发开关由接收机接收,对雷达回波信号做适当的处理就可以获知目标的相关信息。 假设理想点目标与雷达的相对距离为R ,为了探测这个目标,雷达发射信号()s t ,电磁波以光速C 向四周传播,经过时间R 后电磁波到达目标,照射到目标上的电磁波可写成: ()R s t C - 。电磁波与目标相互作用,一部分电磁波被目标散射,被反射的电磁波为()R s t C σ?-,其中σ为目标的雷达散射截面(Radar Cross Section ,简称RCS ),反映目 标对电磁波的散射能力。再经过时间R 后,被雷达接收天线接收的信号为(2)R s t C σ?-。 如果将雷达天线和目标看作一个系统,便得到如图1.2的等效,而且这是一个LTI (线性时不变)系统。 图1.2:雷达等效于LTI 系统 等效LTI 系统的冲击响应可写成: 1 ()() M i i i h t t σδτ==-∑(1.1)
雷达线性调频脉冲压缩的原理及其MATLAB仿真
雷达线性调频脉冲压缩的原理及其MATLAB仿真
线性调频(LFM)脉冲压缩雷达仿真 一.雷达工作原理 雷达是Radar(RAdio Detection And Ranging)的音译词,意为“无线电检测和测距”,即利用无线电波来检测目标并测定目标的位置,这也是雷达设备在最初阶段的功能。典型的雷达系统如图1.1,它主要由发射机,天线,接收机,数据处理,定时控制,显示等设备组成。利用雷达可以获知目标的有无,目标斜距,目标角位置,目标相对速度等。现代高分辨雷达扩展了原始雷达概念,使它具有对运动目标(飞机,导弹等)和区域目标(地面等)成像和识别的能力。雷达的应用越来越广泛。 图1.1:简单脉冲雷达系统框图 雷达发射机的任务是产生符合要求的雷达波形(Radar Waveform),然后经馈线和收发开关
由发射天线辐射出去,遇到目标后,电磁波一部分反射,经接收天线和收发开关由接收机接收,对雷达回波信号做适当的处理就可以获知目标的相关信息。 假设理想点目标与雷达的相对距离为R,为了探测这个目标,雷达发射信号()s t,电磁波以光速C向四周传播,经过时间R C后电磁波到达目 标,照射到目标上的电磁波可写成:()R -。电磁 s t C 波与目标相互作用,一部分电磁波被目标散射, 被反射的电磁波为()R σ?-,其中σ为目标的雷达 s t C 散射截面(Radar Cross Section ,简称RCS),反映目标对电磁波的散射能力。再经过时间R C后, 被雷达接收天线接收的信号为(2)R σ?-。 s t C 如果将雷达天线和目标看作一个系统,便得到如图1.2的等效,而且这是一个LTI(线性时不变)系统。 图 1.2:雷达等效于LTI系统
软件自动安装之静默安装参数汇总
软件自动安装之静默安装参数 大部分软件,其安装都具备一定的智能性,换句话说,许多软件的安装都能采取全自动或半自动的方式进行。 一、Microsoft Windows Installer 如果某个软件是用Windows Installer 打包的,那你就应该能在文件夹中看到*.msi 文件。这是最典型的特征,这些文件通常可以使用/QB 和/QN 参数进行自动安装。/qb 会在窗口中显示一个基本的安装进程。/qn 参数则不会显示任何窗口,直接在后台自动安装。为了阻止某些程序安装成功后自动重启动(例如Kerio Personal Firewall 4),你可以在/qn 或者/qb参数后使用REBOOT=Suppress标记。例如:安装虚拟光驱DaemonTools:msiexec /i dtools.msi /qb REBOOT=SUPPRESS 二、Windows 补丁包 有两种情况,一种是类似IE增量补丁包的那种安装文件,要使之静默安装,只需要在执行文件后加上/q:a /r:n 参数即可;一种是Windows 常用的补丁文件,一般情况下加上/U /N /Z 即可实现静默安装。(对于新的系统补丁,也可使用/passive /norestart)。这通用大部分情况,但某些特定的补丁不能用此法进行静默安装。 三、InstallShield
1、要使用静默安装的方式安装用InstallShield技术打包的程序,首先要在现有的操作系统中创建一个setup.iss文件。在命令行窗口中使用-R 参数(大小写敏感)运行安装程序。例如:Setup.exe -R 2、接着会显示常见的安装屏幕,并且询问你一些问题,例如要安装的目录等有一点是很重要的,在安装结束后你不能选择“立刻重启动计算机”的选项。如果你选了,在批处理文件中的其他命令就会因为计算机重启动而无法执行。 3、在安装程序运行完毕后,打开你的C:\Windows(或者C:\WINNT)目录,然后找到setup.iss 文件,把这个文件和你将要静默安装的程序setup.exe 保存在同一个目录中。 4、用以下命令进行静默安装:setup.exe -s [-sms] 说明:怎么知道哪个程序是使用InstallShield技术打包的?大部分这类程序的安装文件都可以被压缩软件解压缩,安装文件setup.exe 的属性对话框中应该有“InstallShield (R) Setup Launcher”或者其他类似的字样。最后,如果你在保存安装文件的文件夹中看到了一个setup.iss 文件,那么毫无疑问这是用InstallShield 打包了! 四、InstallShield with MSI InstallShield with MSI 制作的安装文件,请使用类似:setup.exe /s /v "/qb" 来安装。 五、WISE Installer
软件自动安装包制作(InstallRite)图文教程
软件自动安装包制作(InstallRite)图文教程 现在越来越多的朋友在研究软件自动安装,各种各样的方法层出不穷,本人比较懒,喜欢用比较简单和快速的方法,找了N久让我找到了这个InstallRite这个软件,经过试用和测试,个人认为还是比较简单且容易上手的东西,现在发出来和大家分享下: 首先下载并安装InstallRite,打开InstallRite.exe,看到如图所示: 点击安装新的软件并接创建一个安装包,看到如图所示:
下一步:
下一步:这里建议关闭所有运行着的程序,因为你在安装软件的期间如果其它软件正在硬盘些东西又或者在注册表添加东西都会被InstallRite所监听到。 这时InstallRite会自动扫描系统目录和注册表并创建一个快照,如图: 扫描完毕之后选择需要安装的软件,然后点下一步进行安装,怎么安装软件就不用我说了吧! 等到你需要安装的软件安装完毕之后你会看到下面的提示:
直接点下一步,这时InstallRite会自动对比软件安装之前和安装之后系统的所有改变: 对比完毕之后要求你输入你所安装程序的名字,输入之后点确定。
点击确定之后就会出现如下界面: 这时你可以直接点击构建安装包来生成自动安装的程序,如果我们还需要进一步调整的话就先点击完成回到软件初始界面然后再点击检查安装打开如下界面:
在这里你可以删除一些你不希望创建的文件,比如一些快捷方式和临时文件。如果你的其它程序正在处于运行状态也会被InstallRite监听,如杀毒软件,QQ等等。所以我们将一些自己觉得没必要的文件删除掉尽量减少文件的大小。清理完毕之后直接关闭窗口再打开InstallRite初始界面,现在可以点击初始界面里的构建一个安装包了: 选中我们刚才安装的软件之后直接点击确定然后保存。当点击保存之后就会出现如下窗口:
雷达线性调频脉冲压缩的原理及其MATLAB仿真汇总
线性调频(LFM )脉冲压缩雷达仿真 宋萌瑞 201421020302 一. 雷达工作原理 雷达是Radar (RAdio Detection And Ranging )的音译词,意为“无线电检测和测距”,即利用无线电波来检测目标并测定目标的位置,这也是雷达设备在最初阶段的功能。典型的雷达系统如图1.1,它主要由发射机,天线,接收机,数据处理,定时控制,显示等设备组成。利用雷达可以获知目标的有无,目标斜距,目标角位置,目标相对速度等。现代高分辨雷达扩展了原始雷达概念,使它具有对运动目标(飞机,导弹等)和区域目标(地面等)成像和识别的能力。雷达的应用越来越广泛。 图1.1:简单脉冲雷达系统框图 雷达发射机的任务是产生符合要求的雷达波形(Radar Waveform ),然后经馈线和收发开关由发射天线辐射出去,遇到目标后,电磁波一部分反射,经接收天线和收发开关由接收机接收,对雷达回波信号做适当的处理就可以获知目标的相关信息。 假设理想点目标与雷达的相对距离为R ,为了探测这个目标,雷达发射信号()s t ,电磁波以光速C 向四周传播,经过时间R C 后电磁波到达目标,照射到目标上的电磁波可写成: ()R s t C - 。电磁波与目标相互作用,一部分电磁波被目标散射,被反射的电磁波为()R s t C σ?-,其中σ为目标的雷达散射截面(Radar Cross Section ,简称RCS ) ,反映目标对电磁波的散射能力。再经过时间R C 后,被雷达接收天线接收的信号为(2)R s t C σ?-。 如果将雷达天线和目标看作一个系统,便得到如图1.2的等效,而且这是一个LTI (线性时不变)系统。 图1.2:雷达等效于LTI 系统 等效LTI 系统的冲击响应可写成:
巴克码—线性调频脉冲多普勒雷达matlab代码
巴克码—线性调频脉冲多普勒雷达matlab代码%% 雷达系统仿真 %% % 发射信号为13位巴克码和线性调频混合调制的信号,线性调频的中心频率为30MHz, % 调频带宽为4MHz,每一位码宽为10微秒,发射信号的帧周期为1毫秒 % 该雷达具有数字化正交解调、数字脉冲处理、固定目标对消、动目标检测(MTD)、 % 和恒虚警(CFAR)处理等功能 close all;clear all;clc; %%%%%%%%%%%%%%% 产生雷达发射信号 %%%%%%%%%%%%% code=[1,1,1,1,1,-1,-1,1,1,-1,1,-1,1]; % 13位巴克码 tao=10e-6; % 脉冲宽度10us fc=28e6; % 调频信号起始频率 f0=30e6; % 调频信号中心频率 fs=100e6; % 采样频率 ts=1/fs; % 采样间隔 B=4e6; % 调频信号调频带宽 t_tao=0:1/fs:tao-1/fs; % 调制信号,对于线性调频来说,调制信号就是时间序列 N=length(t_tao); k=B/fs*2*pi/max(t_tao); % 调制灵敏度,也就是线性调频的步进系数 n=length(code); pha=0; s=zeros(1,n*N); for i=1:n
if code(i)==1 pha=pi; else pha = 0; end s(1,(i-1)*N+1:i*N)=cos(2*pi*fc*t_tao+k*cumsum(t_tao)+pha); end t=0:1/fs:n*tao-1/fs; figure,subplot(2,1,1),plot(t,s); xlabel('t(单位:S)'),title('混合调制信号(13为巴克码+线性调频)'); s_fft_result=abs(fft(s(1:N))); subplot(2,1,2),plot((0:fs/N:fs/2-fs/N),abs(s_fft_result(1:N/2))); xlabel('频率(单位:Hz)'),title('码内信号频谱'); %%%%%%%%%%%%%%%%%%% 产生脉冲压缩系数 %%%%%%%%%%%%%%%% %--------------------- 正交解调 --------------------% N=tao/ts; n=0:N-1; s1=s(1:N); local_oscillator_i=cos(2*pi*f0/fs*n); % I路本振信号 local_oscillator_q=sin(2*pi*f0/fs*n); % Q路本振信号 fbb_i = local_oscillator_i.*s1; % I路解调 fbb_q = local_oscillator_q.*s1; % Q路解调 window=chebwin(51,40); % 50阶cheby窗的FIR低通滤波器 [b,a]=fir1(50,2*B/fs,window); fbb_i=[fbb_i,zeros(1,25)]; % 因为该FIR滤波器有25个采样周期的延迟,为了保证
VS制作安装包包含卸载程序
VS 制作安装包包含卸载程序 Net 程序打包安装与卸载制作——问题描述(一)项目已将近完工,怎样将你的程序打包,包装成一个完美的安装程序呢? 今天我将我个人使用.Net 制作打包程序的经验分享给大家,不足之处还希望大家能够给予指正。面对对.Net 平台开发出来的程序,它的运行对系统环境要求有点高,需要.Net Framework 的支持,所以首先面对的问题是怎样将.Net Framework1.1 或2.0 安装在一台没有以前没有装过的机子上。以下是我在打包过程中需要解决的问题:一.怎样将.NET 程序部署到没有安装_NET Framwork 的机器上? 二.怎样在打包程序中自动安装SQL Server 数据库?三.怎样将MSDE Sp3 打包进.Net 安装项目中?四.怎样将MDAC 打包进.Net 安装项目中?五.怎样制作.Net 卸载程序?六.怎样创建各种快捷方式?解决了以上的问题后,基本上能够满足你的安装项目需要了吧?好了废话少说,现在我们马上来动手制作。 .Net 程序打包安装与卸载制作——怎样将.Net 程序部署到没有安装.Net Framwork 的机器上?(二)怎样将.Net 程序部署到没有安装.Net Framwork 的机器上?
部署在.Net 平台下开发的应用程序,需要安装安装对应版本 的.Net Framwork, 而Vsual Studio 2003 并没有提供一起打包的功能,所以这一点估计大多开发者都感觉不是太好,那如何将.Net Framework 安装部署到客户机上呢?其实微软提供了我们一个安装引导插件( Microsoft Visual Studio .NET 2003 引导程序插件) ,可以帮助我们在打包时,它会自动将.Net Framework 打包放入你的安装程序中,完成了我们想要的功能。建立安装程序项目,将自己需要打包的程序加入进去,编译过后,你会注意到在生成的安装目录下,你将会注意到多了几个文件( dotnetfx.exe 、Config.ini 、langpack.exe 、Settings.ini ),详细介绍如下:Config.ini —安装配置文件dotnetfx.exe —.Net Framework 组件langpack.exe —语言包Settings —设置文件ItemSoft.msi —.msi 安装文件 Setup.exe —主安装程序Config 的文件内容如下:[config.ini] IDS_NOT_SINGLE_INSTANCE= 已有另一版本的安装程序正在运行。该应用程序一次只能运行一个版本。 IDS_DIALOG_CAPTION=%s 安装 IDS_SINGLE_INSTANCE_FAIL=CreateMutex 无法对单个的实例检查分配句柄。 IDS_SETUP_FAILURE=%s 安装失败。如果问题继续存在,请与产品支持人员联系。 IDS_DEFAULT_PRODUCTNAME= 应用程序 IDS_SETTINGS_INIT_FAILURE= 安装设置文件’%s 在解析