nagios服务器和客户端设置
配置Nagios服务器并实现本地监控
一、需要安装的软件:
nagios-3.3.1.tar.gz
nagios-plugins-1.4.15.tar.gz
nrpe-2.12.tar.gz
注:需要使用到APACHE服务,如果需要本地数据库需要安装mysql-devel库,可使用以下命令
#yum -y install mysql-devel
注:需要创建mysql数据库和用户
进入MYSQL
后使用以下命令
create database nagdb;
grant select on nagdb.* to 'nagios'@'%';
二、安装配置Nagios和Nagios-plugins:
1.首先在Apache配置文件httpd.conf中的最下方添加如下字段:
ScriptAlias /nagios/cgi-bin /usr/local/nagios/sbin
AuthType Basic
Options ExecCGI
AllowOverride None
Order allow,deny
Allow from all
AuthName "Nagios Access"
AuthUserFile /usr/local/nagios/etc/htpasswd
Require valid-user
Alias /nagios /usr/local/nagios/share
AuthType Basic
Options None
AllowOverride None
Order allow,deny
Allow from all
AuthName "nagios Access"
AuthUserFile /usr/local/nagios/etc/htpasswd
Require valid-user
2.增加帐号:nagios
# useradd nagios -s /sbin/nologin
3.安装Nagios软件
# nagios-3.3.1.tar.gz
# cd ./nagios
# ./configure --prefix=/usr/local/nagios --with-nagios-user=nagios --with-nagios-group=nagios make all
make install
make install-commandmode
make install-config
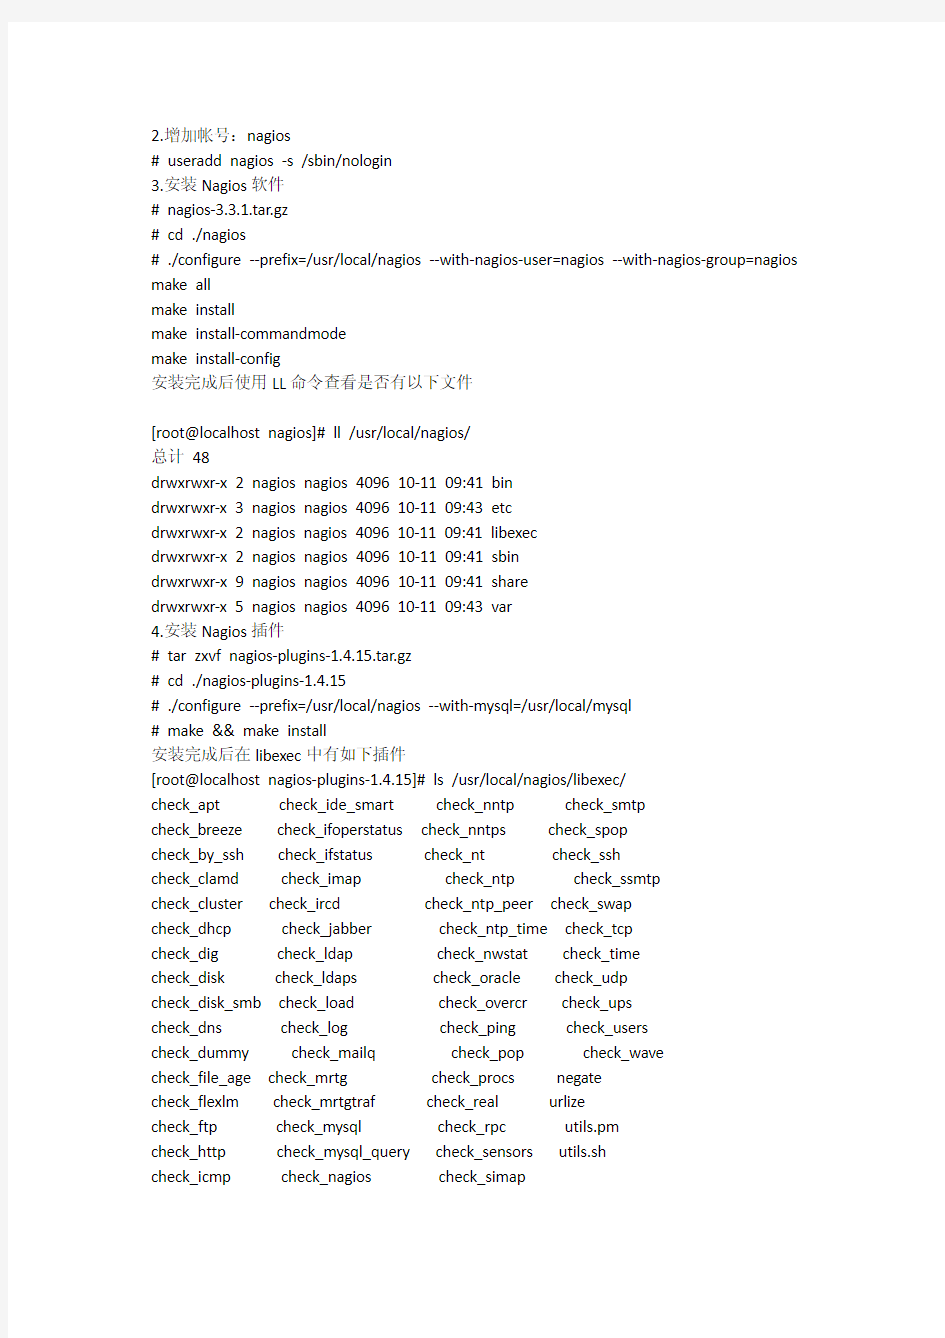
安装完成后使用LL命令查看是否有以下文件
[root@localhost nagios]# ll /usr/local/nagios/
总计48
drwxrwxr-x 2 nagios nagios 4096 10-11 09:41 bin
drwxrwxr-x 3 nagios nagios 4096 10-11 09:43 etc
drwxrwxr-x 2 nagios nagios 4096 10-11 09:41 libexec
drwxrwxr-x 2 nagios nagios 4096 10-11 09:41 sbin
drwxrwxr-x 9 nagios nagios 4096 10-11 09:41 share
drwxrwxr-x 5 nagios nagios 4096 10-11 09:43 var
4.安装Nagios插件
# tar zxvf nagios-plugins-1.4.15.tar.gz
# cd ./nagios-plugins-1.4.15
# ./configure --prefix=/usr/local/nagios --with-mysql=/usr/local/mysql
# make && make install
安装完成后在libexec中有如下插件
[root@localhost nagios-plugins-1.4.15]# ls /usr/local/nagios/libexec/
check_apt check_ide_smart check_nntp check_smtp
check_breeze check_ifoperstatus check_nntps check_spop
check_by_ssh check_ifstatus check_nt check_ssh
check_clamd check_imap check_ntp check_ssmtp
check_cluster check_ircd check_ntp_peer check_swap
check_dhcp check_jabber check_ntp_time check_tcp
check_dig check_ldap check_nwstat check_time
check_disk check_ldaps check_oracle check_udp
check_disk_smb check_load check_overcr check_ups
check_dns check_log check_ping check_users
check_dummy check_mailq check_pop check_wave
check_file_age check_mrtg check_procs negate
check_flexlm check_mrtgtraf check_real urlize
check_ftp check_mysql check_rpc utils.pm
check_http check_mysql_query check_sensors utils.sh
check_icmp check_nagios check_simap
5.置Nagios文件
#vim /usr/local/nagios/etc/nagios.cfg
列举所需要修改的文件:
nagios.cfg、cgi.cfg、commands.cfg
所需要自行创建的文件:
contactgroups.cfg、contacts.cfg、hostgroups.cfg、hosts.cfg、services.cfg 首先配置nagios.cfg
注释或删掉这行
# cfg_file=/usr/local/nagios/etc/objects/localhost.cfg
主机配置文件路径
cfg_file=/usr/local/nagios/etc/hosts.cfg
主机组配置文件路径
cfg_file=/usr/local/nagios/etc/hostgroups.cfg
联系人配置文件路径
cfg_file=/usr/local/nagios/etc/contacts.cfg
联系组配置文件路径
cfg_file=/usr/local/nagios/etc/contactgroups.cfg
服务配置文件路径
cfg_file=/usr/local/nagios/etc/services.cfg
监视时段配置文件路径
cfg_file=/usr/local/nagios/etc/timeperiods.cfg
检查命令配置文件路径
cfg_file=/usr/local/nagios/etc/commands.cfg
在WEB五重启Nagios、停机/服务检查等操作,默认值是0
check_external_commands=1
检查时间间隔,默认值是1秒
command_check_interval=10s
可直接复制以下内容:
cfg_file=/usr/local/nagios/etc/hosts.cfg
cfg_file=/usr/local/nagios/etc/hostgroups.cfg
cfg_file=/usr/local/nagios/etc/contacts.cfg
cfg_file=/usr/local/nagios/etc/contactgroups.cfg
cfg_file=/usr/local/nagios/etc/services.cfg
cfg_file=/usr/local/nagios/etc/timeperiods.cfg
cfg_file=/usr/local/nagios/etc/commands.cfg
6.配置cgi.cfg文件
需要修改的地方如下,如有多个用户,中间用逗号隔开
authorized_for_system_information=nagios
authorized_for_configuration_information=nagios
authorized_for_system_commands=nagios
authorized_for_all_services=nagiosadmin,nogios
authorized_for_all_hosts=nagios
authorized_for_all_service_commands=nagios
authorized_for_all_host_commands=nagios
注:此处设定的用户“nagios”可以通过浏览器操纵nagios服务的关闭、重启等各种操作7.修改commands.cfg配置文件
修改notify-host-by-email --> host-notify-by-email
修改notify-service-by-email --> service-notify-by-email
# 'check_nrpe' command definition
define command {
command_name check_nrpe
command_line $USER1$/check_nrpe -H $HOSTADDRESS$ -c $ARG1$
}
###### host-notify-by-sms command definition
#define command {
# command_name host-notify-by-sms
# command_line /usr/local/bin/sms.pl $CONTACTPAGER$
# "$NOTIFICATIONTYPE$ alert - Host $HOSTNAME$ is $HOSTSTATE$"
#}
###### service-notify-by-sms command definition
#define command {
# command_name service-notify-by-sms
# command_line /usr/local/bin/sms.pl $CONTACTPAGER$
#"$HOTIFICATIONTYPE$: $HOSTALIAS$/$SERVICEDESC$ is $SERVICESTATE$"
# }
#'check_mysql' command definition
define command {
command_name check_mysql
command_line $USER1$/check_mysql -H $HOSTADDRESS$ -u nagios -d nagdb
}
注释掉的部分为使用脚本发送短消息的部分
8.配置hosts.cfg文件
使用vim新建文件并输入以下内容:
define host {
host_name nagios-server
alias nagios server
address 192.168.75.128
contact_groups sagroup
check_command check-host-alive
max_check_attempts 5
notification_interval 10
notification_period 24x7
notification_options d,u,r
}
注释内容::
define host {
host_name nagios-server
alias nagios server
address 192.168.75.128 ==>填写主机IP地址
contact_groups sagroup ==>联系组目前还未建立,稍后进行创建check_command check-host-alive
max_check_attempts 5 ==>最大尝试次数
notification_interval 10 ==>通知间隔此为10分钟1次notification_period 24x7 ==>通知周期此为全天工作
notification_options d,u,r ==>d=down、u=unreacheable、r=recovery }
9.配置hostgroups.cfg
define hostgroup {
hostgroup_name sa-servers
alias sa servers
members nagios-server
}
主机组成员必须是在hosts.cfg中定义的,多个主机成员间用逗号分隔10.定义联系人配置文件contacts.cfg
define contact {
contact_name nagios
alias system administrator
service_notification_period 24x7
host_notification_period 24x7
service_notification_options w,u,c,r
host_notification_options d,u,r
service_notification_commands service-notify-by-email
host_notification_commands host-notify-by-email
email gangdan0083@https://www.360docs.net/doc/0610920067.html,
}
注释内容
define contact{
contact_name nagios ==>联系人
alias system administrator
service_notification_period 24x7
host_notification_period 24x7
service_notification_options w,u,c,r ==>服务通知:w=warning、u=unknow、c=critical、r=recovery
host_notification_options d,u,r ==>主机通知:d=down、u=unreacheable、r=recovery 下面2行在配置文件commands.cfg中定义的,如有报警发生,则邮件和手机短信一直发送给相关人,即正面行定义的email和pager
service_notification_commands service-notify-by-email,service-notify-by-sms
host_notification_commands host-notify-by-email,host-notify-by-sms
email gangdan0083@https://www.360docs.net/doc/0610920067.html,
pager 12345678901
}
11.定义联系组配置文件contactgroups.cfg
define contactgroup {
contactgroup_name sagroup
alias system administrator group
members nagios
}
注:当有多个人行使同样的职责时,定义成组是非常有用的。
多个成员之间用逗号分隔
成员必须在联系人配置文件contacts.cfg中已经定义
12.定义服务配置文件services.cfg
define service {
host_name nagios-server
service_description check-host-alive
check_period 24x7
max_check_attempts 4
normal_check_interval 3
retry_check_interval 2
contact_groups sagroup
notification_interval 10
notification_period 24x7
notification_options w,u,c,r
check_command check-host-alive
}
define service {
host_name nagios-server
service_description check_tcp 80
check_period 24x7
max_check_attempts 4
normal_check_interval 3
retry_check_interval 2
contact_groups sagroup
notification_interval 10
notification_period 24x7
notification_options w,u,c,r
check_command check_tcp!80
}
define service {
host_name nagios-server
service_description check-disk
check_command check_nrpe!check_disk
max_check_attempts 4
normal_check_interval 3
retry_check_interval 2
check_period 24x7
notification_interval 10
notification_period 24x7
notification_options w,u,c,r
contact_groups sagroup
}
define service {
host_name nagios-server
service_description check-load
check_command check_nrpe!check_load
max_check_attempts 4
normal_check_interval 3
retry_check_interval 2
check_period 24x7
notification_interval 10
notification_period 24x7
notification_options w,u,c,r
contact_groups sagroup
}
define service {
host_name nagios-server
service_description total_procs
check_command check_nrpe!check_total_procs
max_check_attempts 4
normal_check_interval 3
retry_check_interval 2
check_period 24x7
notification_interval 10
notification_period 24x7
notification_options w,u,c,r
contact_groups sagroup
}
define service {
host_name nagios-server
service_description mysql
check_command check_mysql!192.168.184.144!3306!nagios
max_check_attempts 4
normal_check_interval 3
retry_check_interval 2
check_period 24x7
notification_interval 10
notification_period 24x7
notification_options w,u,c,r
contact_groups sagroup
}
注:主机名host_name必须是主机配置文件hosts.cfg中定义的主机
检查用的命令check_command要在命令配置文件中定义或在nrpe配置文件中有定义最大重试次数max_check_attempts 一般设置为3~4次比较好
三、部署Nrpe
1.安装nrpe
# tar zxvf nrpe-2.12.tar.gz
# cd ./nrpe-2.12
# ./configure --prefix=/usr/local/nrpe
make && make install
2.复制文件
cp /usr/local/nrpe/libexec/check_nrpe /usr/local/nagios/libexec
cp /usr/local/nagios/libexec/check_disk /usr/local/nrpe/libexec
cp /usr/local/nagios/libexec/check_load /usr/local/nrpe/libexec
cp /usr/local/nagios/libexec/check_ping /usr/local/nrpe/libexec
cp /usr/local/nagios/libexec/check_procs /usr/local/nrpe/libexec
cp /usr/local/nagios/libexec/check_mysql /usr/local/nrpe/libexec
3.配置NRPE
创建新目录:
# mkdir /usr/local/nrpe/etc
复制配置文件
# cp /nrpe-2.12/sample-config/nrpe.cfg /usr/local/nrpe/etc
修改配置文件:
server_address=192.168.75.128
allowed_hosts=127.0.0.1,192.168.75.128
command[check_users]=/usr/local/nrpe/libexec/check_users -w 5 -c 10
command[check_load]=/usr/local/nrpe/libexec/check_load -w 15,10,5 -c 30,25,20
#command[check_hda1]=/usr/local/nrpe/libexec/check_disk -w 20% -c 10% -p /dev/hda1 command[check_zombie_procs]=/usr/local/nrpe/libexec/check_procs -w 5 -c 10 -s Z command[check_total_procs]=/usr/local/nrpe/libexec/check_procs -w 150 -c 200
command[check_disk]=/usr/local/nrpe/libexec/check_disk -w 20 -c 10 -p
4.启动NRPE服务并检验其配置
启动服务:
# /usr/local/nrpe/bin/nrpe -c /usr/local/nrpe/etc/nrpe.cfg -d
检查NRPE服务:
# libexec/check_nrpe -H 主机名
检查主机资源:
# libexec/check_nrpe -H 主机名-c check_disk
四、启动nagios服务:
1.检查配置是否正确
# /usr/local/nagios/bin/nagios -v /usr/local/nagios/etc/nagios.cfg
2.启动nagios
# /usr/local/nagios/bin/nagios -d /usr/local/nagios/etc/nagios.cfg
3.创建WEB验证用户
# /usr/local/apache2/bin/htpasswd -c /usr/local/nagios/etc/htpasswd nagios
五、启动APACHE
1.上面的步骤都成功之后重新启动APACHE服务后在WEB中输入//HOST/nagios后提示密码输入,输入用户名和密码后进入Nagios界面,实验成功,完成对本机的
监控操作,并具有发送EMAIL的功能
查看nagios进程
ps aux|grep nrpe|grep -v grep
注:如果在check_disk中显示黄色并报Unknown argument 错误的话,建议重新KILL nagios 进程再启动服务,或者重启主机后再启动服务问题解决。
监控第2台主机
一、需要安装的软件:
nagios-plugins-1.4.15.tar.gz
nrpe-2.12.tar.gz
注:如果需要本地数据库需要安装mysql-devel库,可使用以下命令
#yum -y install mysql-devel
注:需要创建mysql数据库和用户
进入MYSQL
后使用以下命令
create database nagdb;
grant select on nagdb.* to 'nagios'@'%';
添加系统用户nagios
useradd nagios -s /sbin/nologin
安装Nagios插件
# tar zxvf nagios-plugins-1.4.15.tar.gz
# cd ./nagios-plugins-1.4.15
# ./configure --prefix=/usr/local/nagios --with-mysql=/usr/local/mysql
# make && make install
安装Nrpe
1.安装nrpe
# tar zxvf nrpe-2.12.tar.gz
# cd ./nrpe-2.12
# ./configure --prefix=/usr/local/nrpe
make && make install
复制所需要的插件到/usr/local/nrpe/libexec/
例如:
cp /usr/local/nagios/libexec/check_disk /usr/local/nrpe/libexec
cp /usr/local/nagios/libexec/check_load /usr/local/nrpe/libexec
cp /usr/local/nagios/libexec/check_ping /usr/local/nrpe/libexec
cp /usr/local/nagios/libexec/check_procs /usr/local/nrpe/libexec
cp /usr/local/nagios/libexec/check_mysql /usr/local/nrpe/libexec
修改配置文件:
server_address=192.168.75.128
allowed_hosts=127.0.0.1,192.168.75.128
command[check_users]=/usr/local/nrpe/libexec/check_users -w 5 -c 10
command[check_load]=/usr/local/nrpe/libexec/check_load -w 15,10,5 -c 30,25,20
#command[check_hda1]=/usr/local/nrpe/libexec/check_disk -w 20% -c 10% -p /dev/hda1 command[check_zombie_procs]=/usr/local/nrpe/libexec/check_procs -w 5 -c 10 -s Z command[check_total_procs]=/usr/local/nrpe/libexec/check_procs -w 150 -c 200 command[check_disk]=/usr/local/nrpe/libexec/check_disk -w 20 -c 10 -p
切换nagios服务器
进行如下设置
配置hosts.cfg文件
使用vim添加以下内容:
define host {
host_name nagios-server2
alias nagios server2
address 192.168.75.136
contact_groups sagroup
check_command check-host-alive
max_check_attempts 5
notification_interval 10
notification_period 24x7
notification_options d,u,r
}
配置hostgroups.cfg文件
将以下内容:
define hostgroup {
hostgroup_name sa-servers
alias sa servers
members nagios-server
}
更改为:
define hostgroup {
hostgroup_name sa-servers
alias sa servers
members nagios-server,nagios-server2
}
配置contacts.cfg
添加以下内容:
define contact {
contact_name nagios2
alias system administrator
service_notification_period 24x7
host_notification_period 24x7
service_notification_options w,u,c,r
host_notification_options d,u,r
service_notification_commands service-notify-by-email host_notification_commands host-notify-by-email email gangdan0083@https://www.360docs.net/doc/0610920067.html,
}
配置contactgroups.cfg文件
将以下内容:
define contactgroup {
contactgroup_name sagroup
alias system administrator group members nagios
}
更改为:
define contactgroup {
contactgroup_name sagroup
alias system administrator group members nagios,nagios2
}
配置services.cfg文件
将内容更改为以下:
define service {
host_name nagios-server,nagios-server2 service_description check-host-alive check_period 24x7
max_check_attempts 4
normal_check_interval 3
retry_check_interval 2
contact_groups sagroup
notification_interval 10
notification_period 24x7
notification_options w,u,c,r
check_command check-host-alive
}
define service {
host_name nagios-server,nagios-server2 service_description check_tcp 80 check_period 24x7
max_check_attempts 4
normal_check_interval 3
retry_check_interval 2
contact_groups sagroup
notification_interval 10
notification_period 24x7
notification_options w,u,c,r
check_command check_tcp!80
}
define service {
host_name nagios-server,nagios-server2 service_description check-disk
check_command check_nrpe!check_disk
max_check_attempts 4
normal_check_interval 3
retry_check_interval 2
check_period 24x7
notification_interval 10
notification_period 24x7
notification_options w,u,c,r
contact_groups sagroup
}
define service {
host_name nagios-server,nagios-server2 service_description check-load
check_command check_nrpe!check_load
max_check_attempts 4
normal_check_interval 3
retry_check_interval 2
check_period 24x7
notification_interval 10
notification_period 24x7
notification_options w,u,c,r
contact_groups sagroup
}
define service {
host_name nagios-server,nagios-server2 service_description total_procs
check_command check_nrpe!check_total_procs max_check_attempts 4
normal_check_interval 3
retry_check_interval 2
check_period 24x7
notification_interval 10
notification_period 24x7
notification_options w,u,c,r
contact_groups sagroup
}
define service {
host_name nagios-server,
service_description mysql
check_command check_mysql!192.168.75.128!3306!nagios
max_check_attempts 4
normal_check_interval 3
retry_check_interval 2
check_period 24x7
notification_interval 10
notification_period 24x7
notification_options w,u,c,r
contact_groups sagroup
}
define service {
host_name nagios-server2,
service_description mysql
check_command check_mysql!192.168.75.136!3306!nagios
max_check_attempts 4
normal_check_interval 3
retry_check_interval 2
check_period 24x7
notification_interval 10
notification_period 24x7
notification_options w,u,c,r
contact_groups sagroup
}
注:如果TCP_80 服务报拒绝连接,请开启APACHE服务,此问题解决
nagios监控_SQLSERVER镜像_无见证服务器_实例测试
nagios监控_SQLSERVER镜像_无见证服务器_实例测试 --by Gelsey_guo 测试环境如下: OS:Windows 2008 R2 Software:Microsoft SQL Server 2008,nagios 镜像状态检测脚本:check_dbmirroring.pl、check_mssql_health.pl 脚本下载地址1:https://www.360docs.net/doc/0610920067.html,/directory/Plugins/Databases/SQLServer/Check-MSSQL-Database-Mirroring/details 脚本下载地址2:http://labs.consol.de/lang/de/nagios/check_mssql_health/ plugin安装参考地址:https://www.360docs.net/doc/0610920067.html,/tech/Monitor_SQL_Server_(MSSQL)_using_Nagios 主库IP:192.168.205.157 镜像库IP:192.168.205.158 测试库:lotbill、xclottery 测试前提:主库与镜像库间镜像正常 Nagios监控状态如下: 上图说明157与158镜像正常。 测试:
1、将157上主库切到镜像库158上 切换语句(1)如下: use master alter database LotBill set safety FULL; ALTER DATABASE LotBill SET PARTNER FAILOVER; use master alter database xclottery set safety FULL; ALTER DATABASE xclottery SET PARTNER FAILOVER; 此时157与158库中设置了镜像的库状态互换“正在还原...” nagios查看158上镜像状态: 切换主库与镜像库,执行“切换语句”。157与158库状态互换,nagios监控两机器的状态信息如下: 主备库切换正常。 2、停掉157上SQLSERVER服务(模拟主库服务崩溃状况)
nagios监控mysql详细配置
Nagios监控mysql 工作原理 利用特定的用户定期访问指定的mysql数据库。当不能访问或连不通时则报警。 配置过程如下 1、在生产库上安装nagios插件, 以nagios-plugins-1.4.15为例来讲述整个配置过程 进入nagios-plugins-1.4.15 目录 ./configure 编译 然后是编译完显示一定要有mysql支持,不然没有check_mysql这个插件 config.status: creating po/Makefile --with-apt-get-command: --with-ping6-command: /bin/ping6 -n -U -w %d -c %d %s --with-ping-command: /bin/ping -n -U -w %d -c %d %s --with-ipv6: yes --with-mysql: /usr/bin/mysql_config --with-openssl: yes --with-gnutls: no --enable-extra-opts: no --with-perl: /usr/bin/perl --enable-perl-modules: no --with-cgiurl: /nagios/cgi-bin --with-trusted-path: /bin:/sbin:/usr/bin:/usr/sbin --enable-libtap: no Make all&&make install 插件安装完毕 再安装nrpe 安装过程略同时是编译安装三步曲:./configure make make install 2、配置mysql mysql> create database nagios; //建立nagios专用数据 Query OK, 1 row affected (0.00 sec) mysql> grant select on nagios.* to nagios@'%' identified by '######'; //建立nagios专用用户权限只给select就OK,给多了不安全。###是密码 Query OK, 0 rows affected (0.00 sec) mysql> flush privileges; //刷新权限让数据库接受新的配置 Query OK, 0 rows affected (0.00 sec) mysql> select User,Password,Host from user;//查询一下 +--------+-----------------------------------------------------------------------+------------------------------------+ | User | Password | Host | +--------+-----------------------------------------------------------------------+------------------------------------+ | root | *FD571203974BA9AFE270FE62151AE967ECA5E0AA | localhost | | root | | localhost.localdomain | | root | | 127.0.0.1 |
nagios监控之CheckEventLog
CheckEventLog CheckEventLog is part of the wiki:CheckEventLog module. This page describes the new syntax, for the old syntax refer to the old page: CheckEventLogOld The new syntax is a bit sketchy in the docs as of yet... I shall try to fix some better examples.. but the best idea would be for someone that uses this to help me with that :) Before you start using CheckEventLog use this command (it is long but a good place to start): CheckEventLog file=application file=system filter=new filter=out MaxWarn=1 MaxCrit=1 filter-generated=>2d filter-severity==success filter-severity==informational truncate=1023 unique descriptions "syntax=%severity%: %source%: %message% (%count%)" This check enumerates all event in the event log and filters out (or in) events and then the resulting list is used to determine state. The CheckEventLog uses filters to define the "interesting" records from the eventlog. Syntax A filter is made up of three things: ? Filter mode Determines what happens when the filter is matched. CheckEventLog1
nagios监控系统手册详细操作
nagios网络监控 Nagios是什么: Nagios是一款开源的免费网络监视工具,能有效监控Windows、Linux和Unix的主机状态,交换机路由器等网络设置,打印机等。在系统或服务状态异常时发出邮件或短信报警第一时间通知网站运维人员,在状态恢复后发出正常的邮件或短信通知。 nagios是功能强大的监控软件,主要用来监控网络设备的状态(比如:主机的资源状态);适合于:对大量的服务器进行监控,判断其负载或服务是否正常,发生异常能通过邮件、短信报警。特别注意:流量监控不是他的强项,流量监控建议使用cacti.可以绘制非常直观的图形 nagios能监视什么: nagios可以监控:1、主机是否宕机(通过ping命令,如果ping不通会认为主机属于宕机状态,但不影响所监控的其他服务);2、服务器资源(cpu使用率、硬盘剩余空间等);3、网络服务(smtp\pop3\http\);4、监控网络设备(路由器、交换机等。) 一、RHEL系统上部署Nagios:(禁用selinux功能) 系统环境:RHEL,在nagios主机上监控mysql服务器 nagios 主机:192.168.10.100 mysql 主机: 192.168.10.101 操作步骤: 1、安装编译所需的软件包:如下图所示: # yum –y install httpd php-* gd-* mysql-devel (若mysql-devel包不安装,会没有check_mysql插件。) 2、创建运行nagios服务的用户 注:useradd nagios #创建运行nagios服务的用户 usermod -G nagios apache #使apache用户对nagios目录具有写权限,不 然web页面操作失败. 3、nagios软件安装 释放nagios源码包,进行编译前的预备置: 编译并安装nagios及相关操作,如下图所示: 注: make install //安装主程序,CGI和HTML文件 make install-init //在/etc/rc.d/init.d安装启动脚本
nagios外部监控脚本编写
使用NAGIOS 平台开发监控应用服务 BY Country7th 2008年的秋天 ●开发NAGIOS监控程序可以做什么用 正如现在已经运行的N A G I O S一样,它可以为相关人员带 到实时的服务运行状态信息,并在出现危急的时候告警通知相关 人员处理,有许多监控程序可用于监控不同的设备和服务,例 如:W E B服务、H T T P访问状态、C P U负荷、磁盘利用 率、内存占用、当前用户数,路由器和交换机运行状态等,还有 更多需求等着大家在工作发觉,通用N A G I O S进行监控 ●NAGIOS监控服务原理 当需要检测主机或服务的状态时N a g i o s会执行一个外部 监控程序,外部监控程序总要做点事情(注意一般条件下)来完成 检查并给返回结果给N a g i o s系统,N a g i o s根据检测 结果来决定网络中的主机和服务的当前状态 外部监控程序根据操作系统的不同分为L I U N X和 W I N D O W S两类,插件是编译的执行文件或脚本(P e r l 脚本、P H P、S H E L L脚本等等),可以在命令行下执行对 主机或服务的状态检查。N a g i o s将处理这些来自插件的结 果并做些该做的动作(运行事件处理、发送出邮件、短信、电话告 警通知等) ●外部监控程序输出到NAGIOS通信方式 ●按指定标准输出返回值给NAGIOS系统的监控端(NSClient) ●输出到数据库由NAGIOS服务器端采集读取数据信息进行通信 ●采用SNMP协议发送据由NAGIOS服务器端直接采集 ●外部监控程序返回值给NAGIOS系统的监控端(NSClient)的输出格式 经讨论机房统一使用第一种通信方式开发以后所有的外部监控应用,以下将详 细介绍从外部监控程序到NAGIOS系统的监控端(NSClient)的输出格式 N a g i o s外部监控程序可以是任何操作系统的可执行的脚本 或都程序,N a g i o s外部监控程序并不关心外部监控程序的
nagios监控说明word资料13页
Nagios监控使用说明 目录 Nagios介绍 (3) 监控界面说明 (3) General (3) Current Status (3) Tactical Overview (4) 右上方_ Monitoring Performance: (4) 左上方_Network Outages (4) 下方部分 (4) Map (4) Hosts (5) Host State Information (5) Host Commands (5) Host Comments (6) Services (6) Host Groups (7) Service Groups (8) Problem (8) Quick Search (8) Reports (8)
Availability (9) 第一步 (9) 第二步 (9) 第三步 (9) 第四步 (9) Trends (10) Graphs (10) Alerts (10) History (10) Summary (10) Histogram (10) Notifications (11) Event Log (11) System (11) Comments (11) Downtime (11) Process Info (12) Performance Information (12) Scheduling Queue (12) Configuration (12)
Nagios介绍 Nagios是一款开源的免费网络监视工具,能有效监控Windows、Linux和Unix的主机状态,交换机路由器等网络设置,打印机等。在系统或服务状态异常时发出邮件或短信报警第一时间通知网站运维人员,在状态恢复后发出正常的邮件或短信通知。 目前,语联网12台服务器均由nagios监控,监控界面:http://119.57.18.102/nagios/ 监控界面说明 上图是nagios的监控界面,左边栏是nagios可以监控的各个项目,点击左边栏的按钮,右边即可显示相应的监控数据。 左边栏显示的功能主要分四个部分:General、Current Status、Reports、System,下面将分别介绍四部分的详细功能。 General 本部分与监控并无关系。General分两个子项:Home和Documentation。其中,Home显示nagios core相关的最新新闻; Documentation链接到与nagios相关的文档手册页面。 Current Status 本部分显示监控的详细信息,下面将分别介绍各子项的详细内容。
使用nagios监控服务
使用nagios监控nfs服务 搭建好nagios服务器后开机自启动httpd 检测nagios是否正常运行的命令 [root@zlf ~]# /usr/local/nagios/bin/nagios -v /usr/local/nagios/etc/nagios.cfg Total Warnings: 0 Total Errors: 0 以下为监控信息的配置文件 [root@zlf ~]# cd /usr/local/nagios/etc/objects/ commands.cfg localhost.cfg switch.cfg timeperiods.cfg contacts.cfg printer.cfg templates.cfg windows.cfg 首先我们查看主配置文件 root@zlf ~]# cd /usr/local/nagios/etc/ [root@zlf etc]# ls cgi.cfg https://www.360docs.net/doc/0610920067.html,ers nagios.cfg objects resource.cfg #cgi.cfg------主要指定配置文件的路径和用户信息 #nagios.cfg---------主配置文件 [root@zlf etc]# vim nagios.cfg 查看配置信息主要看以下定义内容 root@zlf etc]# cd objects/ [root@zlf objects]# ls commands.cfg localhost.cfg switch.cfg timeperiods.cfg contacts.cfg printer.cfg templates.cfg windows.cfg 添加本地服务我们以NFS服务为例
Nagios监控Linux主机(NRPE安装与应用)
Nagios监控Linux主机(NRPE安装与应用) 一、NRPE简介及工作原理 NRPE是nagios的一个扩展,它被用于被监控的服务器上,向nagios监控平台提供该服务器的一些本地的情况。例如,cpu负载、内存使用、硬盘使用等等。NRPE可以称为nagios 的for linux 客户端。 NRPE 由两个部分组成:工作在监控机一侧的check_nrpe 插件、工作在被监控机一侧的NRPE 守护进程。 Nagios 服务器执行check_nrpe 插件并告诉他检查哪个服务,check_nrpe 插件通过SSL 连接方式联系远程服务器上的NRPE 守护进程,NRPE 守护进程执行相应的插件完成指定的检查,并返回结果。 工作原理是:插件nrpe在被监控机上开启一个daemon,通过这个daemon来和监控主机建立一条ssl加密通道,通过这条通道来传送被监控机的本地信息,达到监控的目的。装在被监控机上的daemon就相当于一个nagios的传递员,命令行从nagios监控主机发出,然后daemon接受到信息,就会执行这条命令行,执行的方式,其实是和nagios主机是一样的,所以被监控机上也需要装一套nagios-plugins插件。例如:nagios主机需要监控被监控机的硬盘信息,就会对被监控机发出一条命令说:“我要看你的硬盘信息。”被监控机nrpe的daemon接到这个命令之后,就会运行一个插件,来检查被监控机本地硬盘的信息,然后插件把信息反馈到nrpe,nrpe通过ssl通道再把这些信息反馈到nagios主机。如下图所示 二、NRPE安装 1、所需安装包nrpe、nagios-plugins,这两个包都可以从https://www.360docs.net/doc/0610920067.html,上得到,本例为nrpe-2.12.tar.gz 2、安装openssl、openssl-devel; yum install -y openssl yum install -y openssl-devel 3、安装nrpe和nagios-plugins插件
nagios监控安装文档
监控之神—nagios 我的Nagios的艰辛.....网络监控之神(一) nagios真的很强大,对于监控的windows/linux/switch/printer都能很好的表示,并且可以对其中的服务进行监控。nagios最强大的就是报警功能,email/msn/飞信/网络电话。开源就是好啊!!就好像我配置mail邮件系统一般!! 过程是艰辛的,结果是美好的! 第一。先看基本的nagios安装! 下载nagios-3.0.3.tar.gz -----------------------主程序 nagios-plugins-1.4.12.tar.gz------------------插件 nagios-nrpe_2.8.1.orig.tar.gz -------------监控Linux需要 nsclient++0.3.3 ------------------监控windows需要 官方文档 https://www.360docs.net/doc/0610920067.html, 英文的! 开始安装 1。 yum install gcc yum install glibc glibc-commonyum install gd gd-devel 2。自己编译安装apache2.0。安装哪里随便,(我这里是自己编译的httpd,么有用系统自带的) 3。安装nagios-3.0.3.tar.gz ======================= /usr/sbin/useradd nagios passwd nagios 输入密码 /usr/sbin/groupadd nagcmd /usr/sbin/usermod -G nagcmd nagios /usr/sbin/usermod -G nagcmd apache ===================== tar xzf nagios-3.0.3.tar.gz ======================= cd nagios-3.0.3 ======================= ./configure --with-command-group=nagcmd (不用跟参数,默认安装在/usr/local/nagios) ================ make all
nagios+pnp4nagios实现监控huawei交换机流量的详细配置过程
nagios snmp 流量监控之 check_traffic.sh
公司机房新增了一台 H3C S5024P 交换机做为内网之间机器互通用 。其本身支持通过 web 查看, 不过由于对该机没有配置公网 IP , 同时每次都登录查看感觉很不方便。 所认就想到利用 nagios 和 snmp 来进行监控。可以进行 snmp 监控的 nagios 插件很多,不过也可以自己根据 snmp 协议来写 。既然有 现成的,就懒得写了,直接拿来“石头”的 shell 版的来监控交换机流量并配置告警。 这篇文章省略了 nagios 的安装过程,安装交换机流量监控图需要许多插件,主要的软件包括 LAMP+Nagios+Nagios-plugin+snmp+Pnp4nagios+rrdtool,下面的操作是在安装完 nagios,并在 浏览器可以顺利打开后的操作。
一、安装
1、安装 snmp 包并配置 snmpd.conf 文件
yum -y install net-snmp*
直接一条命令就可以完成所需的 snmp 包的安装。接着修改/etc/snmpd.conf 文件为如下内容:
# https://www.360docs.net/doc/0610920067.html, source community com2sec notConfigUser 127.0.0.1(localhostcheck_traffice.sh 也可不改) XXXX (共同体名) # group context sec.model sec.level prefix read write notif access notConfigGroup "" any noauth exact mib2 none none #改 system 为 mib2 view mib2 included https://www.360docs.net/doc/0610920067.html,.dod.internet.mgmt.mib-2 fc #去掉前面的"#"注释符
2、上传插件 上传 check_traffic.sh 至/App/nagios/libexec 目录修改属主并赋予可执行权限。
chown nagios.nagios check_traffic.sh chmod +x check_traffic.sh
3、获取网卡 index 值
[root@web3 ~]# /usr/local/nagios/libexec/check_traffic.sh -V 2c -C public -H 192.168.254.200 -L List Interface for host 192.168.8.254. Interface index 262 orresponding to InLoopBack0 Interface index 390 orresponding to Aux0/0 Interface index 518 orresponding to GigabitEthernet0/1 Interface index 646 orresponding to GigabitEthernet0/2 Interface index 774 orresponding to GigabitEthernet0/3 Interface index 902 orresponding to GigabitEthernet0/4
Linux系统监控之 Nagios配置教程详解(赵舜东)
Linux系统监控之 Nagios配置教程详解(赵舜东) 实验目的:通过实验熟练掌握Nagios这个开源的监控解决方案的实施。 实验环境:Red Hat Enterprise Linux +nagios.3.2.0 实验步骤: 第一部分:Linux系统监控之 Nagios详解(一) 一、Nagios 简介 (一)什么是Nagios,Nagios有哪些特性。 (二)Nagios工作原理 二、部署Nagios监控服务器 (一)下载所需软件包 (二)安装Nagios (三)安装Nagios的插件nagios-plugin (四)配置检测主机是否存活 (五)第一部分功能测试 第二部分:Linux系统监控之 Nagios详解(二) 三、使用Nagios监控Linux 客户端 (一)Nagios监控服务器的配置 (二)Nagios监控客户端的配置 四、使用Nagios 监控Windows 客户端 (一)Nagios 监控服务器的配置 (二)Nagios 监控客户端的配置 第三部分:Linux系统监控之 Nagios详解(三) 五、Nagios 配置文件详解 实验简介:公司进行了机房改造,新系统也上线了,需要一个强大的监控方案,对服务器和各服务的运行情况进行有效的监控,我第一个想到的就是Nagios这个强大的开源解决方案,本文以监控八台服务器和Nagios服务器本身为例。根据先实现、后深入的方式,把本文分为三个部分,开始先实现了功能, 在第三个部分,在对配置的内容进行详细的讲解, 功能实现:实现Web浏览器监控,Mail报警邮件收发,手机短信收发。手机短信怎么收发呢?网上有很多很多的方法,我推荐一种就是使用139信箱,139信箱有一项免费的功能就是发邮件通知到您的手机上,可以在手机上看邮件内容,免费的哦。什么?还没有139信箱,那么别傻呆了,系统运维必备的信箱,快免费申请吧。 本作品为本站原创作品,如需转载请注明来自UnixHot 技术联盟实验答疑:zhaoshundong@https://www.360docs.net/doc/0610920067.html,
Nagios监控系统(二)监控Linux机器
10.Nagios如何监控Linux机器 NRPE总共由两部分组成: (1).check_nrpe插件,运行在监控主机上。 (2).NRPE daemon,运行在远程的linux主机上(通常就是被监控机) 按照上图,整个的监控过程如下: 当Nagios需要监控某个远程linux主机的服务或者资源情况时: 1).nagios会运行check_nrpe插件,我们要在nagios配置文件中告诉它要检查什么. 2).check_nrpe插件会通过SSL连接到远程的NRPE daemon. 3).NRPE daemon会运行相应的nagios插件来执行检查本地资源或服务. 4).NRPE daemon将检查的结果返回给check_nrpe插件,插件将其递交给nagios做处理. 注意:NRPE daemon需要nagios插件安装在远程被监控linux主机上,否则,daemon不能做任何的监控. 11.Nagios的配置文件 #控制cgi访问的配置文件 cgi.cfg #Nagios主配置文件 nagios.cfg #resource.cfg定义了一些变量,以便被其他文件引用,如$USER1$ resource.cfg # objects是一个目录,用于定义Nagios对象 objects # servers是自己创建的一个目录,Nagios可以加载一个目录下面的所有配置文件(需要在nagios.cfg中配置) servers ./objects: #命令定义配置文件,里面定义的命令可以被其他文件引用 commands.cfg #联系人和联系人组配置文件 contacts.cfg #监控本地机器的配置文件 localhost.cfg #监控打印机的一个事例配置文件(默认未启用) printer.cfg #监控路由器的一个事例配置文件(默认未启用) switch.cfg #模板配置文件,在此可以定义模板,在其他文件中引用 templates.cfg #定义监控时间段的配置文件 timeperiods.cfg #监控Windows的一个事例配置文件(默认未启用)
nagios报警触发机制
Nagios报警触发机制 简介 之前我曾经学过zabbix,以为他们的机制差不多,但是实际操作测试以来,才发现差别很大,而且网上很多教程都很坑人,比如说nagios里面涉及到抖动、以及模板的调用,跟zabbix 区别很大,接下来我就在下文里进行一个详细的介绍。 Cfg文件的调用 Nagios一般监控的话分为服务监控和主机监控,然后对应的配置也文件也需要定义每一个主机和每一个服务的一些相关的功能,我们可以在模板文件里有所看到 模板里面就定义了几种,然后呢,网上经常就是直接调用他们,比如说nagios自带的localhost 的模板里面,语法如下
它就引用了模板里面的local-service服务 然后从local-service里面又引用了generic-service 也就是说,这个服务的配置参数引用了所有以上的参数,然后嵌套调用,这样可以省很多东西,不过作为初学者的我来说,刚开始还以为就只有那么几个东西,结果报警触发的时候死活不发邮件,或者隔了好一会儿才发送,所以一定要明白这一点,甚至可以说自己创造一个服务的定义,然后自己引用自己的,我就是这样做的,至于以上参数,有几个重要的在后期的报警上面我会多写一点。 Nagios的报警触发机制 Nagios的报警触发默认状态下所定义的服务并不是一监测到问题就报警,而是当发现问题之后,继续监测问题,如果问题仍然持续,才进行报警。 监测单位时间 字面意思,上面是服务的时间,下面是主机的时间,这个的话定义一个单位时间为60秒,
默认也是60秒,你可以根据自己的需要进行修改,比如说你可以改成30秒,那么两个时间单位就是一分钟,这一点一定要明确。 监测的“软态”和“硬态” 首先要清楚几个字段的意思啊 retry_check_interval 重试时间 max_check_attempts 这个是出现故障的连接次数,达到这个次数之后就报警 然后来介绍一下软态硬态是什么意思,以下就直接摘网上的了,反正我已经通过测试了 一、软态:被监控项处于retry_check检测周期内的非正常状态; 二、硬态:被监控项达到max_check_attempts最大次数后的非正常状态;除此之外的 状态,我们估且称之为“常态”。 我们试着看看设置如下参数时,Nagios是怎么做状态检测及告警的: max_check_attempts 3 normal_check_interval 3 retry_check_interval 2 notification_interval 3 首先,Nagios每三分钟检测一次服务,当某次检测到服务状态为异常时,直接进入软态(1/3 soft state),此后,以每2分钟(retry_check_interval)的检测频率,再进行2次(一共进行3次检测,从而达到max_check_attempts)检测,如果这两次检测服务都为异常,则直接进入硬态(hard state)。进入硬态后,Nagios以每3分钟(normal_check_interva)一次的频率检测服务,这与常态时是一样的;同时每3分钟(notification_interval)进行一次告警。 这里的话就是有一个从软态到硬态的过程,可以避免由于小段时间的不稳定波动也进行没有必要的报警,那么笔者是如何设置的呢? 笔者曾经引用过这个范例,结果就是检测服务挂掉之后半天才报警,所以后期改良之后就是这样: 如何解释呢?就是说当检测到问题之后立刻报警,不重试,然后报警只报警一次,如果韵不过来什么意思可以回过头再去看看之前所说的东西,简单地说我就是取消掉了软态这个功能,
怎么设置nagios监控交换机的端口
怎么设置nagios监控交换机的端口 1.cd /usr/local/nagios/etc/objects,增加需要的交换机,示例配置SW.cfg: define host{ use generic-switch host_name xxx alias xxxx address 192.168.x.x check_command check-host-alive initial_state o max_check_attempts 2 check_interval 1 retry_interval 1 check_period 24x7 freshness_threshold 1 event_handler notify-host-by-email flap_detection_options o,d,u contacts xxx notification_interval 0 notification_period 24x7 first_notification_delay 1 notification_options d,u,r,f,s notifications_enabled 1 stalking_options o,d,u register 1 } define service{ use generic-service host_name xxx service_description xxxxx check_command check_snmp_interface!public!ifOperStatus.10113 normal_check_interval 1 retry_check_interval 1 } 2.配置完上面的后,在/usr/local/nagios/etc下编辑nagios.cfg文件,相应的位置增加上面的配置: cfg_file=/usr/local/nagios/etc/objects/SW.cfg 3.如果在/usr/local/nagios/etc/objects/commands.cfg里面没有check_snmp_interface这个命令,可以编辑该文件,增加: vi commands.cfg
Nagios监控Windows主机(NSClient++安装与应用)
Nagios监控Windows服务器(NSClient++安装与应用) 一、NSClient++安装 1、下载NSClient++插件 点击下面链接下载https://www.360docs.net/doc/0610920067.html,/x-0.3.x/NSClient%2B%2B-0.3.9-Win32.ms i 2、安装插件与配置 1)安装过程十分简单,直接点击下一步,下一步即可。安装过程注意如下图的设置即可 2)配置NSClient 编辑NSClient安装目录下的NSC.ini文件,修改后,重启NSClient即可,如下图所示
3)模块作用说明,如下表 Module Description Commands CheckSystem.d ll Handles many system checks CPU, MEMORY, COUNTER etc CheckDisk.dll Handles Disk related checks USEDDISKSPACE FileLogger.dll Logs errors to a file so you can see what is going on N/A NSClientListen er.dll Listens and responds to incoming requests from nagios N/A 二、NSClient应用监控 NSClient++与Nagios服务器通信,主要使用Nagios服务器的check_nt插件。原理图如下
1、check_nt插件的使用说明 [root@localhost libexec]# ./check_nt -h check_nt v1.4.15 (nagios-plugins 1.4.15) Copyright (c) 2000 Yves Rubin (rubiyz@https://www.360docs.net/doc/0610920067.html,) Copyright (c) 2000-2007 Nagios Plugin Development T eam
nagios图形监控显示和报警管理
1、yum安装pnp软件需要基础包 图形依赖库 yum install cairo pango zlib zlib-devel freetype freetype-deve l gd gd-devel -y 2、rrdtools依赖安装软件都在oldboy_training_nagios_soft.zip cd ~/tools tar xf libart_lgpl-2.3.17.tar.gz cd libart_lgpl-2.3.17 ./configure make make install /bin/cp -r /usr/local/include/libart-2.0 /usr/include cd ../ 3、安装rrdtool软件轮循数据库,专门画图 tar xf rrdtool-1.2.14.tar.gz cd rrdtool-1.2.14 ./configure --prefix=/usr/local/rrdtool --disable-python --dis able-tcl #WARNING: The RRDs Perl Modules are not found on your Syste m #Using RRDs will speedup things in larger Installtions. #configure后出现上面的提示可以不用理会。 make make install cd ../ ls -l /usr/local/rrdtool/bin 4、安装pnp pnp收集数据给rrdtool画图rrdtool画完再给pnp展示 tar zxf pnp-0.4.14.tar.gz cd pnp-0.4.14 ./configure \ --with-rrdtool=/usr/local/rrdtool/bin/rrdtool \ #<= =真正的出图的命令 --with-perfdata-dir=/usr/local/nagios/share/perfdata/ #<==出图所用的数据路径
基于nagios网络监控管理系统的设计与实现
毕业设计论文 基于nagios网络监控管理系统的设计与实现 摘要 大型企业和学校的IT信息系统,其规模往往非常庞大,服务器总数量可以达到1000-3000台之多,在日常的运行维护工作中,对这些服务器的运行情况进行监控和管理就是非常具有挑战性的工作。而高可用系统采用负载均衡等方式将故障节点对用户进行自动屏蔽,这种设计就要求监控系统必须及时发现故障点并通知处理。而Nagios是一个基于Linux平台的通用计算机服务监控系统。其具有松散藕合、跨平台、接口标准、高扩展性、可基于HTTP协议灵活访问等特点。 本课题立足于洛阳理工学院西区校园网,以开源网络监控软件nagios为基础,搭建校园网络监控系统。通过对开源网络监控软件nagios的二次开发,实现可以满足自身校园网需求的网络监控系统。详细分析了nagios的架构原理、工作流程、强大报警和插件扩展方式的同时,也丰富了nagios的绘图效果,在原有的邮件报警基础之上,增加了飞信报警、声音报警功能,并且对主机和服务状态进行更直观的监控。 关键词:通用,网络监控,监控利器nagios,报警
DESIGN AND IMPLEMENTATION BASED ON NAGIOS NETWORK MONITORING MANAGEMENT SYSTERM ABSTRACT Large enterprises and campus often has a large-scale IT information system, it maybe have 1000 to 3000 servers. It's a very challenging work to monitor and manage these servers in daily operation and maintenance. High Availability system use load balance to shield the failed node automatically, this design require monitoring system must detect failures automatically. Nagios is a Linux-based general-purpose computer service monitoring system. It has loosely coupled, cross-platform, standard interface, highly scalable, flexible access via HITTP protocol Features. Based on west of luoyang institute of technology campus network, based on the open source network monitoring software nagios, build campus network monitoring system. Through the open source network monitoring software nagios of secondary development, can meet the demand of campus network of their own network monitoring system. In detailed analysis of the principle of the architecture of nagios, work process and at the same time, the way of a powerful plug-in extension also enriched the nagios alarm way, based on the original email alarm, increased the fetion alarm, voice alarm function,and the entire network traffic state more intuitive monitoring. KEY WORDS: General,network monitoring,monitor Nagios,alarming