3D Widgets for Exploratory Scientific Visualization
3D Widgets for Exploratory Scienti?c Visualization
Kenneth P.Herndon and Tom Meyer
Brown University
Department of Computer Science
Providence,RI02912
(401)863-7693;kph,twm@https://www.360docs.net/doc/0e18829106.html,
ABSTRACT
Scientists use a variety of visualization techniques to help
understand computational?uid dynamics(CFD)datasets,
but the interfaces to these techniques are generally two-
dimensional and therefore separated from the3D view.Both
rapid interactive exploration of datasets and precise control
over the parameters and placement of visualization techniques
are required to understand complex phenomena contained in
these datasets.In this paper,we present work in progress
on a3D user interface for exploratory visualization of these
datasets.
KEYWORDS:3D user interface,scienti?c visualization.
INTRODUCTION
Computational?uid dynamics techniques are used to simu-late?ows of?uids like air and water around modeled objects. Although these simulation methods are cheaper and less time-consuming than actual physical tests in wind tunnels,the large amount of numerical data they generate is dif?cult to visual-ize.We have developed a set of3D interface techniques(or widgets[2])that are used to control visualization techniques for exploration of CFD datasets.These widgets are fully in-tegrated into the3D scene,rather than being an“external”2D interface.
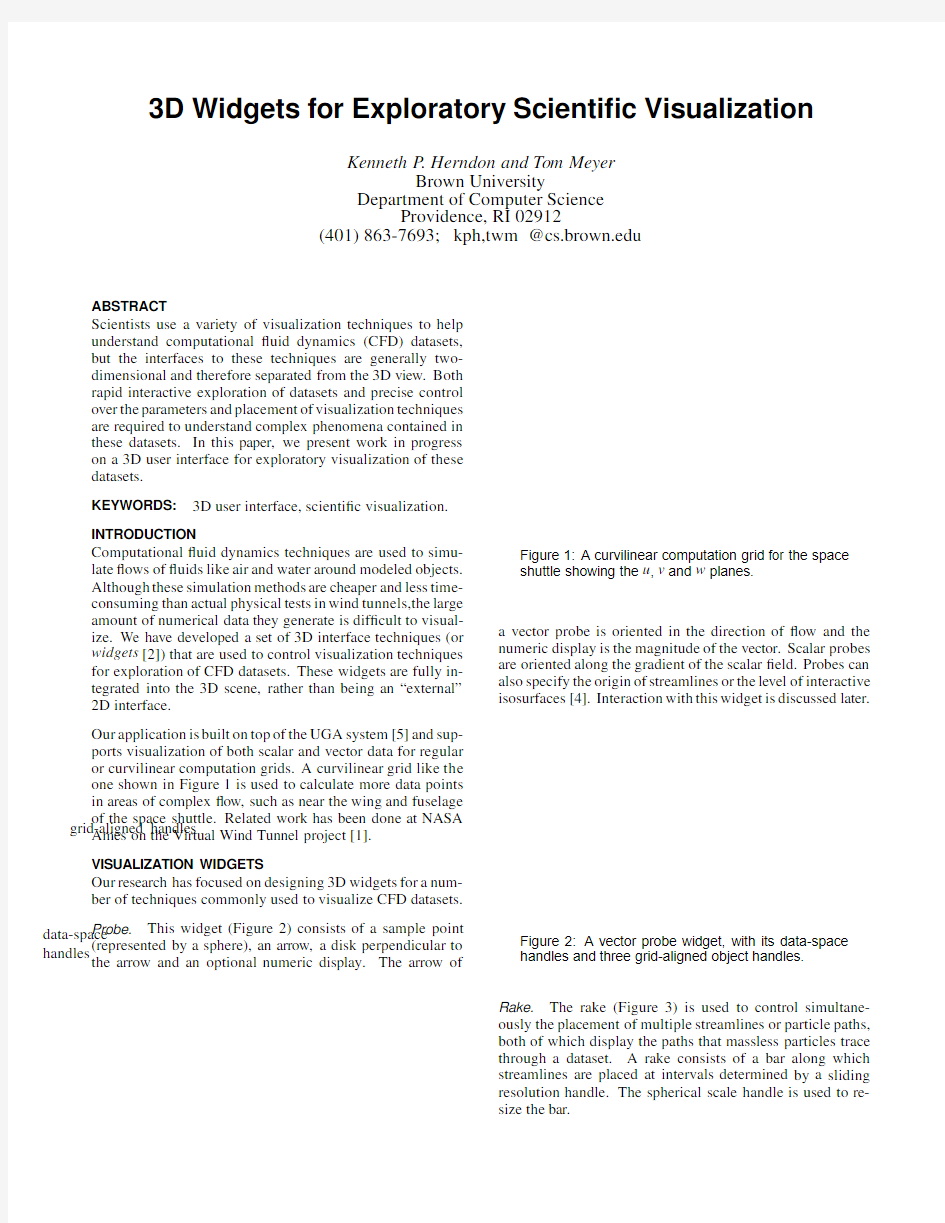
Our application is built on top of the UGA system[5]and sup-ports visualization of both scalar and vector data for regular or curvilinear computation grids.A curvilinear grid like the one shown in Figure1is used to calculate more data points in areas of complex?ow,such as near the wing and fuselage of the space shuttle.Related work has been done at NASA Ames on the Virtual Wind Tunnel project[1]. VISUALIZATION WIDGETS
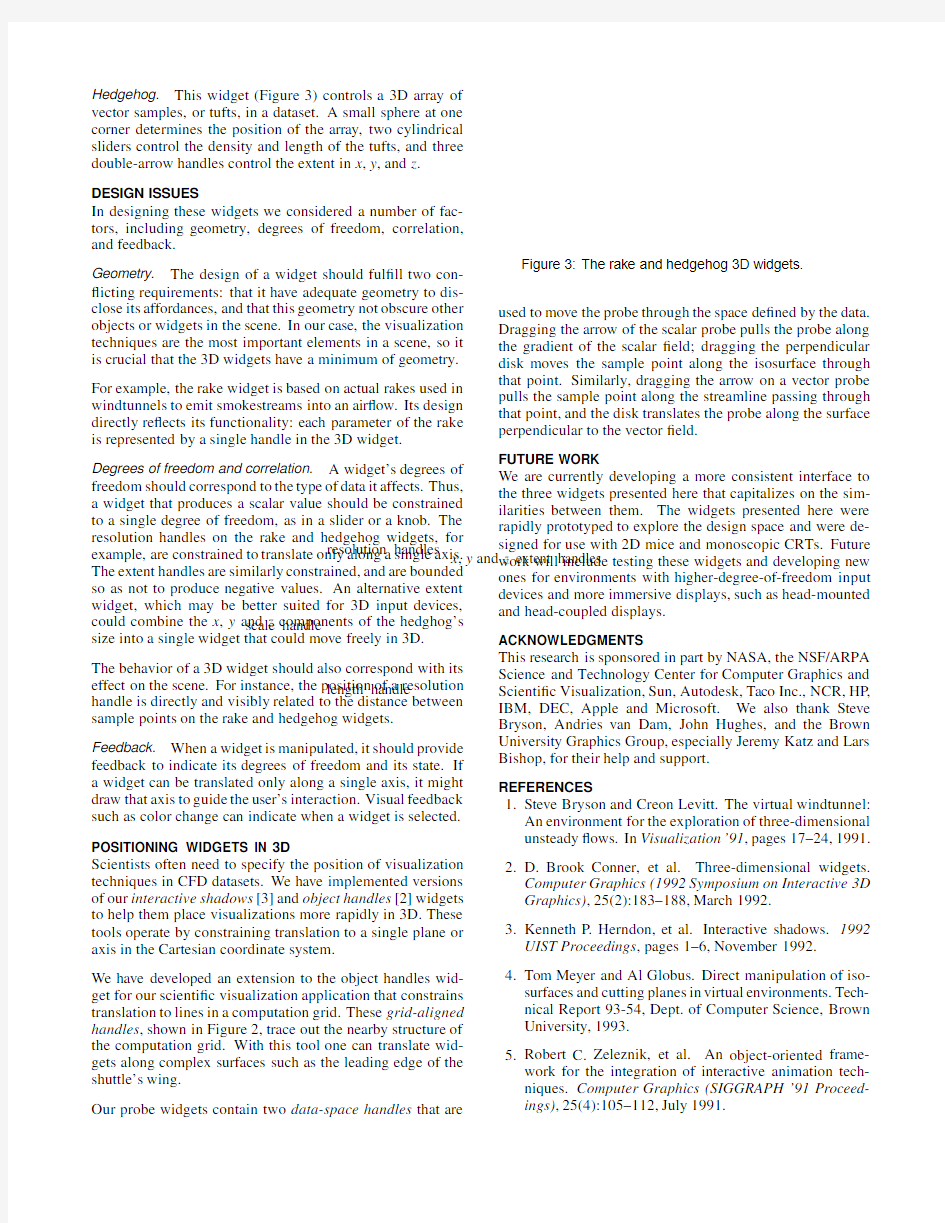
Our research has focused on designing3D widgets for a num-ber of techniques commonly used to visualize CFD datasets. Probe.This widget(Figure2)consists of a sample point
(represented by a sphere),an arrow,a disk perpendicular to the arrow and an optional numeric display.The arrow of
Figure1:A curvilinear computation grid for the space
shuttle showing the u,v and w planes.
a vector probe is oriented in the direction of?ow and the numeric display is the magnitude of the vector.Scalar probes are oriented along the gradient of the scalar?eld.Probes can also specify the origin of streamlines or the level of interactive isosurfaces[4].Interaction with this widget is discussed later.
grid-aligned handles
data-space handles
Figure2:A vector probe widget,with its data-space
handles and three grid-aligned object handles.
Rake.The rake(Figure3)is used to control simultane-ously the placement of multiple streamlines or particle paths, both of which display the paths that massless particles trace through a dataset.A rake consists of a bar along which streamlines are placed at intervals determined by a sliding resolution handle.The spherical scale handle is used to re-size the bar.
Hedgehog.This widget (Figure 3)controls a 3D array of
vector samples,or tufts,in a dataset.A small sphere at one corner determines the position of the array,two cylindrical sliders control the density and length of the tufts,and three double-arrow handles control the extent in x ,y ,and z .
DESIGN ISSUES
In designing these widgets we considered a number of fac-tors,including geometry,degrees of freedom,correlation,and feedback.
Geometry.
The design of a widget should ful?ll two con-?icting requirements:that it have adequate geometry to dis-close its affordances,and that this geometry not obscure other objects or widgets in the scene.In our case,the visualization techniques are the most important elements in a scene,so it is crucial that the 3D widgets have a minimum of geometry.
For example,the rake widget is based on actual rakes used in windtunnels to emit smokestreams into an air?ow.Its design directly re?ects its functionality:each parameter of the rake is represented by a single handle in the 3D widget.
Degrees of freedom and correlation.
A widget’s degrees of freedom should correspond to the type of data it affects.Thus,a widget that produces a scalar value should be constrained to a single degree of freedom,as in a slider or a knob.The resolution handles on the rake and hedgehog widgets,for example,are constrained to translate only along a single axis.The extent handles are similarly constrained,and are bounded so as not to produce negative values.An alternative extent widget,which may be better suited for 3D input devices,could combine the x ,y and z components of the hedghog’s size into a single widget that could move freely in 3D.The behavior of a 3D widget should also correspond with its effect on the scene.For instance,the position of a resolution handle is directly and visibly related to the distance between sample points on the rake and hedgehog widgets.Feedback.When a widget is manipulated,it should provide
feedback to indicate its degrees of freedom and its state.If a widget can be translated only along a single axis,it might
draw that axis to guide the user’s interaction.Visual feedback such as color change can indicate when a widget is selected.
POSITIONING WIDGETS IN 3D
Scientists often need to specify the position of visualization techniques in CFD datasets.We have implemented versions of our interactive shadows [3]and object handles [2]widgets to help them place visualizations more rapidly in 3D.These tools operate by constraining translation to a single plane or axis in the Cartesian coordinate system.
We have developed an extension to the object handles wid-get for our scienti?c visualization application that constrains translation to lines in a computation grid.These grid-aligned handles ,shown in Figure 2,trace out the nearby structure of the computation grid.With this tool one can translate wid-gets along complex surfaces such as the leading edge of the shuttle’s wing.
Our probe widgets contain two data-space handles that are
x ,y and z extent handles resolution handles scale handle
length handle Figure 3:The rake and hedgehog 3D widgets.
used to move the probe through the space de?ned by the data.Dragging the arrow of the scalar probe pulls the probe along the gradient of the scalar ?eld;dragging the perpendicular disk moves the sample point along the isosurface through that point.Similarly,dragging the arrow on a vector probe pulls the sample point along the streamline passing through that point,and the disk translates the probe along the surface perpendicular to the vector ?eld.
FUTURE WORK
We are currently developing a more consistent interface to
the three widgets presented here that capitalizes on the sim-ilarities between them.The widgets presented here were rapidly prototyped to explore the design space and were de-signed for use with 2D mice and monoscopic CRTs.Future work will include testing these widgets and developing new ones for environments with higher-degree-of-freedom input devices and more immersive displays,such as head-mounted and head-coupled displays.ACKNOWLEDGMENTS
This research is sponsored in part by NASA,the NSF/ARPA
Science and Technology Center for Computer Graphics and Scienti?c Visualization,Sun,Autodesk,Taco Inc.,NCR,HP ,IBM,DEC,Apple and Microsoft.We also thank Steve Bryson,Andries van Dam,John Hughes,and the Brown
University Graphics Group,especially Jeremy Katz and Lars Bishop,for their help and support.REFERENCES
1.Steve Bryson and Creon Levitt.The virtual windtunnel:An environment for the exploration of three-dimensional unsteady ?ows.In Visualization ’91,pages 17–24,1991.
2.D.Brook Conner,et al.Three-dimensional https://www.360docs.net/doc/0e18829106.html,puter Graphics (1992Symposium on Interactive 3D Graphics),25(2):183–188,March 1992.
3.Kenneth P.Herndon,et al.Interactive shadows.1992UIST Proceedings ,pages 1–6,November 1992.
4.Tom Meyer and Al Globus.Direct manipulation of iso-surfaces and cutting planes in virtual environments.Tech-nical Report 93-54,Dept.of Computer Science,Brown University,1993.
5.Robert C.Zeleznik,et al.An object-oriented frame-work for the integration of interactive animation https://www.360docs.net/doc/0e18829106.html,puter Graphics (SIGGRAPH ’91Proceed-ings),25(4):105–112,July 1991.