Zeolite–TiO2 hybrid composites for pollutant degradation in gas phase
Applied Catalysis B:Environmental 178(2015)100–107
Contents lists available at ScienceDirect
Applied Catalysis B:
Environmental
j o u r n a l h o m e p a g e :w w w.e l s e v i e r.c o m /l o c a t e /a p c a t
b
Zeolite–TiO 2hybrid composites for pollutant degradation in gas phase
I.Jansson a ,S.Suárez a ,?,F.Javier Garcia-Garcia b ,B.Sánchez a
a CIEMAT-Renewable Energy Division,FOTOAIR-CIEMAT,Group of Photocatalytic Treatment of Pollutant in Air,https://www.360docs.net/doc/1d18539217.html,plutense,40,28040Madrid,Spain b
ICTS-CNME,Universidad Complutense de Madrid,28040Madrid,Spain
a r t i c l e i n f o Article history:
Received 22July 2014
Received in revised form 7October 2014Accepted 8October 2014
Available online 24October 2014Keywords:
Photocatalysis Zeolites TiO 2VOC
a b s t r a c t
This work presents a thorough assessment of the photocatalytic properties of a series of zeolite/TiO 2com-posites for the degradation of pollutants in gas phase.The composites have been prepared by the incipient wet impregnation method using an acidic TiO 2sol precursor and ?ve different zeolites.The in?uence of the content of TiO 2,the zeolite structure (Zeolite Y and ZSM-5)and the Si/Al ratio in the textural prop-erties,adsorption capacity and the photodegradation activity of the zeolite/TiO 2composites has been studied.Formaldehyde (HCHO)and a chlorinated hydrocarbon,trichloroethylene (C 2HCl 3),have been used as model volatile organic compounds (VOCs).The composites obtained have been characterised by N 2adsorption–desorption,XRD,TGA-DTA,SEM and TEM microscopy.Electrophoretic migration mea-surements and adsorption ability in dynamic conditions for both model molecules was determined.The incipient wet impregnation method using a TiO 2acidic sol is a suitable procedure to preparing well-dispersed TiO 2nanoparticles around 5nm onto microporous zeolites.The results shown in this work reveal that the nature of the pollutant and the physicochemical characteristic of the zeolites have a strong in?uence on the adsorption ability and in the photocatalytic performance of the composites,reducing the formation of non-desirable reaction by-products.An adequate balance between the surface area and adsorption ability is required in order to optimise the photocatalytic ef?ciency.
?2014Elsevier B.V.All rights reserved.
1.Introduction
Adsorption-photocatalyst hybrids (AHP’s)are bifunctional materials based on an adsorbent and a photocatalyst with great potential for decontamination processes.When TiO 2and an adsor-bent coexist within the same material,the individual properties of these two kinds of compounds are combined.As a result a syner-getic effect arises leading to an increase of the reaction rate [1].The transfer of species from the adsorbent sites to the semicon-ductor or vice versa by the interface created between both phases is enhanced.The adequate choice of the support improves the dis-persion of the photoactive phase,increasing the surface area and pore volume of the ?nal material.Moreover,it may also induce modi?cations in the UV absorption spectrum of the semiconduc-tor,in the acid–base characteristics,inhibiting the crystal growth.Generally adsorbents present a hydroxyl rich surface,which favour the photocatalytic process [2].
Previous studies in our group have demonstrated that sepiolite/TiO 2(Sep/TiO 2)composites,based on a magnesium
?Corresponding author.Tel.:+34913466177;fax:+34913466037.E-mail address:silvia.suarez@ciemat.es (S.Suárez).silicate and titania,exhibit better photocatalytic performance,including photoactivity,photocatalyst durability and mineralisa-tion than benchmark TiO 2[3–5].With these results in mind,it is reasonable to assume that the use of adsorbents with higher sur-face areas could improve the behaviour of Sep/TiO 2composites for the abatement of gas phase VOCs.In this sense,zeolites are an interesting kind of crystalline aluminosilicate minerals with high surface area and high adsorption ability so they are commonly used as adsorbents [6].Additionally,the well-de?ned microporous sys-tem of the zeolites endows them with excellent shape selective properties [7].
In their seminal works,Yoneyama et al.[8,9]studied the role of porous solids with different adsorption capacities such as zeolites,activated carbon,silica and alumina for the photo-catalytic degradation of propionaldehyde.They concluded that zeolite structures exhibit relevant physicochemical properties over other adsorbents such as activated carbon.Zeolites Y and ZSM-5are some of the most commonly ordered structures used for photocatalytic studies,including the removal of nitrogen oxides [10,11],isomerisation or cyclization reactions [12,13],disinfection [14],CO 2photoreduction [15]or the photocatalytic degradation of organic molecules [16].Anpo et al.[17]studied hydrophilic and hydrophobic zeolite Y for the elimination of toluene and benzene
https://www.360docs.net/doc/1d18539217.html,/10.1016/j.apcatb.2014.10.022
0926-3373/?2014Elsevier B.V.All rights reserved.
I.Jansson et al./Applied Catalysis B:Environmental178(2015)100–107101
in gas phase.Xu and Langford[16,18]studied the behaviour of ZSM-5and zeolite Y for the photodegradation of4-chlorophenol and acetophenone in water phase.To our knowledge,the opti-misation of the zeolite/TiO2composition and its in?uence on the physicochemical/adsorption properties and on the photocatalytic performance for the abatement of a typical indoor air pollutant such as formaldehyde(HCHO)and of an organochloride compound such as trichloroethylene(C2HCl3)in gas phase have not been reported hitherto.
Bearing in mind these observations,the objective of this work is to study the performance of different zeolite/TiO2composites for the photocatalytic treatment of formaldehyde and trichloroethy-lene in air.The optimisation of the TiO2loading,the effect of the zeolite structure and the Si/Al ratio were related to the textural properties and adsorption ability of the composites.
2.Experimental
2.1.Photocatalysts preparation
Two commercially available zeolites,zeolite Y(a FAU type zeo-lite with SiO2/Al2O3=5–80,producer’s codes:CBV600and CBV 780)and ZSM-5(a MFI type zeolite with SiO2/Al2O3=23–280,pro-ducer’s codes:CBV2314,CBV8014and CBV28014)were purchased from Zeolyst.The TiO2sol used for the synthesis of the hybrid mate-rials was synthetized as described elsewhere[19].Brie?y,the TiO2 sol was synthesised by adding titanium isopropoxide to an aqueous solution of HNO3to a volume ratio of900:6.5:74(H2O:HNO3:TIP) [20].Then,the suspensions were stirred for about24h until com-plete peptisation.The acidic sols were dialysed to a?nal pH of 3.0.The addition of a TiO2-sol volume to the adsorbent was per-formed by incipient wet impregnation procedure using the pore volume values calculated by N2adsorption–desorption measure-ments for each zeolite.Thus,the desired volume of the TiO2sol was slowly added and mixed with the raw material.In order to eliminate the solvent and inorganic precursors used for the prepa-ration of the composites,the solid obtained were thermally treated at500?C in air during3h.This thermal protocol was set after the TGA-DSC analyses.The TiO2amount in the?nal samples ranged between2and16wt.%.The samples with the higher amounts of TiO2were prepared by successive incipient impregnation pro-cesses,and the composites obtained after each impregnation step were thermally treated under air at100?C for60min previous to the next impregnation.Additionally,the TiO2-sol was evaporated and dried at r.t.obtaining a TiO2xerogel that was calcined at 350?C during3h.The solid recovered is referred to as TiO2–Xg. Table1shows the nomenclature and selected physicochemical properties of the samples under study.Samples Z1and Z2identify different commercial zeolites Y with different Si/Al ratios.Z3,Z4 and Z5identify ZSM-5type zeolites with different Si/Al ratios.The hybrid zeolite/TiO2composites are identi?ed by the pre?x I-(from impregnation)followed by a number indicative of the amount TiO2 in the composite.A commercial TiO2(Millenium)and a Sep/TiO2 50:50wt.%composite calcined at500?C have been used for comparison[3].
2.2.Physicochemical characterisation
The raw materials and the composited obtained have been char-acterised by N2adsorption–desorption isotherms,XRD,TGA-DTA, SEM-EDX,TEM and electrophoretic migration.The speci?c surface area,the average pore radius and pore volume of selected materi-als have been determined by N2adsorption–desorption at?196?C in a Micromeritics Asap2420Analyser outgassing the samples overnight between120and250?C to a pressure of<1.33×10?2Pa to ensure a clean dry surface,free from any loosely bound adsorbed species.Crystal structure identi?cation studies were conducted with a PANalytical X’Pert PRO ultrafast detector X-ray difractome-ter(XRD)with CuK?radiation operating at45kV and40mA. Bragg’s angles(?)between20?and80?were recorded at a rate of0.02?per step and a count time of50s per step.Diffraction lines were assigned to the corresponding crystalline phases by comparison with Powder Diffraction Files(PDF)from the Interna-tional Centre for Diffraction Data(ICDD)Joint Committee on Power Diffraction Standards(JCPDS)).
Thermogravimetric analysis were carried out with a Mettler Toledo TGA/SDTA851e thermobalance under a controlled atmo-sphere within a temperature programme between25and1000?C, with a heating rate of10?C min?1and air?ow75mL min?1.
The scanning electron microscopy characterisation was carried out in a JEOL JSM-7600F.The electron microscope is equipped with an INCA detector for energy dispersive X-ray spectroscopy,EDX. Specimens were prepared by depositing a small amount of the powder onto a clean surface graphite sample holder.Transmission electron microscopy studies were carried out in a JEOL JEM-3000F operated at300kV.Powder samples were ultrasonically dispersed in butanol and one drop of the resulting suspension was deposited onto a copper grid coated with a thin holey amorphous carbon layer.Images were recorded with a slow scan CCD camera.The chemical composition of the samples was determined by X-ray?u-orescence using a PANalitycal axios(XFR)spectrometer,equipped with a Rh anode and4kW power.Zeta potential measurements were performed with a Zetasizer Nano ZS90with a MPT-2autoti-trator.Experiments were carried out using30mg of1?m powder samples suspended in200mL of10?3M KCl solution,adjusting the pH value with0.2M and0.02M KOH and HCl solutions.Each curve was recorded at least three times to ensure reproducibility.
2.3.Photocatalytic activity tests
The photocatalytic performance was evaluated in a contin-uous?at stainless steel reactor with120mm×50mm×10mm (length×wide×depth)external dimensions covered by a37cm2 borosilicate glass window[3].A borosilicate glass surface of19cm2 was covered by only30mg of composite in order to minimise the adsorption step.The samples were irradiated by two UV lights (8W Philips)resulting in an irradiance of6.5mW cm?2.Gas cylin-ders(Air Liquide)with controlled compositions HCHO/N2(40ppm) or C2HCl3(250ppm)were used for pollutant feeding.15ppm of formaldehyde(FMD)and25ppm of trichloroethylene with total gas?ow ranging between100and900mL min?1(t r=0.3–3.9s) were fed in the photocatalytic reactor.
In order to estimate the adsorption ability of the raw materials and the zeolitic composites for the model VOC molecules,adsorp-tion experiments under realistic dynamic conditions were carried out.The experimental device was the same as that used for the photocatalytic tests.A total gas?ow of700mL min?1containing HCHO and C2HCl3concentration of15ppm or25ppm respectively was used.In an initial step,the material was pre-treated dur-ing12h under air atmosphere and UV-A irradiation in order to remove water and weakly adsorbed organic molecules at the mate-rial surface.Then,the VOC/air gas mixture was introduced in the experimental set-up by-passing the reactor.Once a stable inlet con-centration value was attained,the gas mixture was passed through the reactor containing the sample.The adsorption process com-mences leading to a decrease of the VOC concentration followed by a progressive increase until saturation of the material.The integra-tion of the area above the curve allowed to calculate the amount of VOC adsorbed(Table1).Once the steady-state conditions were achieved,the UV lamps were switched on commencing thus the photocatalytic reaction.The evolution of the concentration of the
102I.Jansson et al./Applied Catalysis B:Environmental178(2015)100–107
Table1
Properties of the reference materials and the zeolite/TiO2composites heat treated at500?C
Sample Adsorbent SiO2/Al2O3a TiO2(wt.%)BET area(m2g?1)V p(cm3g?1)Pore mean size(nm)Adsorption(?mol g?1catal)
V T Micro b Meso Micro b Meso HCHO C2HCl3
Raw materials
Z1Zeolite Y5–6690.390.250.140.7410832115
Z2Zeolite Y80–8720.560.360.200.75177462
Z3ZSM-523–4040.190.140.050.51–620400
Z4ZSM-580–4560.260.180.080.55–136358
Z5ZSM-5280–4020.170.140.030.60–51300
TiO2––1001520.39–0.26–7.0/13.0194078
TiO2–Xg––1001490.24–0.28–7.0/–5355
Sep/TiO2Sepiolite–501530.62–0.40–15/4521218
Zeolite/TiO2composites
Z1I3Zeolite Y585890.410.220.190.661255780
Z2I3Zeolite Y8087760.510.300.210.691425929
Z3I1ZSM-5232n.a.n.a.n.a.n.a.n.a.n.a.n.a.n.a.
Z3I2ZSM-5234390n.a.n.a.0.08n.a.n.a.581n.a.
Z3I3ZSM-52383790.240.150.090.47–673331
Z3I4ZSM-52316274n.a.n.a.0.15n.a.–700n.a.
Z4I3ZSM-58084220.270.160.110.49–327300
Z5I3ZSM-528083380.240.150.090.48–322271
a SiO2/Al2O3mole ratio.
b Calculated by the Horvath–Kawazoe(HK)method.
n.a.:not analysed.
pollutants and the formation of reaction products at different gas
?ows was continuously monitored.The gas-phase composition was
measured by using a FTIR Thermo-Nicolet5700spectrometer,pro-
vided with a temperature controlled multiple-re?ection gas cell
(optical path2m)maintained at110?C.IR spectra were regis-
tered after accumulation of64scans at a resolution of4cm?1.The
evolution of the reaction products during the reaction was moni-
tored by following the evolution of the representative vibrational
bands of selected molecules.HCHO photodegradation was moni-
tored by following the bands at1842–1623cm?1along with the
characteristic vibration of the CO2band at2435–2233cm?1.The
photodegradation of C2HCl3was monitored by following the bands
at965–903cm?1,the bands for CO2at2435–2233cm?1and the
bands for COCl2at1873–1780cm?1.
Formaldehyde and trichloroethylene conversion values were
calculated according the following equation:
Conversion VOC(%)=C inlet?C outlet
C inlet
×100(1)
where C inlet and C outlet were the concentration of VOC in the reactor inlet and outlet,respectively.In the case of trichloroethylene pho-todegradation,the selectivity to COCl2was calculated as described previously[4,5]:
Selectivity COCl2(%)=
C COCl2
2×(C inlet?C outlet)
×100(2)
3.Result and discussion
The most relevant textural and physicochemical properties of the raw materials and of the zeolite/TiO2composites treated at 500?C under air are shown in Table1.The TGA-DSC analyses for Z1–Z5(not shown)indicate that commercial zeolites are stable within this temperature range.
In order to evaluate the in?uence of zeolite’s structure and of the Si/Al ratio on the photocatalytic performance of the hybrid materi-als,zeolites with the FAU and MFI structures(zeolite Y and zeolite HZSM-5,respectively)were selected.The BET areas of the com-mercial zeolites(Z1to Z5)range between400and880m2g?1.This feature could be indicative of the presence of some amorphous sil-ica and alumina phases in the commercials zeolites.As shown in Table1,all of the zeolites Y(Z1-Z2)exhibit higher surface areas and greater pore volume values than ZSM-5zeolites(Z3–Z5).Zeolite Y and ZSM-5are microporous materials having pores of,0.7nm and 0.5nm,respectively,in good agreement with previously reported values[21].
The commercial Y zeolites used in this work(Z1-Z2)and,as a consequence,the zeolite Y-based materials also contain mesopores of10–17nm.The presence of such mesopores is probably due to a dealumination processes during the synthesis process,probably carried out in order to obtaining the desired Si/Al ratio.On the other hand,the speci?c surface areas of the commercial TiO2,the TiO2xerogel obtained from the dehydration of the TiO2sol and of the Sep/TiO2composite,are signi?cantly smaller,typically in the range of150m2g?1.All of these solids have a large contribution of mesopores due to the separation of particles or aggregates[22,23].
Regarding the formaldehyde adsorption it is important to remark the high HCHO adsorption values for commercial TiO2 following by Z1(zeolite Y SiO2/Al2O3=5)and Z3(ZSM-5 SiO2/Al2O3=23).It is well-known that electrostatically polarised or unbalanced sites of zeolites behave as strong adsorption sites for polar molecules such as formaldehyde[14].On the contrary, the TiO2adsorption ability for trichloroethylene adsorption is sig-ni?cantly lower than for HCHO,highlighting the properties of MFI type structures over FAU.The adsorption ability for both VOC is independent of the surface area.Moreover,an inverse relationship between the FMD and TCE adsorption capacity with the Si/Al ratio and total pore volume was observed.Takeuchi et al.have suggested that toluene or benzene adsorption is closely dependent on the sur-face area rather than other surface properties[17].However,our results are not in line with this observation probably due to as the Si/Al ratio increases,unit cell size shrinks,and the void volume for VOC adsorption decrease.Zeolite/TiO2composites show the gen-eral trend observed for raw materials with a subsequent reduction of the BET area by incorporation of the semiconductor.The large surface area of the ordered micropore structure was maintained due to the low amount of TiO2incorporated on the zeolite matrix.
3.1.In?uence of the TiO2loading
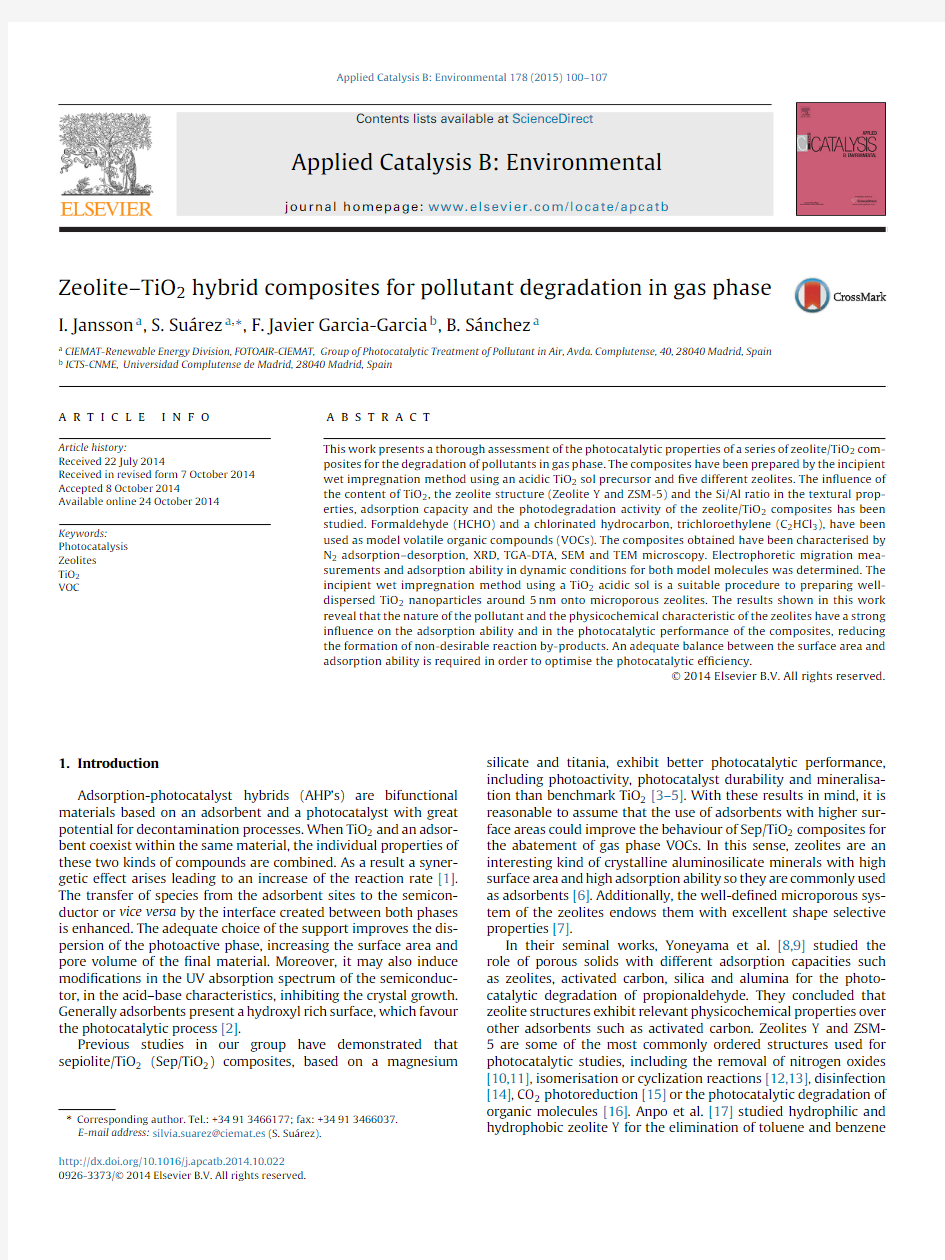
The in?uence of TiO2loading on the textural,adsorption and photocatalytic properties of the zeolite/TiO2hybrid compos-ites has been analysed.Fig.1a and b show representative N2
I.Jansson et al./Applied Catalysis B:Environmental 178(2015)100–107
103
050100150200250300
3504000
0.1
0.2
0.3
0.4
0.5
0.6
0.7
0.8
0.9
1
V o l. a d s ., c m 3g -1
P/P
50
100
150
200
0.1
0.2
0.3
0.4
0.5
0.6
0.7
0.8
0.9
1
V o l. a d s ., c m 3g -1
P/P 0
Fig.1.N 2-adsorption–desorption isotherms for zeolite/TiO 2composites:(a)Zeolite Y ( ,?)Z2,(*,x)Z2I3and (b)ZSM-5(?, )Z3,(?, )Z3I3.Reference:( , )TiO 2–Xg.
adsorption–desorption isotherms recorded for zeolite Y (Z2,Z2I3)and Z3and Z3I3samples respectively.TiO 2–Xg was included for comparison.In order to avoid overlapping of the curves,the isotherm corresponding to others TiO 2amount were not included.According to the IUPAC classi?cation,all zeolites present a Type I isotherm characteristic of microporous solids [24]with a H4hys-teresis cycle closed at 0.4partial pressure which is,in the case of type I isotherms,a sign of microporosity.Clearly,the zeolite Y-based composite Z2I3has a higher degree of microporosity than Z3I3,which is based upon ZSM-5.The TiO 2–Xg records a type IV isotherm,characteristic of mesoporous materials,with a H2type hysteresis loop,indicative of the presence of spherical par-ticles with the so-called “ink bottle”pores type and a pores size of 7.0nm [22].Finally,zeolite/TiO 2composites record a slight reduction of the total pore volume as compared to that of the parent zeolites,probably due to the pore blocking by the TiO 2particles.
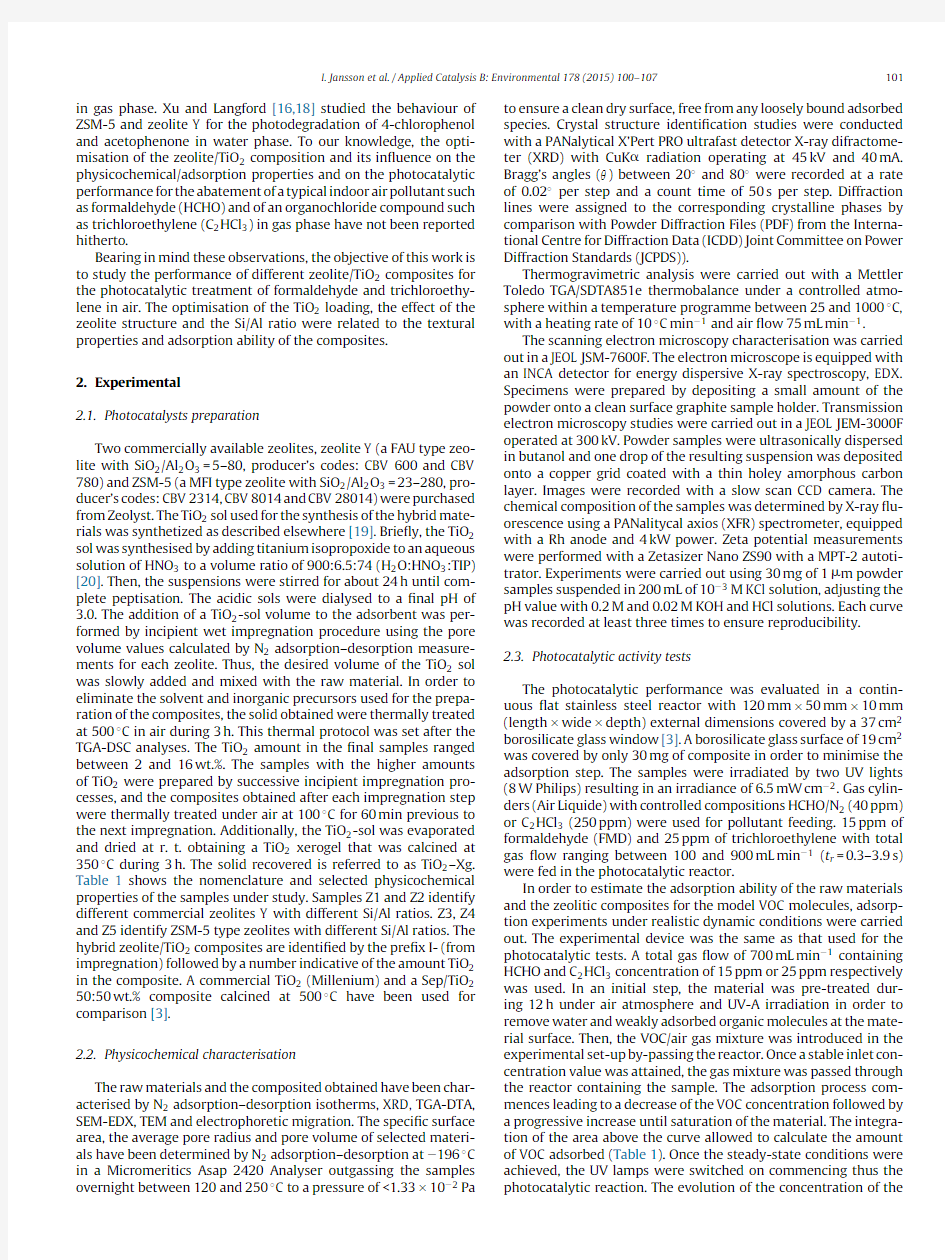
Fig.2shows the X-ray diffraction patterns for Z3and Z3based TiO 2composites (Z3,Z3I2/TiO 2and Z3I3/TiO 2).The difractograms of the TiO 2–xerogel is also shown.MFI or FAU (not shown)type structures were identi?ed in the difractograms of all samples [25,26].The TiO 2xerogel shows the characteristic diffraction lines of TiO 2-anatase (101)(004)(200)planes,with a minor contri-bution of the brookite phase (121),and of the rutile phase (110)
Fig.2.X-ray difractograms of zeolite/TiO 2composites.TiO 2–Xg is included for com-parison:( )TiO 2-anatasa,(?)TiO 2-rutile and (*)TiO 2
-brookite.
020
40
60
80
100
200
400
600
800
1000
C o n v e r s i o n H C H O , %
T otal flow, mL min -1
Fig.3.Effect of TiO 2loading on the photodegradation of formaldehyde for Z3/TiO 2composites (?)Sep/TiO 2,( )Z3I2,(?)Z3I3,( )Z3I4.
(101)[22].The difractograms of the Z3/TiO 2composites also show the characteristic diffraction lines of ZSM-5.A slight decrease in the intensity of the diffraction lines characteristic of the ZSM-5type structure after the incorporation of an 8wt.%TiO 2was observed.This dilution effect is more evident for the TiO 2crystal phases.In fact the characteristic diffraction lines of TiO 2are not observed in the difractograms of the Z3-based/TiO 2composites.Although not shown,similar difractograms have been obtained for the compos-ites prepared with the other ZSM-5(Z4and Z5series)and with zeolite Y (Z1and Z2series).The lack of characteristic X-ray peaks for TiO 2suggests that TiO 2is well dispersed over the zeolite,which in fact prevents the growing of large TiO 2crystallites as previously observed for Sep/TiO 2composites [23].
In order to optimise the TiO 2loading,the photocatalytic proper-ties of the hybrid composites for the degradation of formaldehyde in gas phase at different air ?ows were evaluated.Experiments were conducted at different residence times between 3.9and 0.3s keeping constant the amount of photocatalyst in the reactor.Fig.3shows the evolution of the HCHO conversion with total ?ow recorded for the Z3-based/TiO 2hybrid composites (Z3I2,Z3I3and Z3I4)and with Sep/TiO 2.Under the studied conditions all compos-ites show measurable HCHO conversion which decrease with the increasing total gas ?ow.
104I.Jansson et al./Applied Catalysis B:Environmental 178(2015)
100–107
Fig.4.SEM-EDX micrographs obtained for Z3I3composite.
According to literature,the main oxidative (Eqs.(4)and (5))and reductive processes (Eq.(6))involved in the photocatalytic degra-dation of formaldehyde are [27–29]:TiO 2h
→e ?+h +
(3)HCHO +H 2O +2h +→HCOOH +2H +(4)HCOOH +2h +→CO 2+2H +(5)1
2
O 2+2e ?+2H +→H 2O (6)
In all cases total mineralisation was attained and reaction products other than CO 2were not detected under the operating conditions selected.Noguchi et al.detected formic acid at the TiO 2surface as a partial oxidation by-product [29].However,under the adequate operating conditions (residence time,UV irradia-tion)all of the intermediates and by-products can be oxidised to CO 2.It should be remarked that none of the raw zeolite mate-rials (Z1–Z5)record measurable HCHO conversions under these reaction conditions.The reference Sep/TiO 2shows a signi?cantly lower photocatalytic activity than that recorded for the zeolite/TiO 2composites.As shown in Fig.3,the photocatalytic performance increases with the increasing amount of TiO 2in the composite.The addition of a low amount of TiO 2of 4wt.%to Z3results in a signi?cant photodegradation of HCHO with a maximum conver-sion value of around 80%.A further increasing of TiO 2loading to 8wt.%increases HCHO conversion signi?cantly around a 40%(sam-ple Z3I3).However,increasing TiO 2content to 16wt.%only results in a moderate increasing of HCHO conversion,probably due a lim-itation in the number of adsorbed photons by TiO 2[30].According to these results,the optimum titania loading was set to 8wt.%for further studies.
The TiO 2incorporation on the zeolites was analysed by electron microscopy.Fig.4depicts a SEM-EDX compositional mapping of O,Si and Ti in a typical aggregate of Z3I3particles.Clearly,tita-nium is homogeneously distributed all over the zeolite matrix.The morphology of the zeolite/TiO 2composites (both for zeolite Y and ZSM-5)has been analysed by TEM.The images obtained with Z2I3and Z3I3,which are representative for all zeolite Y and ZSM-5com-posites,are depicted in Fig.5a and b,respectively.In addition,the microstructure of the raw zeolite Y is shown in Fig.5a (back ?g-ure).The ordered micropore structure of the zeolitic materials with channels of 0.55nm or 0.75nm for zeolites ZSM-5and Y,respec-tively,can be observed.Irrespective of the nature of the zeolite,homogeneously distributed TiO 2nanoparticles with mean particle sizes of around 5nm can be clearly distinguished in all compos-ites.This observation is in good agreement with the results derived from the SEM-EDX analysis which show a homogeneous distribu-tion of the TiO 2particles on the zeolites.The nanometric size of the TiO 2domains explains why the lack of diffraction peaks for TiO 2phases in the X-ray difractograms of the hybrid composites.These results reveal that the incipient wet impregnation method using a TiO 2acidic sol is a suitable method to preparing well-dispersed TiO 2nanoparticles onto microporous zeolites.
3.2.In?uence of the zeolite type structure and Si/Al ratio on the photoactivity
In order to determine the in?uence of the zeolite nature (zeo-lite Y vs.ZSM-5with the same Si/Al ratio)and the effect of the Si/Al ratio on the photocatalytic activity of the hybrid compos-ites,the zeolite/TiO 2composites with 8wt.%TiO 2loading were evaluated (see Table 1).The photocatalytic performances were
I.Jansson et al./Applied Catalysis B:Environmental178(2015)100–107
105
Fig.5.TEM micrographs for(a)Z2(back),Z2I3(front)and(b)Z3I2zeolite/TiO2 composites.
measured under the same conditions than those for the photocata-lysts depicted in Fig.3,i.e.,total?ow between300–900mL min?1. VOC(formaldehyde or trichloroethylene)conversions obtained at 700and500mL min?1,respectively,are shown in Fig.6.Fig.6also shows the speci?c surface areas of the catalyst and their adsorption ability towards either formaldehyde or trichloroethylene.The per-formance of TiO2–Xg is shown for comparison.TiO2–Xg has a good photoactivity for the degradation of formaldehyde with conversion value of around80%.Remarkably,and despite of the signi?cantly lower amount TiO2on the zeolite/TiO2composites(8wt.%)all zeolite/TiO2composites record higher photoactivity than TiO2–Xg for the degradation of formaldehyde.Only Z1I3shows a poor HCHO conversion compared to TiO2–Xg.In fact,if data conversion data (?mol HCOOH converted)are normalised to the total amount of TiO2in the samples,Z3I3shows a value of2.7?mol g?2TiO2s?1 whereas TiO2–Xg records only0.2?mol g?2TiO2s?1for TiO2
–Xg.Fig.6.Relationship between the zeolite nature and Si/Al ratio on the surface area, adsorption ability and photocatalytic activity for:(a)formaldehyde degradation at 700mL min?1and(b)trichloroethylene elimination at500mL min?1.()BET area,()HCHO or C2HCl2adsorption of()HCHO conversion,()C2HCl3 conversion and()COCl2selectivity.
The study of the in?uence of the SiO2/Al2O3ratio in the cat-alytic performance of the hybrid composites was conducted with samples Z2I3and Z4I3(SiO2/Al2O3=80).As observed in Fig.6a,Z4I3 exhibits better photocatalytic performance for the photodegrada-tion of HCHO than Z2I3.Similar results have been reported by Kuwahara and Yamashita[31].Fig.6a also illustrates how the Si/Al ratio is very important for the photoactivity of the composites.Thus, an increase of the HCHO conversion of around10%was achieved when the SiO2/Al2O3ratio increases from23to80in the ZSM-5/TiO2composites.However,HCHO conversion remains roughly constant for the composites with higher SiO2/Al2O3ratio.Similar trends than those reported in Fig.6a have been observed for the reactions conducted at900mL min?1.
It is worth to remark that the adsorption capacity of the compos-ites decreases with the increasing Si/Al ratio leading,however,to more photoactive materials.The results obtained for the photoox-idation of HCHO indicate that a strong adsorption of HCHO onto the zeolite component of the composite prevents its access to the photocatalytic active sites of the TiO2phase therefore decreasing the reaction rate.Our results,suggests that an adequate balance between the surface area and adsorption ability is required in order to obtain an optimum photoef?ciency.
Surprisingly,zeolite Y with SiO2/Al2O3=5which shows the highest adsorption capacity and a surface area near600m2g?1, records a rather poor photoactivity for the oxidation of HCHO.In
106I.Jansson et al./Applied Catalysis B:Environmental 178(2015)100–107
-45
-35-25-15-5515
Z P , m V
pH
Fig.7.Variation of zeta potential with pH for commercial zeolite:()Z1,(
)Z2,
()Z3,()Z4,()Z5.
order to understand this behaviour,electrophoretic migration mea-surements were conducted with Z1–Z5zeolites.In Fig.7,the results of the variation of the zeta potential with the pH for commercial zeolites are shown.A decrease of the isoelectric point with the alu-minium content was observed in the zeta potential curves [32].As observed,all zeolites present an isoelectric point below the pH at which the TiO 2sol was synthetized (pH =3.0).Only zeolite Z1exhibits an isoelectric point at pH =7.The measurement of the sur-face net charge for the TiO 2sol at pH =3results in a zeta potential value of +50mV.Thus,TiO 2nanoparticles with a net positive charge are predominant in the TiO 2sol.The interaction with the negatively charged (at pH =3)zeolites (Z2–Z5)is therefore promoted.By con-trary,Z1and TiO 2nanoparticles are positively charged at pH =3thus preventing the interaction between TiO 2and zeolite Z1.
The behaviour of the composites in the photodegradation of trichloroethylene was also investigated.Trichloroethylene pho-tooxidation is,however,more complicated reaction than HCHO photooxidation since,besides CO 2,others non-desirable by-products are formed [33].The ideal reaction is shown in Eq.(7)where TCE is mineralised into CO 2and HCl with participation of adsorbed water or super?cial hydroxyl groups [34].How-ever,others chlorinated partial oxidation reaction products have been identi?ed such as COCl 2(carbonyl dichloride or phosgene),C 2HCl 3O (dichloroacetyl chloride or DCAC)besides CO,HCl [33].It is assumed that OH ?and Cl ?radicals initiate the reaction going through the formation of DCAC (Eq.(8))that can be further oxidised to produce COCl 2(Eq.(9)).C 2HCl 3+32
O 2+H 2O h ?,TiO
2?→2CO 2+3HCl (7)C 2HCl 3+
12
O 2h ?,TiO 2
?→Cl 2HCCOCl (8)Cl 2HCCOCl +
12
O 2h ?,TiO 2
?→COCl 2+HCl +CO (9)
It is well known that the formation of COCl 2can be reduced by increasing the residence time,adding water vapour in the feed or by hydrolysis reactions to product CO 2at dark conditions [35].However,in order to accurately analyse the in?uence of the physicochemical properties of the zeolite/TiO 2composites on the reaction,experiments were performed in the absence of water vapor.C 2HCl 3conversion and selectivity to COCl 2along with the adsorption capacity of composites towards C 2HCl 3are shown in Fig.6b.In line with the results obtained for HCHO,zeolite/TiO 2com-posites are more active than TiO 2–Xg for the photodegradation of C 2HCl 3.The adsorption capacity of ZSM-5is considerable higher than that of zeolite Y,despite the lower surface area of the former.These differences do not seem to affect the photocatalytic activity performance of the composites,since similar results were obtained
for all of them,with the exception of Z1I3.This composite showed the lowest reaction rate as previously observed for the HCHO pho-tooxidation.Unlike for HCHO degradation,the Si/Al ratio has not an apparent in?uence in the degradation of C 2HCl 3with the ZSM-5based composites Nevertheless,the COCl 2selectivity decreases when the Si/Al ratio increases.In the case of Z5I3,the ones with a SiO 2/Al 2O 3ratio of 280,the COCl 2selectivity was around 10%lower than for bare TiO 2.These differences become more obvious,one order of magnitude higher,if the reaction rates are normalised to the actual amount of TiO 2in the catalyst.These results point out that the Si/Al ratio has a strong in?uence in the elimination of reaction by-products.It has been reported that a relationship between the Si/Al ratio and the hydrophobic nature of the zeolite exits [31].The higher the hydrophobicity of the zeolite/TiO 2com-posite the lower is the formation of organochloride https://www.360docs.net/doc/1d18539217.html,mercial zeolites Z1–Z5were tested under the same conditions described in Fig.6.In contrast to FMD photodegradation,commer-cial zeolites were able to photooxidase TCE.Z1records a C 2HCl 3conversion of around 35%,followed by Z4and Z5with conver-sions around 30%.Z3and Z2show conversions less than 10%.These results pointed out the intrinsic ability of zeolites to photodegrade this organochloride compound.It is well known that natural or syn-thetic zeolites and clays may contain traces of iron atoms in the structure.Thus,iron content was analysed by X-ray ?uorescence.All zeolites shown similar iron amounts around 0.02%.The result seems to indicate that factors other than iron content,such as iron oxidation state or location in the zeolitic matrix should be con-sidered in order to explain the photocatalytic performance of the zeolite.
It has been reported that oxidising species or hydrogen spillover can travel on inert surfaces,such as silicon,for quite a long distance [36,37].Hydroxyl radicals generated on the TiO 2sur-face can migrated over a siliceous matrix [38].Haick and Paz [39,40]reported that oxidising species photogenerated on tita-nium dioxide well-de?ned microdomains,are capable of inducing the mineralisation of aliphatic chains anchored to inert silicon domains.The remote photodegradation effect was due to out-diffusion of oxidising species on the surface.It is known that zeolite catalysts can stabilise reactive intermediates in several pho-tochemical reactions.Reactive species such as OH ?or O 2?,which are formed during TiO 2photocatalysis,may be stabilised within the rigid framework of the zeolite,where the adsorbed organic molecules can then be ef?ciently reached by these reactive species [18].Moreover,oxygen adsorption in the zeolite is essential to the electron accepting process on the TiO 2.In line with our previous results obtained for magnesium silicate [3],because of its adsor-bent properties zeolite may acts as a buffer of VOC.Zeolite domains retain a constant VOC concentration in the vicinity of TiO 2photoac-tive sites,allowing the diffusion of non-desirable reaction products when formed,and probably with the subsequent reaction with reactive species such as OH ?or O 2?.
4.Conclusions
Incipient wet impregnation of commercial zeolites with an acidic TiO 2sol is an effective and ef?cient method to immobilise TiO 2nanoparticles of around 5nm particle size,homogeneously distributed on zeolitic structures.The determination of the isoelec-tric point of the commercial zeolites is a fundamental parameter to understand the deposition of TiO 2nanoparticles on the zeolitic matrix.Zeolite/TiO 2hybrid composites exhibit excellent photocat-alytic performances for the degradation of both,formaldehyde and trichloroethylene in gas phase.TiO 2content as low as 8wt.%in the zeolite/TiO 2hybrid composites is enough to promote the photocat-alytic activity of bare TiO 2.
I.Jansson et al./Applied Catalysis B:Environmental178(2015)100–107107
The performance of zeolite/TiO2hybrid composites for VOCs elimination can be improved by the adequate choice of the zeo-lite type and the Si/Al ratio.A direct relationship between the Si/Al ratio and the photodegradation of formaldehyde with a subsequent reduction of the COCl2formation during trichloroethylene degra-dation is observed.This effect is mainly related to the hydrophobic nature of the zeolites.A balance between the surface area and adsorption ability is required in order to optimise the photocat-alytic ef?ciency.These results pointed out the importance of the diffusion of the pollutant,reaction products and oxidising species between both components.
Acknowledgment
Authors are grateful to the Spanish Ministry of Economy and Competitiveness for the?nancial support(projects CTM2011-25093,IPT-2011-1568-310000),Mss.Jansson for the PhD grant (BES-2012-055758)and Dra.Suárez for the Ramón&Cajal Con-tract.The Research Support Unit from the ICP-CSIC is acknowledged for XRD and BET analysis.Dra.I.D′?az is also acknowledged for her valuable comments.
References
[1]F.Fresno,P.Portela,S.Suárez,J.M.Coronado,J.Mater.Chem.2(2014)
2863–2884.
[2]S.Suárez,in:J.M.Coronado,F.Fresno,M.D.Hernández-Alonso,R.Portela(Eds.),
Design of Advanced Photocatalytic Materials for Energy Conversion and Envi-ronmental Applications,Springer-Verlag,London,2013,pp.245–267,ISBN 978-1-4471-5060-2.
[3]S.Suárez,J.M.Coronado,R.Portela,J.C.Martín,M.Yates,P.ávila,B.Sánchez,
Environ.Sci.Technol.42(2008)5892–5896.
[4]T.L.R.Hewer,S.Suárez,J.M.Coronado,R.Portela,P.Avila,B.Sanchez,Catal.
Today13(2009)302–308.
[5]S.Suárez,T.L.R.Hewer,R.Portela,M.D.Hernandez-Alonso,R.S.Freire, B.
Sanchez,Appl.Catal.B101(2011)176–182.
[6]J.Weitkamp,Solid State Ion.131(2000)175–188.
[7]A.Corma,H.Garcia,https://www.360docs.net/doc/1d18539217.html,mun.10(2004)1443–1459.
[8]H.Yoneyama,T.Torimoto,Catal.Today58(2000)133–140.
[9]T.Torimoto,S.Ito,S.Kuwabata,H.Yoneyama,Environ.Sci.Technol.30(1996)
1275–1281.
[10]M.Matsuoka,E.Matsuda,K.Tsuji,H.Yamashita,M.Anpo,J.Mol.Catal.A107
(1996)399–403.[11]M.Matsuoka,W.S.Ju,H.Yamashita,M.Anpo,J.Photochem.Photobiol.A160
(2003)43–46.
[12]K.V.Subba Rao,B.Srinivas,M.Subrahmanyam,Catal.Lett.89(2003)95–102.
[13]S.G.Zhang,S.Higashimoto,H.Yamashita,M.Anpo,J.Phys.Chem.B102(1998)
5590–5594.
[14]G.?Cík,S.Priesolová,H.Bujdáková,F.ˇSerˇs en,T.Pothe?ová,J.Kriˇs tín,Chemo-
sphere63(2006)1419–1426.
[15]K.D.Dubois,A.Petushkov,E.Garcia Cardona,https://www.360docs.net/doc/1d18539217.html,rsen,G.Li,J.Phys.Chem.
Lett.3(2011)486–492.
[16]Y.Xu,https://www.360docs.net/doc/1d18539217.html,ngford,J.Phys.Chem.B101(1997)3115–3121.
[17]M.Takeuchi,M.Hidaka,M.Anpo,J.Hazard.Mater.237–238(2012)133–139.
[18]Y.Xu,https://www.360docs.net/doc/1d18539217.html,ngford,J.Phys.Chem.99(1995)11501–11507.
[19]A.Sirisuk,C.G.Hill Jr.,M.A.Anderson,Catal.Today54(1999)159–164.
[20]S.Yamazaki-Nishida,J.K.Nagano,L.A.Phillips,S.Cervera-March,M.A.Ander-
son,J.Photochem.Photobiol.A70(1993)95–99.
[21]J.ˇCejka,A.Corma,S.Zones,Zeolites and Catalysis:Synthesis,Reactions and
Applications,Wiley-VCH Verlag GmbH&Co.KGaA,Weinheim,Germany, 2010.
[22]N.Miranda-García,S.Suárez,B.Sánchez,J.M.Coronado,S.Malato,M.I.Maldo-
nado,Appl.Catal.B103(2011)294–301.
[23]S.Suárez,M.Yates,P.Avila,J.Blanco,Catal.Today105(2005)499–506.
[24]G.Leofanti,M.Padovan,G.Tozzola,B.Venturelli,Catal.Today41(1998)
207–219.
[25]M.M.J.Treacy,J.B.Higgins(Eds.),Collection of Simulated XRD Powder Diffrac-
tion Patterns for Zeolites,5th revised ed.,Elsevier,Amsterdam,2007.
[26]R.von Ballmoos,J.B.Higgins(Eds.),Collection of Simulated XRD Powder Diffrac-
tion Patterns for Zeolites,2nd revised ed.,Butterworth-Heinemann,Stoneham, 1990.
[27]J.Peral,D.F.Ollis,J.Catal.136(1992)554–565.
[28]M.A.Aguado,M.A.Anderson,C.G.Hill Jr.,J.Mol.Catal.89(1994)165–178.
[29]T.Noguchi,A.Fujishima,K.Hashimoto,P.Sawunyama,Environ.Sci.Technol.
32(23)(1998)3831–3833.
[30]F.Haque,E.Vaisman,https://www.360docs.net/doc/1d18539217.html,ngford,A.Kantzas,J.Photochem.Photobiol.A169
(2005)21–27.
[31]Y.Kuwahara,H.Yamashita,J.Mater.Chem.21(2011)2407–2416.
[32]T.Kuzniatsova,Y.Kim,K.Shqau,P.K.Dutta,H.Verweij,Microporous Meso-
porous Mater.103(2007)102–107.
[33]M.D.Driessen,A.L.Goodman,https://www.360docs.net/doc/1d18539217.html,ler,G.A.Zaharias,V.H.Grassian,J.Phys.
Chem.B102(1998)549–556.
[34]M.R.Nimios,W.A.Jacoby,D.M.Blake,https://www.360docs.net/doc/1d18539217.html,ne,Environ.Sci.Technol.27(1993)
732–740.
[35]W.A.Jacoby,M.R.Nimlos,D.M.Blake,R.D.Noble,C.A.Koval,Environ.Sci.Tech-
nol.28(1994)1661–1668.
[36]S.Suarez,M.Yates,A.L.Petre,J.A.Martin,P.Avila,J.Blanco,Appl.Catal.B64
(2006)302–311.
[37]P.Baeza,M.Villarroel,P.ávila,A.López Agudo,B.Delmon,F.J.Gil-Llambías,
Appl.Catal.A304(2006)109–115.
[38]M.C.Lee,W.Choi,J.Phys.Chem.B106(2002)11818–11822.
[39]H.Haick,Y.Paz,J.Phys.Chem.B105(2001)3045–3051.
[40]H.Haick,Y.Paz,J.Phys.Chem.B107(2003)2319–2326.
浅析hybrid端口的收发报文模式
以太网端口有 3种链路类型:access、trunk、hybrid Access类型端口只能属于1个VLAN用于连接计算机端口; Trunk类型端口可以允许多个VLAN通过可以接收和发送多个VLAN报文般用于交换机的间连接端口; Hybrid类型端口可以允许多个VLAN通过可以接收和发送多个VLAN报文可以用于交换机的间连接也可以用于连接用户计算机 Hybrid端口和Trunk端口在接收数据时处理思路方法是样唯区别的处在于发送数据 时:Hybrid端口可以允许多个VLAN报文发送时不打标签而Trunk端口只允许缺省VLAN报文发送时不打标签 缺省VLAN: Access端口只属于1个VLAN所以它缺省VLAN就是它所在VLAN不用设置;Hybrid端口和Trunk端口属于多个VLAN所以需要设置缺省VLAN ID.缺省情况下Hybrid端口和Trunk端口缺省VLAN为VLAN 1; 如果设置了端口缺省VLAN ID当端口接收到不带VLAN Tag报文后则将报文转发到属于缺省VLAN端口;当端口发送带有VLAN Tag报文时如果该报文VLAN ID和端口缺省VLAN ID相同则系统将去掉报文VLAN Tag然后再发送该报文 注:对于华为交换机缺省VLAN被称为“Pvid Vlan”对于思科交换机缺省VLAN被称为“Native Vlan” 交换机接口出入数据处理过程: Acess端口收报文:收到个报文判断是否有VLAN信息:如果没有则打上端口PVID并进行交换转发如果有则直接丢弃(缺省) Acess端口发报文: 将报文VLAN信息剥离直接发送出去 trunk端口收报文: 收到个报文判断是否有VLAN信息:如果没有则打上端口PVID并进行交换转发如果有判断该trunk端口是否允许该VLAN数据进入:如果可以则转发否则丢弃 trunk端口发报文: 比较端口PVID和将要发送报文VLAN信息如果两者相等则剥离VLAN信息再发送如果不相
h3c端口镜像配置及实例
1 配置本地端口镜像 2 1.2.1 配置任务简介 本地端口镜像的配置需要在同一台设备上进行。 首先创建一个本地镜像组,然后为该镜像组配置源端口和目的端口。 表1-1 本地端口镜像配置任务简介 ●一个端口只能加入到一个镜像组。 ●源端口不能再被用作本镜像组或其它镜像组的出端口或目的端口。 3 1.2.2 创建本地镜像组 表1-2 创建本地镜像组 配置源端口目的端口后,本地镜像组才能生效。 4 1.2.3 配置源端口 可以在系统视图下为指定镜像组配置一个或多个源端口,也可以在端口视图下将当前端口配置为指定镜像组的源端口,二者的配置效果相同。 1. 在系统视图下配置源端口 表1-3 在系统视图下配置源端口
2. 在端口视图下配置源端口 表1-4 在端口视图下配置源端口 一个镜像组内可以配置多个源端口。 5 1.2.4 配置源CPU 表1-5 配置源CPU 一个镜像组内可以配置多个源CPU。 6 1.2.5 配置目的端口 可以在系统视图下为指定镜像组配置目的端口,也可以在端口视图下将当前端口配置为指定镜像组的目的端口,二者的配置效果相同。
1. 在系统视图下配置目的端口 表1-6 在系统视图下配置目的端口 2. 在端口视图下配置目的端口 表1-7 在端口视图下配置目的端口 ●一个镜像组内只能配置一个目的端口。 ●请不要在目的端口上使能STP、MSTP和RSTP,否则会影响镜像功能的正常使 用。 ●目的端口收到的报文包括复制自源端口的报文和来自其它端口的正常转发报文。 为了保证数据监测设备只对源端口的报文进行分析,请将目的端口只用于端口镜 像,不作其它用途。 ●镜像组的目的端口不能配置为已经接入RRPP环的端口。 7 1.3 配置二层远程端口镜像 8 1.3.1 配置任务简介 二层远程端口镜像的配置需要分别在源设备和目的设备上进行。 ●一个端口只能加入到一个镜像组。 ●源端口不能再被用作本镜像组或其它镜像组的出端口或目的端口。 ●如果用户在设备上启用了GVRP(GARP VLAN Registration Protocol,GARP VLAN注册协议)功能,GVRP可能将远程镜像VLAN注册到不希望的端口上, 此时在目的端口就会收到很多不必要的报文。有关GVRP的详细介绍,请参见“配 置指导/03-接入/GVRP配置”。
以太网端口聚合+RSTP配置案例
以太网端口聚合+RSTP配置 拓扑图 功能要求: 通过在网络中配置RSTP功能,实现消除网络环路的目的, 当RSTP的根桥DOWN掉后,可以通过非根桥正常通信,达到根桥和备用根桥的切换,某个链路DOWN后,可以通过将某个阻塞端口恢复为根端口或转发端口,以实现正常的数据通信, 当聚合链路中的某个链路DOWN掉后,不会影响正常的通信 配置过程: S5700-LSW1 [Huawei]DIS CU # sysname Huawei # vlan batch 10 20 # stp mode rstp # cluster enable ntdp enable ndp enable # drop illegal-mac alarm #
diffserv domain default # drop-profile default # aaa authentication-scheme default authorization-scheme default accounting-scheme default domain default domain default_admin local-user admin password simple admin local-user admin service-type http # interface Vlanif1 # interface MEth0/0/1 # interface GigabitEthernet0/0/1 port link-type trunk port trunk allow-pass vlan 10 20 # interface GigabitEthernet0/0/2 port link-type trunk port trunk allow-pass vlan 10 20 # interface GigabitEthernet0/0/3 port link-type access port default vlan 10 stp disable # interface GigabitEthernet0/0/4 port link-type access port default vlan 20 stp disable # interface GigabitEthernet0/0/5 # interface GigabitEthernet0/0/6 # interface GigabitEthernet0/0/7 # interface GigabitEthernet0/0/8 # interface GigabitEthernet0/0/9
聚氨酯丙烯酸酯的合成及应用
聚 氨 酯 丙 烯 酸 酯 的 合 成 及 应 用 姓名:樊荣 学号:2009296015 专业:化学 化学化工学院
聚氨酯丙烯酸酯的合成及应用 樊荣 2009296014 化学 (山西大学化学化工学院山西太原030006) 摘要:聚氨酯丙烯酸酯(PUA)体系综合了聚氨酯树脂和丙烯酸酯树脂各自的优点,使得该体系具有耐溶剂性,耐低温性,耐磨性,耐热冲击性,柔韧性和良好的粘结性,成为目前研究比较活跃的体系。本文就对近年来聚氨酯丙烯酸酯的一些合成方法、性能研究及在各个领域中的应用景做一个简单的综述。 关键字:聚氨酯丙烯酸酯合成性能应用前景 Synthesis of polyurethane acrylate and its application Fan rong 2009296014 chemical (Chemistry and Chemical Engineering of Shanxi University, Taiyuan, Shanxi 030006) Abstract: polyurethane acrylate (PUA) system integrated polyurethane resin and acrylic resin and their respective advantages, so that the system is solvent resistance, low temperature resistance, wear resistance, thermal shock resistance, flexibility and good adhesion, becomes the present study comparing active system. The article in recent years polyurethane acrylate some synthetic methods, properties and applications in various fields of king to do a simple review. Keywords: acrylate polyurethane ,synthesis ,properties , potential applications 前言 聚氨酯丙烯酸酯(PUA)的分子中含有丙烯酸官能团和氨基甲酸酯键,固化后的胶黏剂具有聚氨酯的高耐磨性、粘附力、柔韧性、高剥离强度和优良的耐低温性能以及聚丙烯酸酯卓越的光学性能和耐候性,是一种综合性能优良的辐射固化材料。该体系涂料已经广泛应用于金属、木材、塑料涂层,油墨印刷,织物印花,光纤涂层等方面.目前,PUA已成为防水涂料领域应用非常重要的一大类低聚物,鉴于PUA固化速度较慢、价格相对较高,在常规涂料配方中较少以PUA为主体低聚物,往往作为辅助性功能树脂使用,大多数情况下,配方中使用PUA主要是为了增加涂层的柔韧性、降低应力收缩、改善附着力。但是由于PUA树脂优异的性能,对PUA的研究也日益增多,聚氨酯丙烯酸酯也逐步向跟其他类型的树脂共聚形成杂化体系,向水性体系发展,特别是水性体系因直接采用水稀释降低粘度,使制成的涂料更加环保和健康,减少了活性单体的使用,在很大程度上弥补了PUA树脂价格贵的不足,可以扩大PUA树脂的应用范围,同时减少甚至不使用单体,有效地降低了防水涂料的收缩,减少固化时的内应力,增加涂料的附着力和提高涂膜的柔韧。
以太网端口
目录 第1章以太网端口配置 ............................................................................................................ 1-1 1.1 以太网端口简介.................................................................................................................. 1-1 1.2以太网端口配置步骤.......................................................................................................... 1-1 1.2.1 配置以太网端口描述................................................................................................ 1-1 1.2.2 配置以太网接口状态变化上报抑制时间................................................................... 1-1 1.2.3 以太网端口专有参数配置......................................................................................... 1-2 1.3 以太网端口显示和调试....................................................................................................... 1-4 1.4 以太网端口配置示例 .......................................................................................................... 1-6 1.5 以太网端口排错.................................................................................................................. 1-7第2章以太网端口聚合配置..................................................................................................... 2-1 2.1 以太网端口聚合简介 .......................................................................................................... 2-1 2.2以太网端口聚合配置步骤 .................................................................................................. 2-1 2.3 以太网端口聚合显示和调试................................................................................................ 2-2 2.4 以太网端口聚合配置示例 ................................................................................................... 2-2 2.5 以太网端口聚合排错 .......................................................................................................... 2-3第3章以太网端口镜像配置..................................................................................................... 3-1 3.1 以太网端口镜像简介 .......................................................................................................... 3-1 3.2 以太网端口镜像配置步骤 ................................................................................................... 3-1 3.3 以太网端口镜像显示和调试................................................................................................ 3-2 3.4 以太网端口镜像配置示例 ................................................................................................... 3-2 3.5以太网端口镜像排错.......................................................................................................... 3-4
hybrid端口配置
1功能需求及组网说明 交换机Hybrid端口隔离配置图1 『配置环境参数』 1. PC1、PC2和PC3分别连接到二层交换机SwitchA的端口E0/1 、E0/2和 E0/3,端口分属于VLAN10、20和30,服务器连接到端口G2/1,属于VLAN100。 2. PC1的IP地址为10.1.1.1/24,PC2的IP地址为10.1.1.2/24,PC3的IP地址为10.1.1.3/24,服务器的IP地址为10.1.1.254/24。 『组网需求』 1. PC1和PC2之间可以互访; 2. PC1和PC3之间可以互访; 3. PC1、PC2和PC3都可以访问服务器; 4. 其余的PC间访问均禁止。
交换机Hybrid端口隔离配置图2 『配置环境参数』 1. PC1、PC2和PC3分别连接到二层交换机SwitchA的端口E0/1 、E0/2和 E0/3,端口分属于VLAN10、20和30;PC4和PC5分别连接到二层交换机SwitchB 的端口E0/1和E0/2,端口分属于VLAN10和20; 2. SwitchA通过端口G2/1,连接到SwitchB的端口G1/1;SwitchA的端口G2/1和SwitchB的端口G1/1均不是Trunk端口; 3. PC1的IP地址为10.1.1.1/24,PC2的IP地址为10.1.1.2/24,PC3的IP地址为10.1.1.3/24,PC4的IP地址为10.1.1.4/24,PC5的IP地址为10.1.1.5/24。 『组网需求』 1. PC1和PC3之间可以互访; 2. PC2和PC3之间可以互访; 3. PC1和PC4之间可以互访; 4. PC2和PC5之间可以互访; 5. 其余PC之间均禁止互相访问。 2数据配置步骤 『交换机Hybrid端口配置流程』
华为交换机端口镜像配置举例
华为交换机端口镜像配置举例 配置实例 文章出处:https://www.360docs.net/doc/1d18539217.html, 端口镜像是将指定端口的报文复制到镜像目的端口,镜像目的端口会接入数据监测设备,用户利用这些设备分析目的端口接收到的报文,进行网络监控和故障排除。本文介绍一个在华为交换机上通过配置端口镜像实现对数据监测的应用案例,详细的组网结构及配置步骤请查看以下内容。 某公司内部通过交换机实现各部门之间的互连,网络环境描述如下: 1)研发部通过端口Ethernet 1/0/1接入Switch C;λ 2)市场部通过端口Ethernet 1/0/2接入Switch C;λ 3)数据监测设备连接在Switch C的Ethernet 1/0/3端口上。λ 网络管理员希望通过数据监测设备对研发部和市场部收发的报文进行监控。 使用本地端口镜像功能实现该需求,在Switch C上进行如下配置: 1)端口Ethernet 1/0/1和Ethernet 1/0/2为镜像源端口;λ 2)连接数据监测设备的端口Ethernet 1/0/3为镜像目的端口。λ 配置步骤 配置Switch C: # 创建本地镜像组。
配置以太网单板的内部端口
配置以太网单板的内部端口 当网元通过以太网板内部端口(即VCTRUNK)将以太网业务传输到SDH侧时,需配置VCTRUNK端口的各种属性,以便配合对端网元的以太网单板,实现以太网业务在SDH网络中的传输。 前提条件 用户具有“网元操作员”及以上的网管用户权限。 已创建以太网单板。 注意事项 注意:错误的配置绑定通道,可能会导致业务中断。 操作步骤 1.在网元管理器中选择以太网单板,在功能树中选择“配置 > 以太网接口管理 > 以太 网接口”。 2.选择“内部端口”。 3.配置内部端口的TAG属性。 a.选择“TAG属性”选项卡。 b.配置内部端口的TAG属性。 c.单击“应用”。 4.配置内部端口的网络属性。 a.选择“网络属性”选项卡。 b.配置内部端口的网络属性。
图1支持QinQ功能的以太网单板的内部端口属性 图2支持MPLS功能的以太网单板的内部端口属性 c.单击“应用”。 5.配置内部端口使用的封装映射协议。 a.选择“封装/映射”选项卡。 b.配置内部端口使用的封装协议及各参数。 说明:传输线路两端的以太网单板的VCTURNK的“映射协议”和协议参数应保 持一致。 c.单击“应用”。 6.配置内部端口的LCAS功能。 a.选择“LCAS”选项卡。
b.设置“LCAS使能”以及LCAS其他参数。 说明:传输线路两端的以太网单板的VCTURNK的“LCAS使能”和LCAS协议参 数应保持一致。 c.单击“应用”。 7.设置端口的绑定通道。 a.选择“绑定通道”选项卡,单击“配置”,出现“绑定通道配置”对话框。 b.在“可配置端口”中选择VCTRUNK端口作为配置端口,在“可选绑定通道”中 选择承载层时隙。单击。 c.单击“确定”,单击“是”。出现“操作结果”对话框,提示操作成功。
聚氨酯树脂
聚氨酯树脂 第一节 概 述 1937年,德国化学家Otto Bayer 及其同事用二或多异氰酸酯和多羟基化合物通过聚加成反应合成了线形、支化或交联型-聚合物,即聚氨酯,标志着聚氨酯的开发成功。其后的技术进步和产业化促进了聚氨酯科学和技术的快速发展。最初使用的是芳香族多异氰酸酯(甲苯二异氰酸酯),60年代以来,又陆续开发出了脂肪族多异氰酸酯。聚氨酯树脂在涂料、黏合剂及弹性体行业取得了广泛、重要的应用。据有关文献报道,在全球聚氨酯产品的消耗总量中,北美洲和欧洲占到70%左右,美国人均年消耗聚氨酯材料约5.5kg ,西欧约4.5kg 。而我国的消费水平还很低,年人均不足0.5kg ,具有极大发展空间。 聚氨酯(polyurethane)大分子主链上含有许多氨基甲酸酯基( NH C O O )。它由二(或多)异氰酸酯、 二(或多)元醇与二(或多)元胺通过逐步聚合反应生成,除了氨基甲酸酯基(简称为氨酯基, NH C O O ) 外,大分子链上还往往含有醚基( O )、酯基( C O O )、脲基( NH C O NH -)、 酰胺基( NH C O )等基团,因此大分子间很容易生成氢键。 聚氨酯是综合性能优秀的合成树脂之一。由于其合成单体品种多、反应条件温和、专一、可控、配方调整余地大及其高分子材料的微观结构特点,可广泛用于涂料、黏合剂、泡沫塑料、合成纤维以及弹性体,已成为人们衣、食、住、行以及高新技术领域必不可少的材料之一,其本身已经构成了一个多品种、多系列的材料家族,形成了完整的聚氨酯工业体系,这是其它树脂所不具备的。 第二节 聚氨酯化学 一、异氰酸酯的反应机理 异氰酸酯指结构中含有异氰酸酯(-NCO ,即-N==C==O )基团的化合物,其化学活性适中。一般认为异氰酸酯基团具有如下的电子共振结构: R N C O O C N R O C N R 根据异氰酸酯基团中N 、C 、O 元素的电负性排序:O(3.5)>N(3.0)>C(2.5),三者获得电子的能力是:O >N >C 。另外:—C=O 键键能为733kJ/mol,-C=N-键键能为553kJ/mol,所以碳氧键比碳氮键稳定。 因此,由于诱导效应在-N=C=O 基团中氧原子电子云密度最高,氮原子次之,碳原子最低,碳原子形成亲电中心,易受亲核试剂进攻,而氧原子形成亲核中心。当异氰酸酯与醇、酚、胺等含活性氢的亲核试剂反应时,-N=C=O 基团中的氧原子接受氢原子形成羟基,但不饱和碳原子上的羟基不稳定,经过分子内重排生成氨基甲酸酯基。反应如下: 二、异氰酸酯的反应 异氰酸酯基团具有适中的反应活性,涂料化学中常用的反应有异氰酸酯基团与羟基的反应,与水的反应,与胺基的反应,与脲的反应,以及其自聚反应等。 其中多异氰酸酯同羟基化合物的反应尤为重要,其反应条件温和,可用于合成聚氨酯预聚体、多异氰 R 1N H OR 2[R 1N C OR 2OH]R 1N H C O OR 2 C O +
华为交换机端口的hybrid属性配置
华为交换机端口的hybrid属性配置 先说一下以太网中端口类型: 以太网端口有三种链路类型:Access、Hybrid和Trunk。 Access类型的端口只能属于1个VLAN,一般用于连接计算机的端口; Trunk类型的端口可以允许多个VLAN通过,可以接收和发送多个VLAN的报文,一般用于交换机之间连接的端口; Hybrid类型的端口可以允许多个VLAN通过,可以接收和发送多个VLAN的报文,可以用于交换机之间连接,也可以用于连接用户的计算机。 Hybrid端口和Trunk端口在接收数据时,处理方法是一样的,唯一不同之处在于发送数据时:Hybrid端口可以允许多个VLAN的报文发送时不打标签 ,而Trunk端口只允许缺省VLAN的报文发送时不打标签。 交换机上如果已经设置了某个端口为trunk端口,则不可以再把另外的端口设置为hybrid端口。 端口hybrid属性配置 『配置环境参数』 1.交换机SwitchA的端口E0/1.E0/2和E0/3和E0/4.E0/5分属于VLAN10、20和30,服务器Server1连接到端口E0/23,Server2连接到端口E0/24,分 别属vlan40,vlan50. 2.所有设备的ip地址均在同一网段。 『组网需求』 1.只有Vlan10.20及VLAN30中的4端口可访问Sever2; 2.Vlan10中的2端口pc可访问Vlan30; 3.三个Vlan的PC都可以访问服务器Server1; 4.Vlan20可访问Vlan30的5端口。 『交换机Hybrid端口配置流程』 利用Hybrid端口的特性――一个端口可以属于多个不同的VLAN,来完成分属不同VLAN内的同网段PC机的访问需求。 『配置过程』 【SwitchA相关配置】 1.首先创建业务需要的vlan
以太网端口配置命令
一以太网端口配置命令 1.1.1 display interface 【命令】 display interface[ interface_type | interface_type interface_num | interface_name ] 【视图】 所有视图 【参数】 interface_type:端口类型。 interface_num:端口号。 interface_name:端口名,表示方法为interface_name=interface_type interface_num。 参数的具体说明请参见interface命令中的参数说明。 【描述】 display interface命令用来显示端口的配置信息。 在显示端口信息时,如果不指定端口类型和端口号,则显示交换机上所 有的端口信息;如果仅指定端口类型,则显示该类型端口的所有端口信 息;如果同时指定端口类型和端口号,则显示指定的端口信息。 【举例】 # 显示以太网端口Ethernet0/1的配置信息。
端口镜像典型配置举例
端口镜像典型配置举例 1.5.1 本地端口镜像配置举例 1. 组网需求 某公司内部通过交换机实现各部门之间的互连,网络环境描述如下: ●研发部通过端口GigabitEthernet 1/0/1接入Switch C; ●市场部通过端口GigabitEthernet 1/0/2接入Switch C; ●数据监测设备连接在Switch C的GigabitEthernet 1/0/3端口上。 网络管理员希望通过数据监测设备对研发部和市场部收发的报文进行监控。 使用本地端口镜像功能实现该需求,在Switch C上进行如下配置: ●端口GigabitEthernet 1/0/1和GigabitEthernet 1/0/2为镜像源端口; ●连接数据监测设备的端口GigabitEthernet 1/0/3为镜像目的端口。 2. 组网图 图1-3 配置本地端口镜像组网图 3. 配置步骤 配置Switch C: # 创建本地镜像组。
配置基于端口的vlan及实例
1 配置基于Access端口的VLAN 配置基于Access端口的VLAN有两种方法:一种是在VLAN视图下进行配置,另一种是在接口视图/端口组视图/二层聚合接口视图或二层虚拟以太网接口视图下进行配置。 表1-4 配置基于Access端口的VLAN(在VLAN视图下) 表1-5 配置基于Access端口的VLAN(在接口视图/端口组视图下/二层聚合接口视图/二层虚拟以太网接口视图)
●在将Access端口加入到指定VLAN之前,要加入的VLAN必须已经存在。 ●在VLAN视图下向VLAN中添加端口时,只能添加二层以太网端口。● 2 1.4. 3 配置基于Trunk端口的VLAN Trunk端口可以允许多个VLAN通过,只能在接口视图/端口组视图/二层聚合接口视图或二层虚拟以太网接口视图下进行配置。 表1-6 配置基于Trunk端口的VLAN
●Trunk端口和Hybrid端口之间不能直接切换,只能先设为Access端口,再设 置为其它类型端口。例如:Trunk端口不能直接被设置为Hybrid端口,只能先 设为Access端口,再设置为Hybrid端口。 ●配置缺省VLAN后,必须使用port trunk permit vlan命令配置允许缺省VLAN 的报文通过,出接口才能转发缺省VLAN的报文。 3 1.4. 4 配置基于Hybrid端口的VLAN Hybrid端口可以允许多个VLAN通过,只能在接口视图/端口组视图/二层聚合接口视图或二层虚拟以太网接口视图下进行配置。 表1-7 配置基于Hybrid端口的VLAN
●Trunk端口和Hybrid端口之间不能直接切换,只能先设为Access端口,再设 置为其它类型端口。例如:Trunk端口不能直接被设置为Hybrid端口,只能先 设为Access端口,再设置为Hybrid端口。 ●在设置允许指定的VLAN通过Hybrid端口之前,允许通过的VLAN必须已经存 在。 ●配置缺省VLAN后,必须使用port hybrid vlan命令配置允许缺省VLAN的报 文通过,出接口才能转发缺省VLAN的报文。 4 1.4. 5 基于端口的VLAN典型配置举例 1. 组网需求 ●Host A和Host C属于部门A,但是通过不同的设备接入公司网络;Host B和 Host D属于部门B,也通过不同的设备接入公司网络。 ●为了通信的安全性,也为了避免广播报文泛滥,公司网络中使用VLAN技术来 隔离部门间的二层流量。其中部门A使用VLAN 100,部门B使用VLAN 200。 ●现要求不管是否使用相同的设备接入公司网络,同一VLAN内的主机能够互 通。即Host A和Host C能够互通,Host B和Host D能够互通。 2. 组网图 图1-6 基于端口的VLAN组网图 3. 配置步骤 (1)配置Device A # 创建VLAN 100,并将Ethernet1/1加入VLAN 100。
丙烯酸树脂基础知识
丙烯酸树脂基础知识 丙烯酸树脂是由丙烯酸酯类和甲基丙烯酸酯类几其它烯属单体共聚制成的树脂,通过选用不同的树脂结构、不同的配方、生产工艺及溶剂组成,可合成不同类型、不同性能和不同应用场合的丙烯酸树脂,丙烯酸树脂根据结构和成膜机理的差异又可分为热塑性丙烯酸树脂和热固性丙烯酸树脂。 热固性丙烯酸树脂是指在结构中带有一定的官能团,在制漆时通过和加入的氨基树脂、环氧树脂、聚氨酯等中的官能团反应形成网状结构,热固性树脂一般相对分子量较低。热固性丙烯酸涂料有优异的丰满度、光泽、硬度、耐溶剂性、耐侯性、在高温烘烤时不变色、不返黄。最重要的应用是和氨基树脂配合制成氨基-丙烯酸烤漆,目前在汽车、摩托车、自行车、卷钢等产品上应用十分广泛。 按生产的方式分类可以分为: 1、乳液聚合: 是通过单体、引发剂及其反应溶剂一起反应聚合而成,一般所成树脂为固体含量为50%的树脂溶液,其一般反应用的溶为苯类(甲苯或是二甲苯)、酯类(乙酸乙酯、乙酸丁酯),一般是单一或是混合。固乳液型的丙烯酸树脂一般会因溶剂的选择不同而使产品性能不一样。一般玻璃化温度较低,因为是用不带甲基的丙烯酸酯下去反应。该类型的树脂可以有较高的固含量,可达到80%,可做高固体分涂料。 2、悬浮聚合: 是一种较为复杂的生产工艺,是做为生产固体树脂而采用的一种方法。固体丙烯酸树脂一般都采用带甲基的丙烯酸酯的反应聚合。不带甲基的丙烯酸酯在反应滏中聚合反应不易控制,容易发粘而至爆锅。工艺流程是将单体、引发剂、助剂投入反应斧中然后放入蒸溜水反应。在一定时间和温度反应后再水洗,然后再烘干过滤等。其产品的生产控制较为严格,如在中间的哪一个环节做得不到位,其出来的产品就会有一定的影响,体现在颜色上面和分子量的差别。
端口Access、Hybrid和Trunk三种模式的区别及配置实例
端口Access、Hybrid和Trunk三种模式的理解 2010-06-15 23:27:00| 分类:网络工程师学习日| 标签:|字号大中小订阅 Access、Hybrid和Trunk三种模式的理解 以太网端口的三种链路类型:Access、Hybrid和Trunk: Access 类型的端口只能属于1个VLAN,一般用于连接计算机的端口,也可以连接交换机和交换机。 Trunk 类型的端口可以允许多个VLAN通过,可以接收和发送多个VLAN的报文,trunk口一般用于连接两台交换机,这样可以只用一条trunk连接实现多个vlan的扩展(因为trunk允许多个vlan的数据通过,如果用access口,那么一个vlan就要一条连接,多个vlan 要多个连接,而交换机的接口是有限的)。对于trunk口发送出去的报文,只有默认vlan的报文不带vlan ID,其它vlan的报文都要带vlan ID(要不然,对端的交换机不知道该报文属于哪个vlan,无法处理,也就不能实现vlan跨交换机扩展了)。简而言之,trunk端口的设计目的就是通过一条连接实现多个vlan的跨交换机扩展。Hybrid 类型的端口可以允许多个VLAN通过,可以接收和发送多个VLAN的报文,可以用于交换机之间连接,也可以用于连接用户的计算机。trunk端口是hybrid端口的特例,就是说hybrid端口可以实现
比trunk端口更多的功能。hybrid端口可以加入多个vlan,并可以设置该vlan的报文通过该端口发送是是否带vlan ID(trunk端口不能设置,只有默认vlan的报文不带vlan ID进行发送)。通过下面的两个例子(转载的),大家应该可以看出hybrid端口的设计目的。 例一:『配置环境参数』 1. PC1、PC2和PC3分别连接到二层交换机SwitchA的端口E0/1 、E0/2和E0/3,端口分属于VLAN10、20和30,服务器连接到端口G2/1,属于VLAN100。 2. PC1的IP地址为10.1.1.1/24,PC2的IP地址为10.1.1.2/24,PC3的IP地址为10.1.1.3/24,服务器的IP地址为10.1.1.254/24。『组网需求』 1. PC1和PC2之间可以互访; 2. PC1和PC3之间可以互访; 3. PC1、PC2和PC3都可以访问服务器; 4. 其余的PC间访问均禁止。 【SwitchA相关配置】 1. 创建(进入)VLAN10,将E0/1加入到VLAN10 [SwitchA]vlan 10 [SwitchA-vlan10]port Ethernet 0/1 2. 创建(进入)VLAN20,将E0/2加入到VLAN20
端口镜像配置
的需要,也迫切需要
例如,模块1中端口1和端口2同属VLAN1,端口3在VLAN2,端口4和5在VLAN2,端口2监听端口1和3、4、5, set span 1/1,1/3-5 1/2 2950/3550/3750 格式如下: #monitor session number source interface mod_number/port_number both #monitor session number destination interface mod_mnumber/port_number //rx-->指明是进端口得流量,tx-->出端口得流量 both 进出得流量 for example: 第一条镜像,将第一模块中的源端口为1-10的镜像到端口12上面; #monitor session 1 source interface 1/1-10 both #monitor session 1 destination interface 1/12 第二条镜像,将第二模块中的源端口为13-20的镜像到端口24上面; #monitor session 2 source interface 2/13-20 both #monitor session 2 destination interface 2/24 当有多条镜像、多个模块时改变其中的参数即可。 Catalyst 2950 3550不支持port monitor C2950#configure terminal C2950(config)# C2950(config)#monitor session 1 source interface fastEthernet 0/2 !--- Interface fa 0/2 is configured as source port. C2950(config)#monitor session 1 destination interface fastEthernet 0/3 !--- Interface fa0/3 is configured as destination port. 4配置命令 1. 指定分析口 feature rovingAnalysis add,或缩写 f r a, 例如: Select menu option: feature rovingAn alysis add Select analysis slot: 1?& nbsp; Select analysis port: 2 2. 指定监听口并启动端口监听 feature rovingAnalysis start,或缩写 f r sta, 例如: Select menu option: feature rovingAn alysis start Select slot to monitor ?(1-12): 1 Select port to monitor&nb sp;?(1-8): 3