雅思写作小作文汇总

饼图pie chart
C7-TEST4
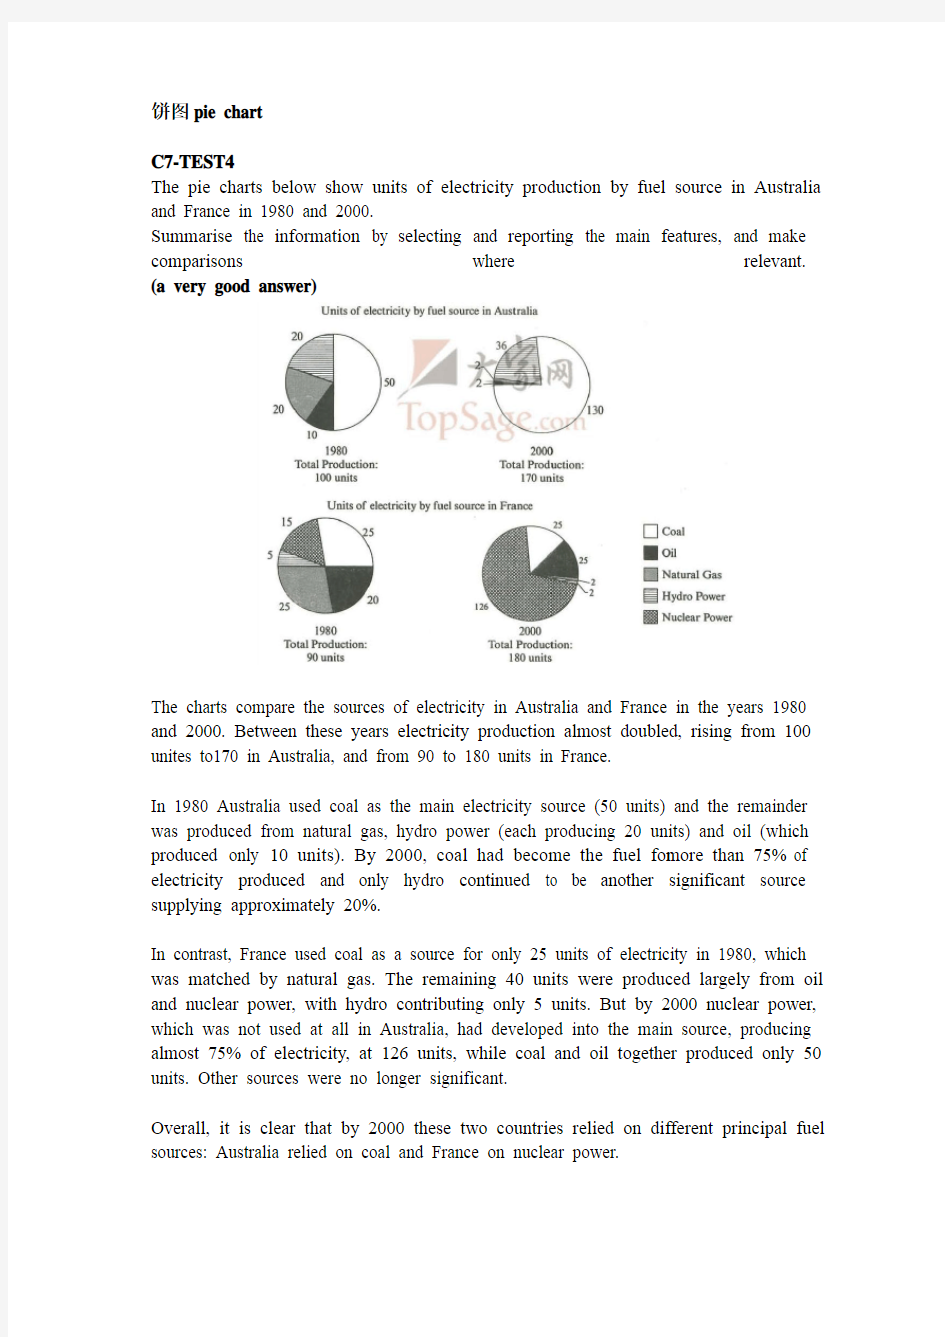
The pie charts below show units of electricity production by fuel source in Australia and France in 1980 and 2000.
Summarise the information by selecting and reporting the main features, and make comparisons where relevant.
(a very good answer)
The charts compare the sources of electricity in Australia and France in the years 1980 and 2000. Between these years electricity production almost doubled, rising from 100 unites to170 in Australia, and from 90 to 180 units in France.
In 1980 Australia used coal as the main electricity source (50 units) and the remainder was produced from natural gas, hydro power (each producing 20 units) and oil (which produced only 10 units). By 2000, coal had become the fuel for more than 75% of electricity produced and only hydro continued to be another significant source supplying approximately 20%.
In contrast, France used coal as a source for only 25 units of electricity in 1980, which was matched by natural gas. The remaining 40 units were produced largely from oil and nuclear power, with hydro contributing only 5 units. But by 2000 nuclear power, which was not used at all in Australia, had developed into the main source, producing almost 75% of electricity, at 126 units, while coal and oil together produced only 50 units. Other sources were no longer significant.
Overall, it is clear that by 2000 these two countries relied on different principal fuel sources: Australia relied on coal and France on nuclear power.
C8-TEST2
The three pie charts below show the changes in annual spending by a particular UK school in 1981, 1991 and 2001.
Summarise the information by selecting and reporting the main features, and make comparisons where relevant.
(a very good answer)
The chart show how much a UK school spent on different running costs in three separate years: 1981, 1991 and 2001.
In all three years, the greatest expenditure was on staff salaries. But while other workers’ salaries saw a fall from 28%in 1981 to only 15% of spending in 2001, teachers’ pay remained the biggest cost, reaching 50% of total spending in 1991 and ending at 45% in 2001.
Expenditure on resources such as books had increased to 20% by 1991 before decreasing to only 9% by the end of the period. In contrast, the cost of furniture and equipment saw an opposite trend. This cost decreased to only 5% of total expenditure in 1991 but rose dramatically in 2001 when it represented 23% of the school budget. Similarly, the cost of insurance saw a rising trend, growing from only 2% to 8% by
2001.
Overall, teachers’ salaries constituted the largest cost to the school, and while spending increased dramatically for equipment and insurance, there were corresponding drops in expenditure on things such as books and on other workers’ salaries.
C8-TEST1
The pie chart below shows the main reasons why agricultural land becomes less productive. The table shows how these causes affected three regions of the world during the 1990s.
Summarise the information by selecting and reporting the main features, and make comparisons where relevant.
(a very good answer)
The pie chart shows that there are four main causes of farmland becoming degraded in the world today. Globally, 65% of degradation is caused by too much animal grazing and tree clearance, constituting 35% and 30% respectively. A further 28% of global degradation is due to over-cultivation of crops. Other causes account for only 7% collectively.
These causes affected different regions differently in the 1990s, with Europe having as much as 9.8% of degradation, while the impact of this on Oceania and North America was minimal, with only 1.7% and 0.2% of land affected respectively. Europe, with the highest overall percentage of land degradation (23%), also suffered from over-cultivation (7.7%) and over-grazing (5.5%). In contrast, Oceania had 13% of degraded farmland and this was mainly due to over-grazing (11.3%). North America had a lower proportion of degraded land at only 5%, and the main couses of this were over-cultivation (3.3%) and, to a lesser extent, over-grazing (1.5%).
Overall, it is clear that Europe suffered more from farmland degradation than the other regions, and the main causes there were deforestation and over-cultivation.
线图line graph
C3-TEST4
The graph below shows the unemployment rates in the US and Japan between March 1993 and March 1999.
Write a report for a university lecturer, describing the information shown below.
(7 score)
According to the results of the labor-force research published recently, the following conclusions can be draw from it:
In March, 1993, United States had seven percent of their workforce which might not seem disastrous until compared with Japan, where 2.5% were unemployed. However, the unemployment rate in United States began declining slowly since March 1993, and reached 5% mark in the middle of 1996. Japan turned out to be less lucky, as their
unemployment rate doubled in three years. From then on, the percentage of unemployed workforce in United States remained roughly the same—about 5% until March 99, although there were minor falls and rises in the unemployment rate.
As for Japan, the percentage of unemployed fell rapidly by 0.5-0.6% after March 1996, but from summer 1996 and onwards it grew steadily and without any falls to reach 5.0% boundary in March 1999.
The major conclusion that I’ve drawn usin g the graph, is that number of unemployed in USA decreased by about 2.0% in the course of six years, while in Japan it actually increased by 2.5% percent. As a result, in March 99, both Japan and US had about 5% of their work force unemployed.
C5-TEST1
The graph below shows the proportion of the population aged 65 and over between 1940 and 2040 in the three different countries.
Summarise the information by selecting and reporting the main features and make comparisons where relevant.
(a very good answer)
The graph shows the increase in the ageing population in Japan, Sweden and the USA. It indicates that the percentage of elderly people in all three countries is expected to increase to almost 25% of the respective populations by the year 2040.
In 1940 the proportion of people aged 65 or more stood at only 5% in Japan, approximately 7% in Sweden and 9% in the US. However, while the figures for the Western countries grew to about 15% in around 1990, the figure for Japan dipped to only 2.5% for much of this period, before rising to almost 5% again at the present time.
In spite of some fluctuation in the expected percentages, the proportion of older people will probably continue to increase in the next two decades in the three countries. A more dramatic rise is predicted between 2030 and 2040 in Japan, by which time it is thought that the proportion of elderly people will be similar in the three countries.
C7-TEST2
The graph below shows the consumption of fish and some different kinds of meat in a European country between 1979 and 2004 in the three different countries. Summarise the information by selecting and reporting the main features, and make comparisons where relevant.
(a very good answer)
The graph illustrates changes in the amounts of beef, lamb, chicken and fish consumed in a particular European country between 1979 and 2004.
In 1979 beef was by far the most popular of these foods, with about 225 grams consumed per person per week. Lamb and chicken were eaten in similar quantities (around 150 grams), while much less fish was consumed (just over 50 grams).
However, during this 25-year period the consumption of beef and lamb fell dramatically to approximately 100 grams and 55 grams respectively. The consumption of fish also declined, but much less significant to just below 50 grams, so although it remained the least popular food, consumption levels were the most stable.
The consumption of chicken, on the other hand, showed an upward trend, overtaking that of lamb in 1980 and that of beef in 1989. By 2004 it had soared to almost 250 grams per person per week.
Overall, the graph shows how the consumption of chicken increased dramatically while the popularity of these other foods decreased over the period.
C8-TEST4
The graph below shows the quantities of goods transported in the UK between 1974 and 2002 by four different modes of transport.
Summarise the information by selecting and reporting the main features, and make comparisons where relevant.
(8 score)
The graph illustrates the quantities of goods transported in the United Kingdom by four different modes of transport between the time period of 1974 and 2002. Over this span of 28 years, the quantities of goods transported by road, water and pipeline have
all increased while the quantity transported by rail has remained almost constant at about 40 million tonnes.
The largest quantity of goods transported both in 1974 and 2002 was by road (70million tonnes and 98 million tonnes respectively) while the lowest both in 1974 and 2002 was by pipeline (about 5 million tonnes and 22 million tonnes respectively). The amount of goods transported by water was constant from 1974 to 1978, where it showed an exponential growth, rising to almost 60 million tonnes after which it plateayed for about 20 years before starting to rise gradually again.
The amount of goods transported by rail is almost constant at 40 million tonnes in 1974 and 2002, with decreases in quantity in between the years. It is also interesting to note that almost all showed a decrease in 1994 in amount of goods transported except for the pipeline, which actually peaked in that year.
In conclusion the road remains the most popular method of transporting goods in the UK while water and pipelines are becoming increasingly used, have not become more popular as a method of transport.
C3-TEST1
The charts below show the number of Japanese tourists travelling abroad between 1985 and 1995 and Australia’s share of the Japanese tourists market.
Write a report for a university lecturer, describing the information shown below.
(5 score)
This chart shows us that Japanese tourists go abroad for travelling in a decade and Australian’s share o f marketing for Japanese tourists. Between 1985 and 1995 Japanese tourists travelling abroad was dramatically increased. In 85 there was about 5million travellar go abroad. Since 85 number of traveller went up dramatically until 90. It was alomost twice then between 90 and 93 the number remain stateable, which is about 12 millions. From 93 to 95 it rose slightly. Therefore in 1995 there were about 15 millions people went abroad.
I am going to write about the other chart, which is Australian’s share of Japa nese’s tourist market. This is also between 1985 and 1995. About 2 million Japanese tourist went to Australia in 1985. Between 85 and 89 people went there is increased sharply, which is almost 3 times more. In 1990 it fall number slightly but from 90 to 94 number is went up. However 94 to 95 is not so went up number of people who went to Australia. It rimain is the same or slightly decreased.
(The writer does what is required of her in terms of task fulfillment, and the message can be followed, but the weakness in grammatical control and in spelling cause difficulty for the reader. Complex sentence structures are attempted, but the greatest level of accuracy are found in basic, simple structures.)
C4-TEST4
The chart below give information about travel to and from UK, and about the most
popular countries for UK residents to visit.
Summarise the information by selecting and reporting the main features, and make comparisons where relevant.
(5 score)
The graphs reveal an information about overseas residents travel to UK and UK residents travel to other countries, and where they visited more.
According to the chart of visit to and from UK, UK residents had visited abroad more than overseas residents visited UK. UK residents traveling were increased slightly till 1986, after that, there was a dramatic rise from $ 20 millions to
$ 54 millions till 1999. In contrast, overseas residents were increased gradually in traveling to UK from $ 10 million to $ 28 millions between 1979 and 1999.
From the information shown, we can see that France was the most popular country visited by UK residents, accounting for & dollar; 11 millions. And the others countries visited by UK residents were Turkey, Greece and USA, which were $ 3, $4 and $ 5 millions.
(The response is under-length<138 words>. The candidate reports the key information in the first graph i.e. that visits to and from UK increased and that the increase in visits from UK was more maked than that of visits to the country. In the bar chart the information is also reported accurately. However, the references to &dollar are confusing, suggesting that the candidate has not fully understood across the information given.
There is a brief introduction to the topic, with an attempt to paraphrase the rubric; the overall structure of the writing is clear, with some use of basic discourse markers. There is very little use of reference, however, resulting in a considerable amount of repetition of key vocabulary.
There is a fairly narrow range of sentence types and errors occur in verb formation and in the use of tenses.)
C6-TEST1
The graph and table below give information about water use worldwide and water consumption in two different countries.
Summarise the information by selecting and reporting the main features, and make comparisons where relevant.
(a very good answer)
The graph shows how the amount of water used worldwide changed between 1900 and 2000.
Throughout the century, the largest quantity of water was used for agricultural purpose, and this increased dramatically from about 500 km3 to around 3,000 km3 in the year 2000. Water used in the industrial and domestic sectors also increased, but consumption was minimal until mid-century. From 1950 onwards, industrial use grew steadly to just over 1,000 km3, while domestic use rose more slowly to only 300 km3, both far below the levels of consumption by agriculture.
The table illustrates the differences in agricultural consumption in some areas of the world by contrasting the amount of irrigated land in Brazil (26,500 km2) with that in the D.R.C. (100 km2). This means that a huge amount of water is used in agriculture in Brazil, and this is reflected in the figures for water consumption per person: 359 m3 compared with only 8 m3 in the Congo. With a population of 176 million, the figures for Brazil indicate how high agricultural water consumption can be in some countries.
C4-TEST2
The graph below shows the demand for electricity in England during typical days in winter and summer. The pie chart shows how electricity is used in an average English home.
Summarise the information by selecting and reporting the main features, and make comparisons where relevant.
(6 score)
The use of electricity in England is indispensed with demand for electricity in England during typical days in winter and summer is illustrated in the graph. The use of electricity in an average English home is shown in the pie chart. From the graph, it is generally obvious that the demand is in its maximum around 2100, and in its minimum around 400, being almost constant between 1200 and 2100 in winter times. During summer times, on the other hand, the demand reaches its top points around 1300, and the bottom point around 900, being almost constant between 1550 and 2000.
In winter times, the curve gradually increases to reach 40,000 units of electricity by 3 o’clock in the morning. This is followed by gradual decline to its lowest limite of 30,000 units at 9 o’clock. A gradual rise is obvious again to reach a stationary level between 3 o’clock and 9 o’clock of about 40,000 units again. Then, there is a sharp rise in the next hour to rech its maximum before collapsing again to a lower level by the end of the day.
In summer time, the curve gradually decrease to reach its lower limit around 9 o’clock of a bit more than 10,000 units. A gradual increase is noticed to reach its top of 20,000 after which a stationary phase is obvious between 3 o’clock and 10 o’clock at night of about 15,000 units.
The pie chart, on the other hand, shows that 52.5% of the electricity is used for heating rooms and water. 17.5% is consumed for ovens, kettles and washing machines, 15% is used in lighting, TV and radio, and finally 15% is consumed in the sue of vacuum cleaners, food mixtures and electric tools.
(The answer focuses too closely on the details in the graph but fails to compare trends or general differences between figures for winter and summer. Some comparisons are made, but these are about details, and it is difficult to get a clear idea of the information from this description.
Similarly, information in the pie chart is simply listed using the language from the chart and there is no attempt to relate this to information in the graph.
The description is not well organized, although a range of linkers are used, and the use of paragraphs does not reflect the different sections of information covered.
There is a suitable range of vocabulary for this task, although some words are misused and there are several spelling errors. The range and control of grammatical structure is the strong point of the main part of this response. There are examples of complex structures that are used with accuracy and some flexibility.)
柱图bar chart
C3-TEST 2
The chart below shows the amount spent on six consumer goods in four European countries.
Write a report for a university lecturer, describing the information shown below.
(a very good answer)
The chart shows that Britain, among the four European countries listed, has spent most heavily on the range of consumer goods included. In every case, British spending is considerably higher than that of other countries; only in the case of tennis racquets does another country, Italy, come close.
In contrast, Germany is generally the lowest spender. This is most evident in the photographic film, where Germany spends much less than Britain. Germany only spends more than another country, France, in two cases: tennis racquets and perfumes.
Meanwhile, France and Italy generally maintain middle positions, averaging approximately similar spending overall. Specifically, France spends more on CDs and photographic film but less on tennis racquets than Italy does. Italy’s spending on personal stereos is only marginally greater than that of France, while spending on toys is equal between the two.
It is clear from the data given that there are some significant differences in spending habits within Europe.
C3-TEST 3
The charts below show the levels of participation in education and science in developing and industrialized countries in 1980 and 1990.
(a very good answer)
Write a report for a university lecturer, describing the information shown below.
The data shows the differences between developing and industrialized countries participation in education and science.
In terms of the number of years of schooling received, we see that length of time people spend at school in industrialized countries was much greater at 8.5 years in 1980, compared to 2.5 years in developing countries. The gap was increased further in 1990 when the figures rose to 10.5 years and 3.5 years respectively.
We can see a similar pattern in the second graph, which shows that the number of people working as scientists and technicians in industrialized countries increased from 55 to 85 per 1,000 people between 1980 and 1990, while the number in developing countries went from 12 to 20.
Finally, the figures for spending on research and development show that industrialized countries more than doubled their spending, from $200bn to $420bn, whereas developing countries actually decreased theirs, from $75bn down to $25bn.
Overall we can see that not only are there very large differences between the two
economies but that these gaps are widening.
C4-TEST 3
The chart below shows the different levels of post-school qualifications in Australia and the proportion of men and women who held them in 1999.
Summarise the information by selecting and reporting the main features, and make comparisons where relevant.
(a very good answer)
The chart gives information about post-school qualifications in terms of the different levels of further education reached by men and women in Australia in 1999.
We can see immediately that there were substantial differences in the proportion of men and women at different levels. The biggest gender difference is at the lowest post-school level, where 90% of those who held a skiiled vocational diploa were men, compared with only 10% of women. By contrast, more women held undergraduate diplomas (70%) and marginally more women reached degree level (55%).
At the higher levels of education, men with postgraduate diplomas clearly outnumbered their female counterparts (70% and 30%, respectively), and also constituted 60% of Master’s graduates.
Thus we can see that more men than women hold qualifications at the lower and higher levels of education, while more women reach undergraduate diploma level than men. The gender difference is smallest at the level of Bachelor’s degree, however.
C5-TEST 2
The chart below shows the main reasons for study among students of different age froups and the amount of support they received from employers.
Summarise the information by selecting and reporting the main features, and make comparisons where relevant.
(8 score)
The first graph shows that there is a gradual decrease in study for career reasons with age. Nearly 80% of students under 26 years, study for their career. This percentage gradually declines by 10-20% every decade. Only 40% of 40-49 yr olds and 18% of over 49yr olds are studying for career reasons in late adulthood.
Conversely, the first graph also shows that study stemming from interest increases with age. There are only 10% of under 26yr olds studying out of interest. The percentage increases slowly till the beginning of the fourth decade, and increases dramatically in late adulthood. Nearly some number of 40-49yr olds study for career and interest. However 70% of over 49yr olds study for interest in comparison to 18% studying for career reasons in that age group.
The second graph shows that employer support is maximum (approximately 60%) for the under 26yr students. It drops rapidly to 32% up to the third decade of life, and then increases in late adulthood up to about 44%. It is unclear whether employer support is only for career-focused study, but the highest level is for those students who mainly study for career purposes.
C6-TEST 4
The charts below give information about USA marriage and divorce rates between 1970 and 2000, and the marital status of adult Americans in two of the years. Summarise the information by selecting and reporting the main features, and make comparisons where relevant.
We are given two charts which show us a few sets of data about the marital status of the Americans between 1970 and 2000.
The first chart compares the number of marriages and divorces in the United States of America between 1970 and 2000. We can see that data is given for each decade; the number of people who are getting married decreased slightly since 1980, as well as the divorces one. Nevertheless, divorces increased between 1970 and 1980.
The second chart is more precise about the different marital status of the Americans between 1970 and 2000. The number of divorced people has risen more than the double during this two years, and the data for the never married people has also increased significantly. However, less and less people are married, as the first chart showed us; the widowed American number is also decreasing.
As a conclusion, we can say that the marital status background of the American has maybe known the greatest change it had ever seen.
(The Task Achievement is the weak point in this answer. Some of the data is summarized but the points are not well-selected to convey the key trends shown in the charts. The main features of the first chart are not adequately presented and the overall conclusion does not summarise the main information. No figures are given to illustrate the points made.
The information is well-organised, however, with clear paragraphing and well-signalled sections. The accurate use of a range of sequencers and other linkers makes it easy to follow the writing. There are examples of errors but they are not frequent and do not cause confusion.
A range of vocabulary is used with flexibility, in spite of some inappropriate collocations and awkward phrasing. Structures are varied and generally accurate, while any mistakes do not make the message unclear. )
The chart below shows information about changes in average house prices in five different cities between 1990 and 2002 compared with the average house prices in 1989.
Summarise the information by selecting and reporting the main features, and make comparisons where relevant.
(6.5 score )
The chart gives information about the percentage change in average house prices in five different cities located in five different countries over 12 year period between 1990 and 2002 compared with the average house prices in 1989.
According to the chart, during the period from 1990 to 1995 the average prices of houses in three cities decreased significantly by five percent in New York (USA) and about 7.5 percent in both Tokyo (Japan) and London (UK). While the average house prices increased slightly in two cities Madrid (Spain) and Frankfurt (Germany) by about 1.5 percent and 2 percent respectively.
As far as the next period (1996-2002) is concerned, it is clear that the average house prices decreased only in Tokyo (Japan) by 5 percent. In contrast the average house prices increased in the rest of cities. In New York it increased considerably by 5 percent, in Madrid it increased slightly by 4 percent, in Frankfurt it increased by 2 percent.
London has the largest increase in the average house price over the 6-year period from 1996 to 2002 as it increased dramatically by 11 percent.
All in all, there are wide differences in house prices between the five cities which illustrated in this chart. These differences may be a result of the number of population or number of houses required in a certain city.
(This answer clearly present and illustrates the key points of the information. The writer groups the data effectively and draws clear comparisons, although these could be more appropriately extended in the overview. Information is well organized across the response and a range of linking devices is used.
The opening paragraph, however, is an inadequate paraphrase of language given in the task, and although there are some appropriate collocations in the response, overall the range of vocabulary is rather restricted. Control is good, however, with few examples of error.
A variety of structures is used with some fluency. There are occasional errors in punctuation and there are also some omissions and errors in grammar, but these tend to be minor and do not reduce communication. )
C1-TEST 1
You should spend about 20 minutes on this task.
The charts below show the results of a survey of adult education. The first chart shows the reasons why adults decide to study. The pie chart shows how people think the costs of adult education should be shared.
Write a report for a university lecturer, describing the information shown below.
You should write at least 150 words.
The chart shows that high income earners consumed considerably more fast foods
雅思写作-小作文范文-柱状图
雅思经典小作文柱状图4篇范文+写作要点分析 C1T3 题目 The chart below shows the amount of money per week spent on fast foods in Britain. The graph shows the trends in consumption of fast foods. Write a report a university lecturer describing the information shown below. The chart shows that high income earners consumed considerably more fast foods than the other income groups, spending more than twice as much on hamburgers (43 pence per person per week) than on fish and chips or pizza (both under 20 pence). Average income earners also favored hamburgers, spending 33 pence per person per week, followed by fish and chips at 24 pence, then pizza at 11 pence. Low income earners appear to spend less than other income groups on fast foods, though fish and chip remains their most popular fast food, followed by
雅思写作大作文范文
雅思写作大作文范文 在英文写作中,逻辑关系至关重要。所以在实际教学中我们都会把逻辑关系作为一个很重要的内容来教授。这些逻辑关系主要涉及:并列或递进关系、让步或转折关系、因果关系和举例等。其中举例论证是一种很常用的论证方式,因为举例论证运用具体实例来论证观点,所以更具信服力,也更易于读者理解,因此受到作者及读者的普遍欢迎。下面专家将通过它的连接方式与您共同探讨一下举例论证以及如何举例子。 一、外显连接 如:it is undeniable that mobile phones have facilitated our lives in many different ways. For example, when an emergency ours, such as a traffic aident or a violent crime, mobile phones can help the victims to call the police or an ambulance immediately for help. 本例中,for example 引出例子论证“mobile phones have facilitated our lives in many different ways.”而后面的such as 则引出emergency 的具体形式。For instance 与它的用法完全相同,即后面要接句子例证。 Like, such as, take…as 等
直接名词(或相当于名词的词)。由于这些都是基本常识,这里不再赘述。 为了使连接词多样化,建议考生运用下面的一些短语(或句式)连接论点和论据:…is a case in point; …serve as a typical example;…can be taken as an example; one example is that… another one is that等。 如:Working part time when you are studying in university is beneficial to your life. I myself is a case in point(or ‘my experiences serve as a typical example’). Through those experiences, I have learned to be independent and responsible. 二、内化连接 实际上,大家看原汁原味的文英文文章会发现有些信息的连接不用外显式,而是通过某些特定的词或者特定的方式给读者以清晰的层次感,从而使文章信息传递更通畅。 下面我们来看一下哪些例证可以省去连接词,实现内化连接。
2019年雅思写作小作文流程图解析及范文:废纸回收
2019年雅思写作小作文流程图解析及范文:废纸回收 The chart below shows the process of waste paper recycling. 范文: The flow chart shows how waste paper is recycled. It is clear that there are six distinct stages in this process, from the initial collection of waste paper to the eventual production of usable paper. At the first stage in the paper recycling process, waste paper is collected either from paper banks, where members of the public leave their used paper, or directly from businesses. This paper is then sorted by hand and separated according to its grade, with any paper that is not suitable for recycling being removed. Next, the graded paper is transported to a paper mill. Stages four and five of the process both involve cleaning. The paper is cleaned and pulped, and foreign objects such as staples are taken out. Following this, all remnants of ink and glue are removed from the paper at the de-inking stage. Finally, the pulp can be processed in a paper making machine, which makes the end product: usable paper. (160 words, band 9)
雅思写作小作文范文118篇之范文14
雅思写作小作文范文118篇之范文14 以下是三立在线雅思网给大家分享的雅思写作小作文范文118篇:范文14。希望对大家的雅思备考有所帮助,更多雅思备考资料欢迎大家随时关注三立在线雅思网。 范文14 The computer is widely used in education,and some people think teachers do not play important roles in the classroom. To what extend do you agree or disagree? In this period of communication,computer has been used in all kinds of fields widely, and plays a particular role in our lives. Especially computer has become more and more important in educational field, therefore dozens of people considered teachers could be replaced computers that will go with the current of the times. The above point is certainly wrong; this essay will outline three reasons. The main reason is that people’s brain better than computer. Firstly, people design all kinds of computer’s programs. Secondly, computer doesn’t have logistic ideation. Computer only can defend on that designer inputted computer’s programs to judge a question’s right or wrong. In other words, computer can’t defend on thinking that computer independently analyzes a question’s right or wrong. In case, designer inputted programs that are wrong. Computer output the result that also will be wrong. If this kind of problem happened in classroom, students would be infused plenty of wrong information.
雅思写作考试大作文范文多版本汇总
2016年4月30日雅思写作考试大作文范文多版本汇总 4月30日雅思写作大作文考得是shopping habits (购物习惯)与agegroup(年龄段)之间的关系。也就是说,人们的购物习惯到底是由什么决定的?是年龄决定的,还是其他因素决定的?原题观点是:人的购物习惯更多是由年龄决定的。你也许同意这个观点,然后提出原因,给出例证;你也许不同意这个观点,那么你就得提出并论证什么因素决定了人们的购物习惯。一起来看看关于这个话题,各机构的范文都是怎么写的吧! >>>4月雅思考试真题写作范文全汇总(多版本+语料),速速查看 Task:生活类题材 People’s shopping habits depend more on the age group they belong to than any other factor. To what extent do you agree or disagree? 和其他任何因素比起来,人们的购物习惯更多的取决于他们所在的年龄层,你在多大程度上同意或不同意? Sample answers(点击标题查看) 1. 雅思哥版(260 words) 2016年4月30日雅思写作真题大作文参考范文(1) 核心观点句: Some people think that age is the main factor that affects people’s shopping habits but I think this is only true in some cases. 一些人认为年龄是影响人们消费习惯的主要因素,但我认为这仅仅在某些情况下上是正确的. 2. 新东方版(294 words) 2016年4月30日雅思写作真题大作文参考范文(2) 核心观点句: I tend to hold the view that age group is one of the many effects imposed on how people consume. 我倾向于认为,年龄层是对影响人们如何消费的众多因素之一。
雅思大作文写作范文精选
雅思大作文写作范文精选 多看,多练,多积累,写作能力才会提高,今天和同学们来分享一下雅思大作文范文,希望能够帮助到大家,下面就和大家分享,来欣赏一下吧。 雅思大作文写作范文——大学是否应该同时进行行为习惯的教育? 题目: Some people think schools should teach students to form good behavior in addition to providing formal education. To what extent do you agree or disagree? 大学是否应该在教授知识的同时进行行为习惯的教育? 范文: It is often argued that teachers should be accountable for their student’s good and bad conducts as they are responsible for teaching them the morality of their children. Others, on the other hand, opi ne that educators’ role should be limited to imparting academic (educational) curriculum among students. This essay will discuss both points of view and argue that instructors can share the
responsibility for inculcating socially acceptable manners in students along with academic course training, followed by a reasoned conclusion. 人们常说,教师应该对学生的好与坏行为负责,因为他们有责任教导他们的孩子的道德。另一方面,另一些人则认为教育者的角色应该局限于向学生传授学术(教育)课程。这篇*将讨论这两种观点,并认为教师可以分担责任,在进行学术课程培训的同时,向学生灌输社会可接受的礼仪,然后得出一个合理的结论。 Many support the teacher’s role in students’ behaviour modification. Firstly they think that students spend much more time with their educators in school than with their parents. So it is easy for the trainers to develop a good interpersonal relationship with students and, thereby, can have a great influence on their trainees. In addition, they can give moral lessons through moral classes. Moreover, most of the students find their teachers as their role model. So the students accept the instructions of their professors’ than anyone else. 许多人支持教师在学生行为矫正中的作用。首先,他们认为学生在学校花更多的时间和老师在一起,而不是和父母在一起。因此,培训师很容易与学生建立良好的人际关系,从而对他们的学员产生很大的影响。此外,他们可以通过道德课进行道德教育。
雅思写作小作文练习_翻译
1. 该表格描述了在...年之...年间...数量的变化。 2. 该柱状图展示了... 3. 该图为我们提供了有关...有趣数据。 4. 该图向我们展示了... 5. 该线形图揭示了... 6. 这个曲线图描述了...的趋势。 7. 数据(字)表明... 8. 该树型图向我们揭示了如何... 9. 该数据(字)可以这样理解... 10. 这些数据资料令我们得出结论... 11. 如图所示... 12. 根据这些表(数字)... 13. 如表格所示... 14. 从图中可以看出,...发生了巨大变化。 15. 从图表我们可以很清楚(明显)看到... 16. 这个图表向我们展示了... 17. 该表格描述了...年到...年间a与b的比例关系。 18. 该图描述了...总的趋势。 19. 这是个柱型图,描述了...
20. 如图所示,两条曲线描述了...的波动情况。 21. 在...至...期间,...基本不变。 22. 在...年到...的期间 23. 1995年至1998三年里... 24. 从那时起... 25. ...月(年)至...月(年)...的数量基本不变。 26. 数字急剧上升至... 27. ...至...期间...的比率维持不变。 28. ...的数目在...月(年)达到顶点,为... 29. 比率维持在... 30. ...的比例比...的比例略高(低)。 31. ...与...的区别不大。 32. 该图表表明...的数目增长了三倍。 33. ...逐年减少,而...逐步上升。 34. ...的情况(局势)到达顶(高)点,为...百分点。 35. 数字(情况)在...达到底部。 36. 数字(情况)达到底部(低谷)。 37. a是b的...倍。 38. a增长了...
2016雅思小作文真题汇总
2016年1月9日雅思写作真题之雅思小作文TASK1 男女同学在课外参加体育运动的时常比例。 difference in the percentage of sports in outdoor school hours TASK1 日雅思写作真题之雅思小作文1月142016年The number of people taking part in a wildlife survey in Britain between 2001 and 2009. TASK1
日雅思写作真题之雅思小作文月年2016123The three pie charts below show the production, consumption of coffee and where the profit goes around the world. )数据仅供参考( 2016年1月30日雅思写作真题之雅思小作文TASK1 Task 1 The diagram shows how an office building looks at
present and the plan for its future development. TASK1 月年2016218日雅思写作真题之雅思小作文 Changes of average monthly salary and prices of black and white TV in Japanese Yen from 1953 to 1973 TASK1日雅思写作真题之雅思小作文2月20年2016
The chart and graph show the categories of workforce in Australia and the unemployment within 3 groups. 2016年2月27日雅思写作真题之雅思小作文TASK1 Task 1 The graph below shows the unemployment rate in Ireland and the number of people leaving the country between 1998 and 2008. TASK1
作文范文之雅思小作文table
作文范文之雅思小作文table
雅思小作文table 【篇一:雅思小作文表格图实例分析】 雅思小作文表格图实例分析 朗阁海外考试研究中心 表格图是雅思小作文的常考图形之一,也是烤鸭们在备考时必须要准备的一类题型。那么烤鸭们具体应该如何准备表格图呢?下面,朗阁海外考试研究中心的专家将以一道具体的实例,就这一题型的解题思路和步骤做出详尽的分析和解答。 the table below shows personal savings as a percentage of personal income for selected countries in 1989, 1999 and 2009. personal savings as a percentage of personal income 一、审题,决定大体写作方式 首先,读题目,了解到这幅表格图是关于“几个国家的人民个人收入中存款的百分比”以及三个时间点(据此,正文部分描述存款率是时态基调为过去时)。表格上方的title和题目表述一样,没有额外信息,因此,读一遍即可。 然后,审具体表格,决定大致写作方向和方式,即分段方式。表格的审图需要注意以下几个方面:横轴,纵轴和总体数据特征。此图中的横纵轴分别是时间和7个研究对象——7个国 家。横纵轴中间有一栏为时间,那说明,此图原则上应该按曲线图原理来写——即,描述7个国家存款率上升或下降趋势;但是,经过下一步对表格中数据总体特征的总结发现:7个国家的存款率在这一段时间内总体呈现下降趋势。这一发现说明,如果继续按照曲线图原理描述,文章会非常单调,而且对比的空间也不大;相反,同一年份里,
2018年雅思写作大作文范文之为什么要上大学
2018年雅思写作大作文范文之为什么要上大学 今天三立在线教育雅思网为大家带来的是2018年雅思写作大作文范文之为什么要上大学的相关资讯,备考的烤鸭们,赶紧来看看吧! 这里为大家收集整理了雅思写作大作文参考范文:为什么要上大学。希望能对大家备考雅思写作考试有帮助。 People attend college or university for many different reasons (for example, new experiences, career preparation, increased knowledge). Why do you think people attend college or university? Model Answer 1: People attend college for a lot of different reasons. I believe that the three most common reasons are to prepare for a career, to have new experiences, and to increase their knowledge of themselves and of the world around them. Career preparation is probably the primary reason that people attend college. These days, the job market is very competitive. Careers such as information technology will need many new workers in the near future. At college, students can learn new skills for these careers and increase their opportunities for the future. Students also go to college to have new experiences. For many, it is their first time away from home. At college, they can meet new people from many different places. They can see what life is like in a different city. They can learn
雅思小作文写作教学提纲
雅思小作文写作
Writing Notes Date: July, 9th, 2017 Task I 1.Three Types i.Data: Bar Chart, Line Graph, Table, Pie Chart ◆图表类型:动态图、静态图 ◆动态图:有两个或以上时间 ◆重点 ●趋势 ●特殊值:起点、重点、最高点、最低点、交叉点 ◆静态图:只有一个或者没有时间 ●比较描述对象:使用倍数、比较级 ii.Process: Flow Chart iii.Map ◆Describe the change ◆Eg: Hospital is located to the west of car park 2.评分标准 i.Task Achievement/ Task Response ◆Cover the Requirements of the task ◆No off topics ◆不能添加主观想法,只能描述 ii.Coherence and Cohesive ◆使用路标性词汇:顺承和转折 iii.Lexical Resource ◆使用非高频词汇 ◆Use words and phrases naturally and appropriately ◆Vocabulary diversity ◆Accurate spelling words iv.Grammatical Range and Accuracy ◆Accurate grammar of sentences ◆Use different ranges of sentences, structures to achiever grammatical 3.写作方法 i.开头段 ◆图表词改写 ●The chart : bar chart, line chart, pie chart, table, diagram ◆动词shows改写 ●注意时态 ●Shows: illustrates, gives information about, compares, indicates, demonstrates ◆关键词(一定要改写) ●数量改写 ?The number of + 可数 ?The amount of + 不可数 ?The quantity of + 可/不可数 ?The figure for +可/不可数 ●百分比改写
雅思小作文模板句必备50句型+
雅思小作文模板句必备50句型 A 1.the table shows the changes in the number of...over the period from...to... 该表格描述了在...年之...年间...数量的变化。 2.the bar chart illustrates that... 该柱状图展示了... 3.the graph provides some interesting data regarding... 该图为我们提供了有关...有趣数据。 4.the diagram shows (that)... 该图向我们展示了... 5.the pie graph depicts (that).... 该圆形图揭示了... 6.this is a cure graph which describes the trend of... 这个曲线图描述了...的趋势。 7.the figures/statistics show (that)... 数据(字)表明... 8.the tree diagram reveals how... 该树型图向我们揭示了如何... 9.the data/statistics show (that)... 该数据(字)可以这样理解... 10.the data/statistics/figures lead us to the conclusion that... 这些数据资料令我们得出结论... 11.as is shown/demonstrated/exhibited in the diagram/graph/chart/table... 如图所示... 12.according to the chart/figures... 根据这些表(数字)... 13.as is shown in the table... 如表格所示... 14.as can be seen from the diagram, great changes have taken place in... 从图中可以看出,...发生了巨大变化。 15.from the table/chart/diagram/figure, we can see clearly that...or it is clear/apparent from the chart that... 从图表我们可以很清楚(明显)看到... 16.this is a graph which illustrates... 这个图表向我们展示了... 17.this table shows the changing proportion of a & b from...to... 该表格描述了...年到...年间a与b的比例关系。 18.the graph, presented in a pie chart, shows the general trend in... 该图以圆形图形式描述了...总的趋势。 19.this is a column chart showing... 这是个柱型图,描述了...
雅思写作大作文范文 雅思写作报告类 大型公司large businesses.doc
雅思写作大作文范文雅思写作报告类大型公司large businesses 今天我们雅思写作大作文范文的文章来研究下大型公司的问题。这些大型公司和跨国企业通常在广告与市场营销方面投入大量的资金,并抢占市场。这会挤占本土品牌的生存空间,并可能导致其彻底消失。那么这一现象会有那些后果,我们又能采取什么措施来抑制这一现象的发生呢?小编搜集了一篇相关的高分范文,以供大家参考。 雅思写作大作文题目 Large businesses have big budgets for marketing and promotion and, as a result, people gravitate towards buying their products. What problems does this cause? What could be done to encourage people to buy local products? 大型公司在市场营销和促销方面拥有极高的预算。因此,人们倾向于购买它们的产品。这会导致什么问题?我们能做些什么来鼓励人们购买本土的产品呢? 雅思写作大作文范文 Large businesses and international brands spend an enormous amount of money on marketing and advertising. Consequently, people tend to watch those advertisements all the time while small local businesses fail to reach their customers. This can lead to some serious problems, such as the closure of local businesses and the monopoly in business. Other than that, people could be easily trapped by large businesses. There are a few steps that can be adopted to address this issue and motivate people to buy local products. 大型公司和国际品牌在市场营销与广告上花费大量的资金。结果人们总是看这些广告,而当地的小型企业没有办法接触到顾客。这可能导致一些严重的问题,比如当地企业的倒闭和某些行业的垄断。除此之外,人们容易被大型企业所牵绊。可以采用一些措施来解决这一问题,并动员人们购买当地的产品。 Naturally, people prefer to buy products that were consciously or unconsciously publicized to their mind and thus many local businesses, even with their quality products, cannot attract consumers. This article is from Laokaoya website. The dominance of international brands and large businesses will destroy the market for locally made products and thus would make thousands of people unemployed. Moreover, large markets do their very best to attract public attention to their products and advertising is one of the best tools they have. Sensitive, creative and deceptive advertisements and marketing policies often make the people believe that they need these products. This would create a monopoly in the market and people would often be deceived. Thus consumers would be trapped by the large businesses and would have no alternatives for them but to buy products of some particular brands. 很自然地,人们更加喜欢购买那些有意识或者无意识推广到他们脑子里的产品。因此,
2011雅思小作文 最全万能模板
2011雅思小作文写作万能模板 1、通过第一个曲线图,我们可以知道____,也说明了结果是___ According to the first graph, it can be seen that ______________, it can also be concluded from it that ______________. 2、一张有趣、有教育意义的、(内容)的图片(这句模板在雅思小作文中的应用非常的广泛。) There is an interesting and instructive picture which goes like this: __________. 3、当前有一张涉及______的增长曲线图,许多人______,然而其他人倾向于___ Nowadays there is a growing concern over ______________. Many people like ______________, while others are inclined to ______________. 4、目前,共同之处是_________,许多人喜欢______因为_______除此之外还由于_____ Nowadays, it is common to ______________. Many people like______________ because ______________. Besides, ______________. 5、(图表所示)_____,就像许多其他事物,被____更加喜爱,然而这一观点正被________所抨击,一些人认为_________,他们指出___________ ______________, just like many other things, are preferred by ____________. While being attacked by the idea that ______________, some people consider ______________. They point that ______________. 6、每种事物都有两面性和________,是没有异议的,包括利和弊 Everything has two sides and ______________ is not an exception, it has both advantages and disadvantages. 7、_____作为_____被观察了许多年,但是人们现在像发现新大陆一样注视着它 For years ______________ had been viewed as ______________. But people are taking a fresh look at it now. 8、政府保证________,对于这份保证,大多数人做出了强烈地回应,因为_____ It has stipulated by the government that ______________. To this stipulation, many people respond actively because ______________. 9、_______出现在我们日常生活中是很平常的,无论我们做什么,_______都是不可避免的______________ is a common occurrence in our daily life. Whatever we do, ______________ can't be avoided. 10、_____在人群中已经成为热门话题,特别是在年轻人中,激烈的争论无休止______________ has become a hot topic among people, especially among the young, and heated debates are right on their way. 1 according to the chart```
2017雅思A类写作大作文真题范文
2017雅思A类写作大作文真题范文 1.07 教育类 Task:Art classes, like painting and drawing, are not as important as other subjects, so some people think that it should not be a compulsory subject at high school. To what extent do you agree or disagree? Schools are places where students acquire knowledge and skills needed for further achievements. Given the pressure that students are facing, some cannot help wondering whether art classes should still be compulsory. Those holding the view that art classes should not be compulsory might think that art consumes too much of students' time. Fierce competitions students will face when applying for universities necessitate total devotion to academic subjects. College students who intend to take science as their major are even expected to be fluent in foreign languages now so that essays written by foreign scholars are not barriers in their academic pursuit. In other words, high school students are supposed to show higher levels of academic competence,which seemingly makes art unessential. However, art classes are by no means only intended for entertainment. Children even dabbling in art tend to be more creative in mind. Those skilled in music or painting can interpret the world in a way that we cannot expect from a layman. This kind of ingenuity is also a rare quality constantly found in great scientists, whose contributions have served to create a totally new field for the latter generations. In his reply to a question about death, Albert Einstein considered his departure from the mortal world to be forever farewell to another great musician. With a sigh he answered "I cannot listen to Mozart anymore". Thus, can we simply regard art classes to be selective?