Macro_Practice_problems

1. Define opportunity cost. What is the opportunity cost to you of attending college? What was your
opportunity cost of coming to class today?
2. Explain the following statement: "There is no such thing as a free lunch".
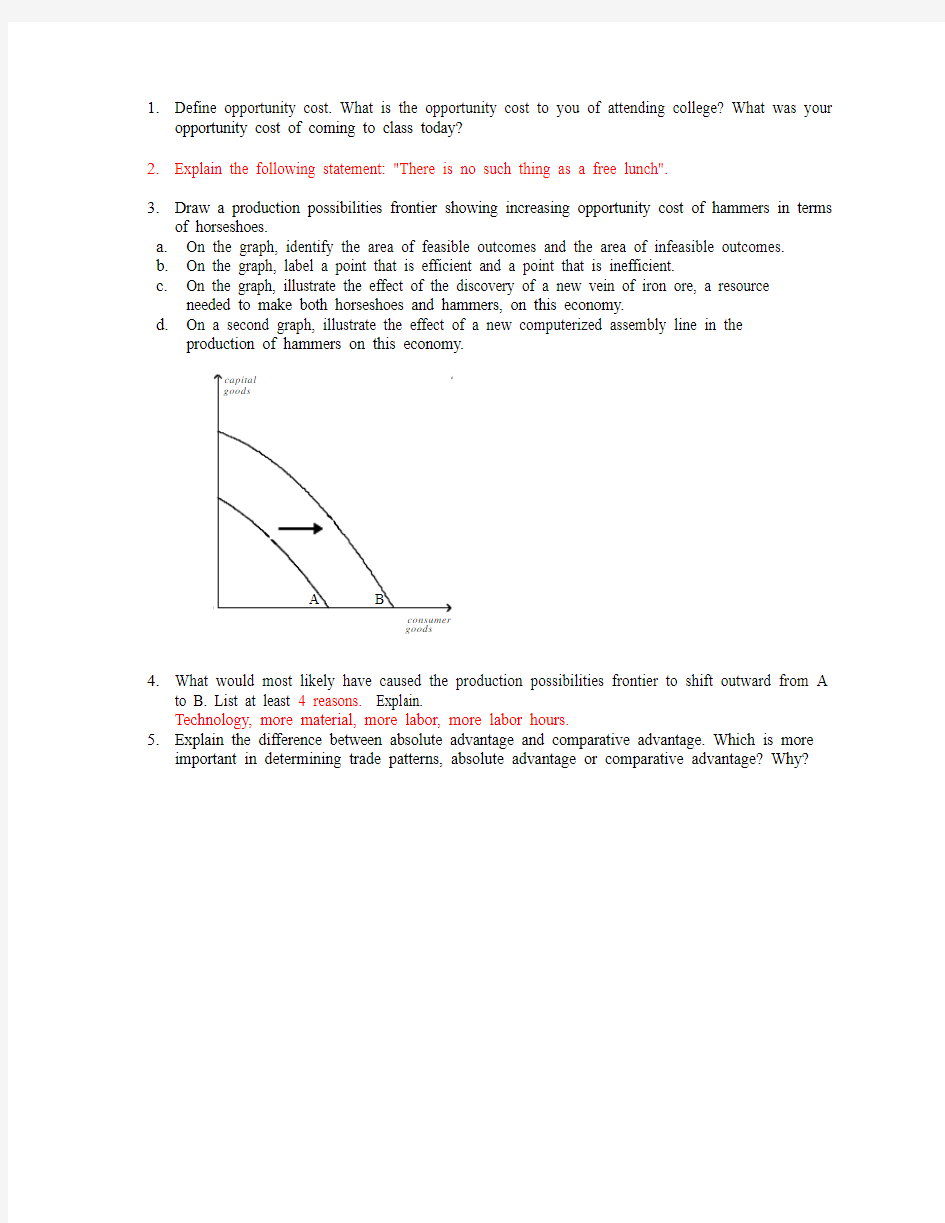
3. Draw a production possibilities frontier showing increasing opportunity cost of hammers in terms
of horseshoes.
a. On the graph, identify the area of feasible outcomes and the area of infeasible outcomes.
b. On the graph, label a point that is efficient and a point that is inefficient.
c. On the graph, illustrate the effect of the discovery of a new vein of iron ore, a resource
needed to make both horseshoes and hammers, on this economy.
d. On a second graph, illustrate the effect of a new computerized assembly line in the
production of hammers on this economy.
4. What would most likely have caused the production possibilities frontier to shift outward from A
to B. List at least 4 reasons. Explain.
Technology, more material, more labor, more labor hours.
5. Explain the difference between absolute advantage and comparative advantage. Which is more
important in determining trade patterns, absolute advantage or comparative advantage? Why?
goods
goods
A B
consumer capital
6.Julia can fix a meal in 1 hour, and her opportunity cost of one hour is $50. Jacque can fix the
same kind of meal in 2 hours, and his opportunity cost of one hour is $20. Will both Julia and Jacque be better off if she pays him $45 per meal to fix her meals? Explain.
7.Gary and Diane must prepare a presentation for their marketing class. As part of their
presentation, they must do a series of calculations and prepare 50 PowerPoint slides. It would take Gary 10 hours to do the required calculation and 10 hours to prepare the slides. It would take Diane 12 hours to do the calculations and 20 hours to prepare the slides.
a.How much time would it take the two to complete the project if they divide the calculations
equally and the slides equally?
b.How much time would it take the two to complete the project if they use comparative
advantage and specialize in calculating or preparing slides?
c.If Diane and Gary have the same opportunity cost of $5 per hour, is there a better solution than
for each to specialize in calculating or preparing slides?
8.Fill in the table below, showing whether equilibrium price and equilibrium quantity go up, go
down, stay the same, or change ambiguously.
9.Suppose we are analyzing the market for hot chocolate. Graphically illustrate the impact each of
the following would have on demand or supply. Also show how equilibrium price and
equilibrium quantity would change.
a.Winter starts and the weather turns sharply colder.
b.The price of tea, a substitute for hot chocolate, falls.
c.The price of cocoa beans decreases.
d.The price of whipped cream falls.
e. A better method of harvesting cocoa beans is introduced.
f.The Surgeon General of the U.S. announces that hot chocolate cures acne.
g.Protesting farmers dump millions of gallons of milk, causing the price of milk to rise.
h.Consumer income falls because of a recession, and hot chocolate is considered a normal
good.
i.Producers expect the price of hot chocolate to increase next month.
j.Currently, the price of hot chocolate is $0.50 per cup above equilibrium.
10.Consider the following pairs of goods. For which of the two goods would you expect the demand
to be more price elastic? Why?
a.water or diamonds
b.insulin or nasal decongestant spray
c.food in general or breakfast cereal
d.gasoline over the course of a week or gasoline over the course of a year
e.personal computers or IBM personal computers
https://www.360docs.net/doc/3c3025595.html,e the graph shown to answer the following questions. Put the correct letter(s) in the blank.
a.The elastic section of the graph is represented by section from __a to b_____.
b.The inelastic section of the graph is represented by section from __a to c_____.
c.The unit elastic section of the graph is represented by section __B_____.
d.The portion of the graph in which a decrease in price would cause total revenue to fall
would be from ______b to c___.
e.The portion of the graph in which a decrease in price would cause total revenue to rise
would be from ___a to b______.
f.The portion of the graph in which a decrease in price would not cause a change in total
revenue would be _____b____.
g.The section of the graph in which total revenue would be at a maximum would be
___b____.
h.The section of the graph in which elasticity is greater than 1 is _______.
i.The section of the graph in which elasticity is equal to 1 is ______.
j.The section of the graph in which elasticity is less than 1 is _______.
12.When the Shaffers had a monthly income of $4,000, they usually ate out 8 times a month. Now
that the couple makes $4,500 a month, they eat out 10 times a month. Compute the couple's income elasticity of demand using the midpoint method. Explain your answer. (Is a restaurant meal a normal or inferior good to the couple?)
https://www.360docs.net/doc/3c3025595.html,ing a supply and demand diagram, show a labor market with a binding minimum wage. Use
the diagram to show those who are helped by the minimum wage and those who are hurt by the minimum wage.
https://www.360docs.net/doc/3c3025595.html,ing the graph shown, answer the following questions.
a.What was the equilibrium price in this market before the tax?
b.What is the amount of the tax?
c.How much of the tax will the buyers pay?
d.How much of the tax will the sellers pay?
e. How much will the buyer pay for the product after the tax is imposed?
f. How much will the seller receive after the tax is imposed?
g. As a result of the tax, what has happened to the level of market activity?
15. Tammy loves donuts. The table shown reflects the value Tammy places on each donut she eats:
a. Use this information to construct Tammy's demand curve for donuts.
b. If the price of donuts is $0.20, how many donuts will Tammy buy?
c. Show Tammy's consumer surplus on your graph. How much consumer surplus would
she have at a price of $0.20?
d. If the price of donuts rose to $0.40, how many donuts would she purchase now? What
would happen to Tammy's consumer surplus? Show this change on your graph.
16. Suppose that instead of a supply-demand diagram, you are given the following information:
Q s = 100 + 3P Q d = 400 - 2P
From this information compute equilibrium price and quantity. Now suppose that a tax is placed on buyers so that
Q d = 400 - (2P + T ).
If T = 15, solve for the new equilibrium price and quantity. (Note: P is the price received by sellers and P + T is the price paid by buyers.) Compare these answers for equilibrium price and quantity with your first answers. What does this show you?
17.
Use the graph to answer the following questions about CDs.
10
20
30
40
50
60
70
80
1
2345678910
a.What is the equilibrium price of CDs before trade?
b.What is the equilibrium quantity of CDs before trade?
c.What is the price of CDs after trade is allowed?
d.What is the quantity of CDs exported after trade is allowed?
e.What is the amount of consumer surplus before trade?
f.What is the amount of consumer surplus after trade?
g.What is the amount of producer surplus before trade?
h.What is the amount of producer surplus after trade?
i.What is the amount of total surplus before trade?
j.What is the amount of total surplus after trade?
k.What is the change in total surplus because of trade?
18.Answer the following questions based on the table. A consumer is able to consume the following
bundles of rice and beans when the price of rice is $2 and the price of beans is $3.
RICE BEANS
120
64
08
a.How much is this consumer's income?
b.Draw a budget constraint given this information. Label it B.
c.Construct a new budget constraint showing the change if the price of rice falls $1. Label this C.
d.Given the original prices for rice ($2) and beans ($3), construct a new budget constraint if this
consumer's income increased to $48. Label this D.
19.
Assume that a consumer faces the following budget constraints.
a.Assuming that income is the same on both occasions, describe the difference in relative
prices between Panel A and Panel B.
b.If income in Panel B is $126, what is the price of good X?
c.If income in Panel A is $84, what is the price of good Y?
d.Assuming that the price of good X is the same on both occasions, describe the
difference in income and price of good Y between Panel A and Panel B.
20. Using the graph shown, construct a demand curve for M&M's given an income of $10.
Answers:
ANS:
Whatever must be given up to obtain some item it its opportunity cost. Basically, this would be a person's second choice. The opportunity cost of a person attending college is the value of the best alternative use of that person's time, as well as the additional costs the person incurs by making the choice to attend college. For most students this would be the income the student gives up by not working plus the cost of tuition and books, and any other costs they incur by attending college that they would not incur if they chose not to attend college. A student's opportunity cost of coming to class was the value of the best opportunity the student gave up. (For most students, that seems to be sleep.)
ANS:
Absolute advantage refers to productivity, as in the producer who can produce a product at a
lower cost in terms of the resources used in production. Comparative advantage refers to the
producer who can produce a product at a lower opportunity cost. Comparative advantage is the
principle upon which trade patterns are based. Comparative advantage is based on opportunity
cost, and opportunity cost measures the real cost to an individual or country of producing a
particular product. Opportunity cost is therefore the information necessary for an individual or
nation to determine whether to produce a good or buy it from someone else.
ANS:
Since Julia's opportunity cost of preparing a meal is $50, and Jacque's opportunity cost of
preparing a meal is $40, each of them will be better off by $5 per meal if this arrangement is
made.
ANS:
a. If both tasks are divided equally, it will take 11 hours for the calculations and 15 hours
for the writing, for a total of 26 hours.
b. If Diane specializes in calculating and Gary specializes in preparing slides, it will take
22 hours to complete the project.
c. If Diane specializes in calculating, her opportunity cost will be $60; hence, Diane
would be better off if she paid Gary any amount less than $60 to do the calculating.
Since Gary's opportunity cost of doing the calculations is only $50, he would be better
off if Diane paid him between $50 and $60 dollars to do the calculations. In this case,
the total time spent on the project would be 20 hours.
ANS:
(a)
(b)
(c)
(d)
(e)
(f)
(g) (h)
D D'S Pe'Pe
Qe Qe'quantity
price
D'D S
Pe Pe'
Qe'Qe
quantity
price
D
S'S Pe'
Pe Qe Qe'quantity
price
D
D'S
Pe'
Pe
Qe Qe'
quantity
price
D
S'S Pe'
Pe Qe Qe'quantity
price
D
D'S
Pe'
Pe
Qe Qe'
quantity
price
(i)
(j)
ANS:
a. Diamonds are luxuries, and water is a necessity. Therefore, diamonds have the more elastic
demand.
b. Insulin has no close substitutes, but decongestant spray does. Therefore, nasal decongestant
spray has the more elastic demand.
c. Breakfast cereal has more substitutes than does food in general. Therefore, breakfast cereal has
the more elastic demand.
d. The longer the time period, the more elastic demand is. Therefore, gasoline over the course of a
year has the more elastic demand.
e. There are more substitutes for IBM personal computers than there are for personal computers.
Therefore, IBM personal computers have the more elastic demand.
ANS:
a. A to B
b. B to C
c. B
d. B to C
e. A to B
f. B
g. B
D
S S'Pe
Pe'Qe'Qe quantity
price D'
D S
Pe
Pe'
Qe'Qe
quantity
price
D
S S'Pe
Pe'Qe'Qe quantity
price
D
S
Pe
Pe+Qd Qe $0.50Qs
Surplus
quantity
price
h. A to B
i.B
j. B to C
ANS:
The income elasticity of demand for the Shaffers is 1.89. Since the income elasticity of demand is positive, eating out would be interpreted as a normal good.
ANS:
Those who are helped by the minimum wage are the workers who are still employed and now receive the higher wage. In the diagram, those would be measured by the quantity of labor demanded at the minimum wage, q0. The minimum wage creates unemployment equal to the difference between the quantity of labor supplied and the quantity demanded at the minimum wage, q2-q0. The perceptive student might note that the unemployed group can be divided into those who lose their jobs as a result of the minimum wage (the competitive equilibrium quantity of labor minus the quantity demanded at the minimum wage, q1-q0), and those who enter the market as a result of the higher wage but cannot find employment (quantity of labor supplied at the minimum wage minus the competitive equilibrium quantity, q2-q1). The buyers of the labor (employers) are also worse off because they have to pay a higher wage for labor and, hence, hire a smaller quantity.
ANS:
a. $6
b. $4
c. $1
d. $3
e. $7
f. $3
g. As a result of the tax, the level of market activity has fallen, from 60 units bought and sold to only 50 units bought and sold.
ANS:
a.
b. At a price of $0.20, Tammy would buy 5 donuts.
c. The figure below shows Tammy's consumer surplus. At a price of $0.20, Tammy's
consumer surplus would be $1.00.
d. If the price of donuts rose to $0.40, Tammy's consumer surplus would fall to $0.30 and
she would purchase only 3 donuts.
1
2
3
4
5
6
7
8
0.1
0.20.30.40.50.60.70.80.91
1
2
3
4
5
6
7
8
0.1
0.20.30.40.50.60.70.80.91
ANS:
Prior to the tax, the equilibrium price would be $60 and the equilibrium quantity would be 280. After the tax is imposed, P , the price received by sellers would be $57. The price paid by buyers would be $72. The quantity sold would be 271. The new answer shows three obvious facts. First, buyers pay more with a tax. Second, sellers receive less with a tax. Third, the size of the market shrinks when a tax is imposed on a product.
1
2
3
4
5
6
7
8
0.1
0.20.30.40.50.60.70.80.91
ANS:
a.$12
b.50
c.$15
d.30
e.$250
f.$122.50
g.$250
h.$422.50
i.$500
j.$545
k.$45
ANS:
a.$24
b.
c.
d.
ANS:
a.The price of good Y is relatively higher in Panel A than Panel B. Said another way, the
price of X is relatively lower in Panel A than Panel B.
b.$9
c.$12
d.Income in Panel A is twice the income in Panel B, and the price of "Y" in Panel B is
1/18 the price of "Y" in Panel A.
ANS: