3D Visualization of Power System State Estimation
3D Visualization of Power System State Estimation
Bei Xu
Dept.of Electrical Eng. Texas A&M University College Station,Texas Email:xubei@https://www.360docs.net/doc/4f2595262.html,
Cem Y¨u ksel
Dept.of Architecture
Texas A&M University
College Station,Texas
Email:cem@https://www.360docs.net/doc/4f2595262.html,
Ali Abur
Dept.of Electrical Eng.
Texas A&M University
College Station,Texas
Email:abur@https://www.360docs.net/doc/4f2595262.html,
Ergun Akleman
Dept.of Architecture
Texas A&M University
College Station,Texas
Email:ergun@https://www.360docs.net/doc/4f2595262.html,
Abstract—This paper presents the results of a project which is undertaken in order to develop a?exible visualization tool to be used mainly by power system operators.The project concentrated on two application functions,namely the power ?ow and the state estimation.One of the essential goals of the envisioned tool is to aid system operators by providing images of the system with easily identi?able characteristics related to violations of various operating limits.In addition,the tool is expected to illustrate de?ciencies associated with the existing metering system both from the point of view of metering design as well as accuracy.The result is a user-friendly3D graphic interface for the stated two power system applications.In power ?ow analysis mode,animation and bus contouring technique is used for visualizing power?ows and bus voltages.In state estimation mode,color contour is used to visualize different observable islands and bad measurements which are identi?ed through the largest normalized residuals test.Effectiveness of the tool is illustrated via different scenarios which are created using the IEEE118bus system as an example.
Keywords-State Estimation,Power Flow Analysis,Visu-alization of Power System,3D Visualization,Graphic User Interface(GUI)
I.I NTRODUCTION
Power system operators have the dif?cult job of maintaining continuity of service to power customers without violating any operating limits as the operating conditions change during the daily operation.This task requires close monitoring of the system conditions,in particular those which might cause temporary or permanent service interruption,possible damage to power equipment as well as the customers.Furthermore,any inaccuracies in the monitored values will lead to decisions that will affect the power market by producing the wrong signals both for the producers and consumers of electrical energy alike.
Power system operators are challenged by the overwhelming amount of data that are transmitted to the control centers for their use.Transforming data into useful information for decision making requires various tools,one of which is visu-alization.Recent advances in computer software and hardware make it possible to develop highly detailed representation of power systems in a Graphical User Interface(GUI)for this purpose.
Earlier work on this topic showed the effectiveness of providing better communication between massive amounts of data and the user[1],[2],[3],[4],[5].In[6],programs to visualize line?ow and bus data are presented.In[7],bad measurements used in state estimation are displayed in an easily identi?able way.
This paper will describe a?exible software tool which takes advantage of different visualization techniques such as animation,color contouring and3D visualization in order to extract and highlight certain user speci?ed information from the data acquired by the supervisory data acquisition (SCADA)system.Two essential and critical applications in today’s Energy Management Systems(EMS)namely the state estimation and power?ow analysis are used as examples. State estimator can detect and?lter out gross errors in the measurement set and thus provides a reliable database of the system upon which subsequent network functions can be deployed.Power?ow analysis computes steady state voltages of all the buses in the system which is referred as the system state.
The developed program uses3D visualization and animation techniques to interpret system information.This window based interface is an upgraded version of the existing software package,Power Education Toolbox(PET)which is previously developed in Texas A&M University for educational purposes [8].The new interface is developed in C++using FLTK(Fast Light Tool Kit).OpenGL technique is used to create3D visual-ization.The next section presents a description of the program. Different scenarios including unobservable cases with several observable islands,measurement systems containing bad data and operating conditions with heavily loaded buses are created using the IEEE118-bus system.
II.P ROGRAM D ESCRIPTION
The graphical user interface(GUI)contains two windows, an edit window and a view window.Object oriented program-ming(OOP)technique is used to allow the user to interact with the objects,which represents different components in the power system.
In edit window,a one-line diagram of power system is shown in2D.It allows the user to edit and build the power system by adding/moving/deleting buses and lines.View win-dow shows3D visualization of power system.The user can easily pan or zoom in/out in these two windows to locate the point of interest in the system.
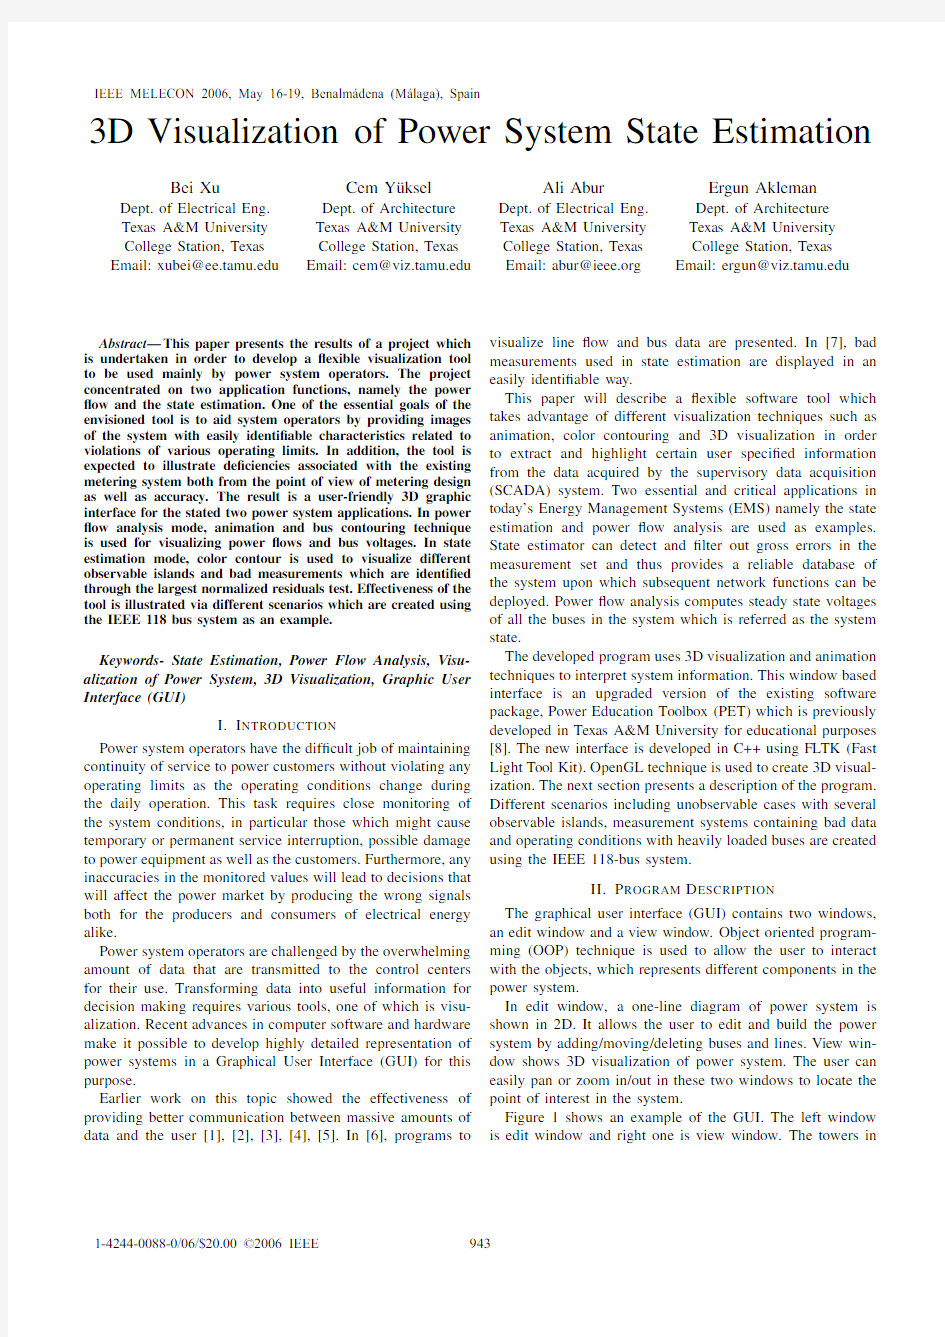
Figure1shows an example of the GUI.The left window is edit window and right one is view window.The towers in
IEEE MELECON 2006, May 16-19, Benalmádena (Málaga), Spain
Fig.1.Graphic User Interface
the scene represent buses in power system while wavy lines represent the transmission lines.In this example,a map of the state of Texas is used to show the geographic information of a real power system.Note that a color map can instead be loaded to show the system information during simulation.Each power system case has two associated data ?les.One ?le speci?es the 3D coordinates of all the buses while the other ?le de?nes power system information by using IEEE common data format.Once a power system case is opened,the system information is read and 2D/3D visualizations are https://www.360docs.net/doc/4f2595262.html,er can use the main menu to choose between options of editing the system or running simulations for applications such as power ?ow analysis and state estimation.
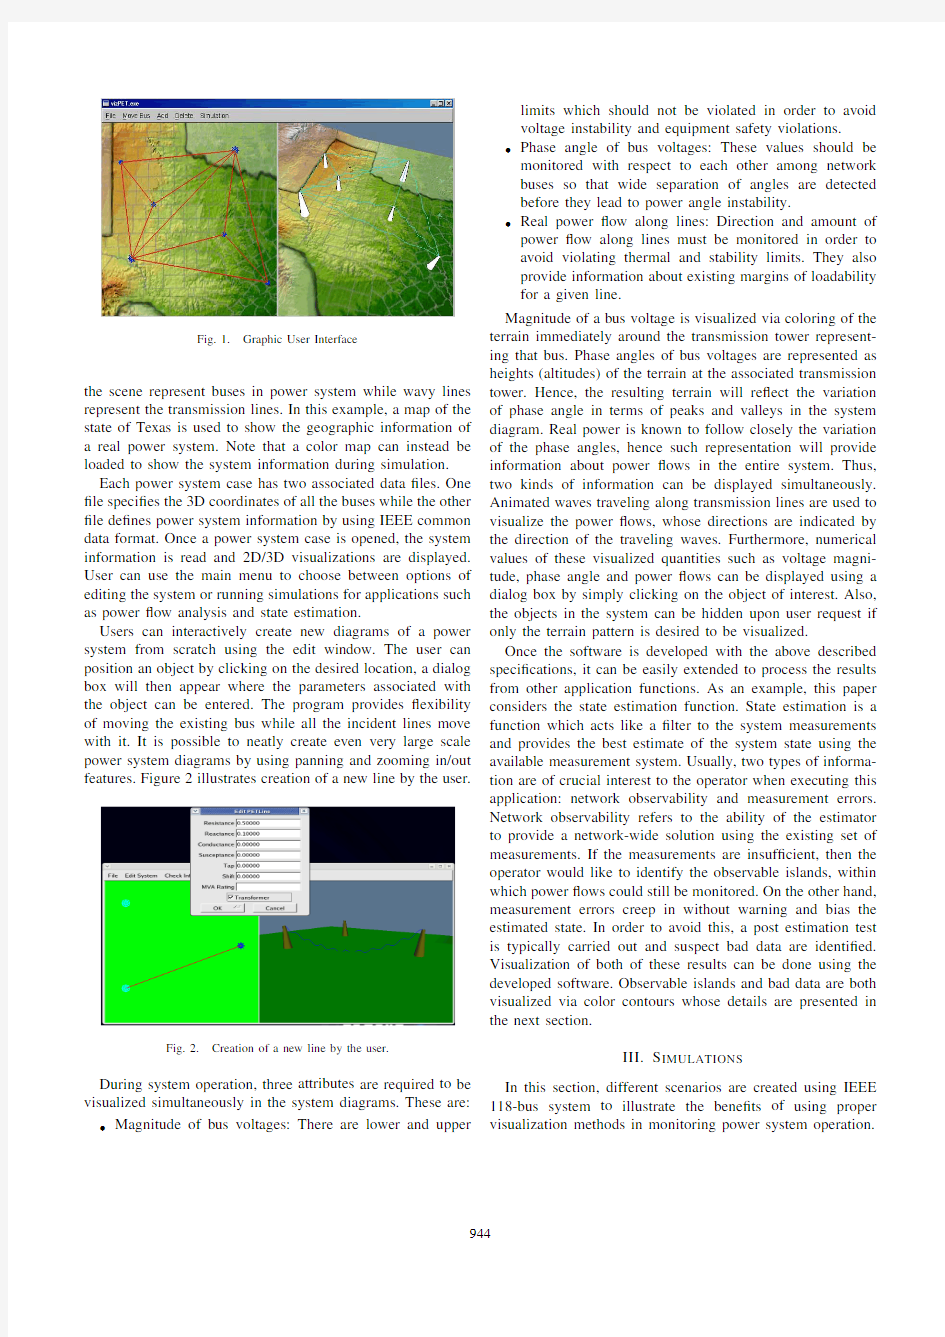
Users can interactively create new diagrams of a power system from scratch using the edit window.The user can position an object by clicking on the desired location,a dialog box will then appear where the parameters associated with the object can be entered.The program provides ?exibility of moving the existing bus while all the incident lines move with it.It is possible to neatly create even very large scale power system diagrams by using panning and zooming in/out features.Figure 2illustrates creation of a new line by the
user.
Fig.2.Creation of a new line by the user.
During system operation,three attributes are required to be visualized simultaneously in the system diagrams.These are:?Magnitude of bus voltages:There are lower and upper
limits which should not be violated in order to avoid voltage instability and equipment safety violations.
?
Phase angle of bus voltages:These values should be monitored with respect to each other among network buses so that wide separation of angles are detected before they lead to power angle instability.
?
Real power ?ow along lines:Direction and amount of power ?ow along lines must be monitored in order to avoid violating thermal and stability limits.They also provide information about existing margins of loadability for a given line.
Magnitude of a bus voltage is visualized via coloring of the terrain immediately around the transmission tower represent-ing that bus.Phase angles of bus voltages are represented as heights (altitudes)of the terrain at the associated transmission tower.Hence,the resulting terrain will re?ect the variation of phase angle in terms of peaks and valleys in the system diagram.Real power is known to follow closely the variation of the phase angles,hence such representation will provide information about power ?ows in the entire system.Thus,two kinds of information can be displayed simultaneously.Animated waves traveling along transmission lines are used to visualize the power ?ows,whose directions are indicated by the direction of the traveling waves.Furthermore,numerical values of these visualized quantities such as voltage magni-tude,phase angle and power ?ows can be displayed using a dialog box by simply clicking on the object of interest.Also,the objects in the system can be hidden upon user request if only the terrain pattern is desired to be visualized.
Once the software is developed with the above described speci?cations,it can be easily extended to process the results from other application functions.As an example,this paper considers the state estimation function.State estimation is a function which acts like a ?lter to the system measurements and provides the best estimate of the system state using the available measurement https://www.360docs.net/doc/4f2595262.html,ually,two types of informa-tion are of crucial interest to the operator when executing this application:network observability and measurement https://www.360docs.net/doc/4f2595262.html,work observability refers to the ability of the estimator to provide a network-wide solution using the existing set of measurements.If the measurements are insuf?cient,then the operator would like to identify the observable islands,within which power ?ows could still be monitored.On the other hand,measurement errors creep in without warning and bias the estimated state.In order to avoid this,a post estimation test is typically carried out and suspect bad data are identi?ed.Visualization of both of these results can be done using the developed software.Observable islands and bad data are both visualized via color contours whose details are presented in the next section.
III.S IMULATIONS
In this section,different scenarios are created using IEEE 118-bus system to illustrate the bene?ts of using proper visualization methods in monitoring power system operation.
A.Observability analysis
State estimator can identify observable islands and label the branches that connect these islands as unobservable branches by analyzing the existing measurements set.
A method referred to as color contouring is used to visualize different observable islands.This is done as follows:
Each observable island and all buses that belong to that island are assigned an island number.Note that a bus can be assigned one and only one island number since islands can not overlap.Then,each and every vertex of the grid that de?nes the terrain is assigned a unique color ID according to the island number of its nearest bus.Hence,a map representing observable islands can be created by color mapping.In the resulting map,all unobservable branches are colored in red and observable branches in blue.This will allow the operator to quickly identify the islands as well as candidate locations where additional meters can be placed to merge these islands.Figure 3shows the observability analysis of IEEE 118-bus system,where three observable islands can easily be identi?ed.The unobservable branches are shown in red
color.
Fig.3.
Observable Islands in the IEEE 118-bus System
B.Bad data detection /Identi?cation
It is customary to perform post-estimation tests to detect and identify bad data in the measurement set.Success of these tests in detecting and identifying bad data depends among other factors on the measurement redundancy.A commonly used test is the largest normalized residual test where the normalized residual of each measurement is calculated and the largest one is identi?ed as bad data provided it exceeds a statistical threshold.In order to quickly determine the region that is most affected by the identi?ed bad data,a color contour is used.This contour is created as described below.
Every system bus is assigned a value which is determined as the largest normalized residual among all measurements measured at that bus.Bus injections are measured at the associated buses and ?ows are measured at their sending-end bus.In order to create a spatially continuous contour,a virtual value is assigned to each and every vertex in the terrain.The virtual value is calculated in such a way that the vertex related to a bus is assigned the value of that bus speci?ed as described
above.All other terrain vertices which are not related to a bus are assigned average values based on the already assigned values to their closest vertices.This way,a color map can be created by one mapping using blue color for the lower values and red color for higher values.
The advantage of color contour method is obvious.For a large scaled power system,in which the measurements may not be visible when showing the entire system map,the user can easily identify the red region in the color map and then locate the bad measurement by panning and zooming into the identi?ed suspect area.
Figure 4shows bad data analysis results of IEEE 118-bus system.A red area which indicates existence of bad data in the system can easily be noticed.Figure 5shows a close-up view of the suspected area.The ?ow measurement in red is identi?ed as bad data and the dialog box shows the numerical results from the bad data test associated with this speci?c
measurement.
Fig.4.
Bad Data in the IEEE 118-bus
System
Fig.5.Detailed numerical results of bad data test
C.Power ?ow analysis
Power ?ow analysis calculates the state variables in the system,which are voltage magnitudes and phase angles for all the buses in the entire power system.Two kinds of visualization methods are used to visualize these two kinds of bus-related data.Color contouring is used voltage magnitude
while the varying height of the underneath terrain represents the phase angles.
Color map ranges from red to blue,which represents higher voltage and lower voltage.The color map provides an overview of voltage pro?le of entire power system and helps the user to identify voltage violations at a glance.Note that real power is more related to phase angles,it typically ?ows from the bus having relatively high phase angle to the bus with a smaller phase angle.So,the mountain shaped terrain provides the user a quick overview of the distribution of real power ?ows in the power system:real power ?ows from the higher tower to the lower tower along the transmission lines.This is analogous to water ?ow in a similar terrain with water pipes.Animation is also used to represent the direction and amount of the line ?ows.Direction of the traveling wave matches the direction of the real power ?ow in the transmission line.Numerical values for bus voltages and line ?ows can be easily recovered via a dialog box by simply clicking on the object.Figure 6shows the 3D visualization of estimated state variables for IEEE 1118-bus system.The operator can con-veniently focus on the red area which indicates a voltage violation.Further clicking on the bus produces a dialog box as shown in Figure 7displaying the numerical values associated with this
bus.
Fig.6.Power Flow Analysis of IEEE 118-bus
System
Fig.7.Detailed Bus Information
IV.C ONCLUSIONS
This paper describes a software package which is developed as an aid to the system operator.It contains a user-friendly GUI which allows the user to construct the system diagram for a new power system or to edit an existing one for desired modi?cations.3D animation and color contouring techniques are used to visualize the results of two application functions,namely the state estimation and power system analysis.Exam-ples of different cases are created to illustrate the performance of the developed software.
A CKNOWLEDGMENT
This work was supported in part by the NSF grant ESC-0300071.
R EFERENCES
[1]P.M.Mahadev,R.D.Christie,Minimizing User Interaction in Energy
Management Systems:Task Adaptive Visualization ,IEEE Transactions on Power Systems,V ol.11,No.3,pp.1607-1612,August 1996.
[2]P.R.D’Amour,W.R.Block,Modern User Interface Revolutionizes Su-pervisory Systems ,IEEE Computer Applications in Power,pp.34-39,January 1994.
[3]G.P.de Azevedo,C.D.de Souza,B.Feijo,Enhancing the Human-Computer Interface of Power System Applications ,IEEE Transactions on Power Systems,V ol.11,No.2,pp.646-653,May 1996.
[4]T.J.Overbye,P.W.Sauer,C.M.Marzinzik and G.Gross,A User-Friendly
Simulation Program for Teaching Power System Operations ,IEEE Trans-actions on Power Systems.V ol.10,No.4,November 1995.
[5]T.J.Overbye,G.Gross,https://www.360docs.net/doc/4f2595262.html,ufenberg and P.W.Sauer,Visualizing
Power System Operations in the Restructured Enviroment ,IEEE Com-puter Applications in Power,pp.53-58,January 1997.
[6]T.J.Overbye,D.A.Wiegmann,A.M.Rich and Y .Sun,Human factors as-pects of power system voltage contour visualizations ,IEEE Transactions on Power Systems,February 2003,pp.76-82,
[7] A.P.Sakis Meliopoulos,G.J.Cokkinides,M.Ingram,S.Bell and
S.Mathews,Visualization and Animation of State Estimation Perfor-mance ,38th Annual Hawaii International Conference on Systems Science,January 2005.
[8] A.Abur,F.H.Magnago and Y .Lu,Educational Toolbox for Power System
Analysis ,IEEE Computer Applications in Power,V ol.13,No.4,October 2000,pp.31-35
Bei Xu (S’04)received her B.S.and M.S.degrees from Shanghai Jiaotong University,China in 1998and 2001respectively.She is currently a Ph.D.student at the Department of Electrical Engineering at Texas A&M University,College Station,Texas.
Cem Y¨uksel received his B.S.degree in Physics and M.S.degree
in Computer Engineering from Bogazici ¨Universitesi,Turkey in 2000
and 2003respectively.He is currently a graduate student at Texas A&M University,College Station,Texas.
Ali Abur (F’03)received his B.S.degree from Ortado?g u Teknik ¨Universitesi,Turkey in 1979,M.S.and Ph.D.degrees from The Ohio State University,Columbus,Ohio,in 1981and 1985respectively.He joined and worked as a Professor at the Department of Electrical Engineering at Texas A&M University,College Station,Texas until 2005.Since November 2005he serves as Professor and Chair of the Electrical and Computer Engineering Department,Northeastern University,Boston,MA.
Ergun Akleman received his B.S.degree from ˙Istanbul Teknik ¨Universitesi,Turkey in 1981,M.S.and Ph.D.degrees from Georgia
Institute of Technology,Georgia,in1986and1992respectively.He is currently an Associate Professor at the Department of Architecture, Visualization Laboratory at Texas A&M University,College Station, Texas.
感受现代科技
感受现代科技 【学习目标】 1、知识:感受现代科技给人类生活带来的新变化,认识科技与生活,科技发展与社会发展的关系,懂得“科学技术是第一生产力”的道理。 2、能力与情感:感悟现代科技的神奇与力量,理解科技是社会发展的强大推力,激发学生 对科技重要性的认识,增强学生对科学的兴趣,培养学生热爱科学的精神。 3、过程与方法:依据教学内容和学生的认识规律设置了“课前预习”、“课堂助学”、“课堂巩固”、“课后拓学”、“教学反思”五个模块的教学整合,运用多媒体等教学手段,采用自主体验、 探究活动、案例情境等方法来完成教学目标。 【学习重点、难点】 领略现代科技的神奇与力量,理解“科技是第一生产力”。 【学习过程】 一、预习初探: (一)快快行动,书外的知识真有趣: 1、生活体验:观察生活,请你说说我们身边有哪些科技产品?例举实例说说这些科技产品给我们的生活带来哪些新变化? 2、想象天地:展现你的想象天份,想象你准备发明一样科技产品,使你的未来生活更美好。 3、图片收集:上网收集有关科技产品的图片,准备创办科技小展览,领略现代科技的神 奇与力量。 (二)阅读课本,书本的知识真寻味: 4、我们现在的生活与科技________________。丰足的衣食,舒适的住行,千百年来一直是人类_________________。 5、科学技术是________________的强大推力,是________生产力。______________已成为当代经济发展的火车头。 6、________________是人类文明的标志。科学技术的进步为人类创造了巨大的 ______________和_________________。
感受现代科技
第十四课感受现代科技 项目一现代科技在身边 教师寄语:今日沟通于昔日之最大差异:在于科技的介入,已超越时间、空间,甚至权利与阶级的围墙。 学习目标: ●情感态度价值观:感受现代科技发展带来的新变化,培养学生热爱科学的情感和品质。 ●能力:培养学生观察、收集、整理、归纳信息的能力。 ●知识:了解科技对社会发展具有推动作用,理解科学技术是第一生产力。 重难点:科技是社会发展的强大推动力 学习过程: 一、课前预习(提前预习课本,顺便做以下小题,相信你能完成!) 1.我们现在的生活与科技_________。 2.___________________是第一生产力。 3._______________已成为当代经济发展的火车头。 4.科学技术是_______________的标志。 5.科技是社会发展的______________。 二、合作探究,共同进步(合作有助于提高学习效率,要努力哦!) 知识点一:现代科技给生活带来新变化 1:(见教材P58页-59页)图片1:液晶彩色电视图片2:利用网络学习 图片3:山里人用上了手机图片4:磁悬浮列车 说一说:观察生活,列举实例,说说现代科技给我们的生活带来哪些新的变化? 2:阅读教材(P59页教材正文),说说现代科技的发展给人类的生活产生了怎样的影响?(学生讨论交流) 。3:(见教材P59页-60页)想象和推测一下,随着科技的发展,5年、10年、20年、50年后人们的生活可能是怎样的? 。 知识点二:科技——社会发展的强大推力 1:(见教材P61页),材料中的数字变化说明了什么?(学生讨论交流) 上述材料中的数字变化说明:“”。 2:为什么说“科学技术是第一生产力”? ① ② 实践证明:高新技术及其产业已经成为当代经济发展的火车头。 3:(见教材P62页)说一说:网络学校的发展将会给人们的学习方式带来了哪些变化? 4、①科学技术的进步使精神文明建设有了新的载体. 说一说:在思想文化传播的载体方面,你知道有哪些新的传播手段呢? ②科学技术的进步丰富了人们的 . 5、科学技术的进步为人类创造了巨大的财富和财富 三、课堂小结 通过学习我学会:
走进都市农业 感受现代科技
走进都市农业感受现代科技 --"大东农业观光园"基地实践活动 设计者:大兴区第九小学窦雪征 指导教师:大兴区教师进修学校柏东河 ( 2008-05-27 13:40:19 ) 一、环境分析 我国是个农业大国。当前,在农业科技领域,中国不断缩小与发达国家的差距,农业科技部门在生物技术、高新技术、基础研究方面均取得较大进展,植物细胞和组织培养、花药培养、单倍体育种及其应用研究处于国际先进地位。但是,作为国家希望的小学生却对我国农业的了解知之甚少,甚至有的学生只认识餐桌上的蔬菜,田地里面的蔬菜就不认识了。而且由于社会环境的影响,学生对于农业生产的认识非常极端,认为农业生产只是辛苦的体力劳动,对其间蕴含的高科技文化知识基本不了解。 大兴区作为北京市的一个远郊区县,拥有着得天独厚的农业教育资源,在我们的身边就有向"大东农业观光园"这样的一个很好的农业教育基地。在大东农业观光园里面充分体现了现代农业。它目前拥有现代化日光温室34个,塑料大棚34个,露地80亩,为观光采摘、实验、示范、生产提供了场所。农业观光园里引进福建有机茶叶树,通过土壤改质能使其在北方正常生长;蔬菜嫁接的试验技术;大棚中的科学技术,如:所有地面具备节能、日光温室跨度大、内设供热、微喷、保湿、补光等多项功能;另外园区内设有科普知识长廊,为学生了解我国农业的历史文化和发展,创造了很好的条件。此基地实践活动适合小学高年级学生,他们可以在基地里面,进行参观、体验、学习了解高科技农业技术。通过基地的实践活动,可以增长学生现代农业知识,提高劳动能力,体验劳作的艰辛,培养学生良好的道德品质。可以很好的促进学生学习方式的变革,使学生直接从事实践性主题活动,实现学生自主学习和直接体验为主的学习方式,从而不