Electronic Phase Diagram of High-T_c Cuprate Superconductors from a Mapping of the In-Plane
a r X i v :c o n d -m a t /0403032v 2 [c o n d -m a t .s u p r -c o n ] 19 N o v 2004
Electronic Phase Diagram of High-T c Cuprate Superconductors from a Mapping of the
In-Plane Resistivity Curvature
Yoichi Ando,?Seiki Komiya,Kouji Segawa,S.Ono,and Y.Kurita
Central Research Institute of Electric Power Industry,Komae,Tokyo 201-8511,Japan.
(Dated:February 2,2008)We propose that Resistivity Curvature Mapping (RCM)based on the in-plane resistivity data is a useful way to objectively draw an electronic phase diagrams of high-T c cuprates,where various crossovers are important.In particular,the pseudogap crossover line can be conveniently deter-mined by RCM.We show experimental phase diagrams obtained by RCM for Bi 2Sr 2?z La z CuO 6+δ,La 2?x Sr x CuO 4,and YBa 2Cu 3O y ,and demonstrate the universal nature of the pseudogap crossover.Intriguingly,the electronic crossover near optimum doping depicted by RCM appears to occur rather abruptly,suggesting that the quantum critical regime,if exists,must be very narrow.
PACS numbers:74.25.Fy,74.25.Dw,74.72.Hs,74.72.Dn,74.72.Bk
Elucidating the electronic phase diagram of high-T c cuprates in the temperature (T )vs doping (p )plane is an important experimental step towards understanding the high-T c superconductivity.When there is a clear phase transition,such as the superconducting transition or the N′e el transition,it is easy to locate the transition line in the T vs p plane.However,when there is a crossover in the electronic properties,it becomes non-trivial to de-?ne the crossover and to locate the crossover line.In the case of cuprates,there is an important crossover line in the phase diagram,that is,the crossover to the pseu-dogap phase within the normal state [1,2];also,there is another putative crossover from a non-Fermi liquid to a Fermi liquid in the overdoped regime [2].Because of the lack of a universal and objective way to determine these crossover lines,the phase diagram of the cuprates has been rather loosely discussed in the past [2,3,4,5]and it is not known to what extent the putative phase diagram is generic.
In this Letter,we propose a novel way to objectively draw the T vs p phase diagram based on the in-plane resistivity (ρab )data.We call this new method “Resis-tivity Curvature Mapping”(RCM),because the curva-ture (second derivative)of the ρab (T )data is mapped onto the T vs p plane,graphically showing how the behavior of ρab changes as a function of temperature and doping re?ecting the changes in the underlying electronic phase.The actual phase diagrams obtained by RCM are presented for three hole-doped cuprates,Bi 2Sr 2?z La z CuO 6+δ(BSLCO),La 2?x Sr x CuO 4(LSCO),and YBa 2Cu 3O y (YBCO),in all of which the hole dop-ing can be widely changed from underdoped to over-doped regimes.The phase diagrams of the three systems demonstrate that the pseudogap crossover line,which can be conveniently determined by RCM,shows a linear dop-ing dependence (in the superconducting doping regime)and is terminated near optimum doping.Furthermore,our data demonstrate that the well-known “T -linear”re-sistivity is observed in a very limited region of the phase diagram near optimum doping,which suggests that the quantum-critical non-Fermi-liquid regime [2],if exists,must be much narrower than is often conjectured [2,6].The single crystals of BSLCO,LSCO,and YBCO are grown by a ?oating-zone technique [7],a traveling-solvent ?oating-zone technique [8],and a ?ux method [9],respectively.For BSLCO,we ?rst determined the actual La content,z ,of representative samples by the inductively-coupled plasma atomic-emission spec-troscopy (ICP-AES)and established a relationship be-tween z and the c -axis lattice constant c 0;we then mea-sure c 0of all the samples to determine actual z .Since the relation between z and p (hole doping per Cu)has been sorted out in our previous study [10],here we show just the p values for our BSLCO samples for simplicity.In the case of LSCO,one can safely assume that the p value is equal to x (Sr content),as long as the sam-ples are carefully annealed to remove excess oxygen or oxygen vacancies,which is what we always do for our LSCO crystals [8].On the other hand,it is di?cult to determine the exact hole doping p in the CuO 2planes of YBCO [11],so here we just show the oxygen content y ,which is measured by iodometry and is the control pa-rameter of the doping.We have established a technique to reliably and reproducibly anneal the YBCO crystals to tune y to a target value [9];we always quench the sam-ple to room temperature at the end of the annealing to avoid the long-range oxygen ordering phenomena,which often complicate the physics of YBCO [12].Our previous study indicated that the hole doping p changes smoothly with y (without showing a plateau near y ~6.6)in our quenched samples [9,11].All the YBCO samples are un-twinned crystals and the a -axis resistivity ρa is measured to avoid direct contributions from the CuO chains,which run along the b -axis.The resistivity is measured with a standard ac four-probe technique [13].
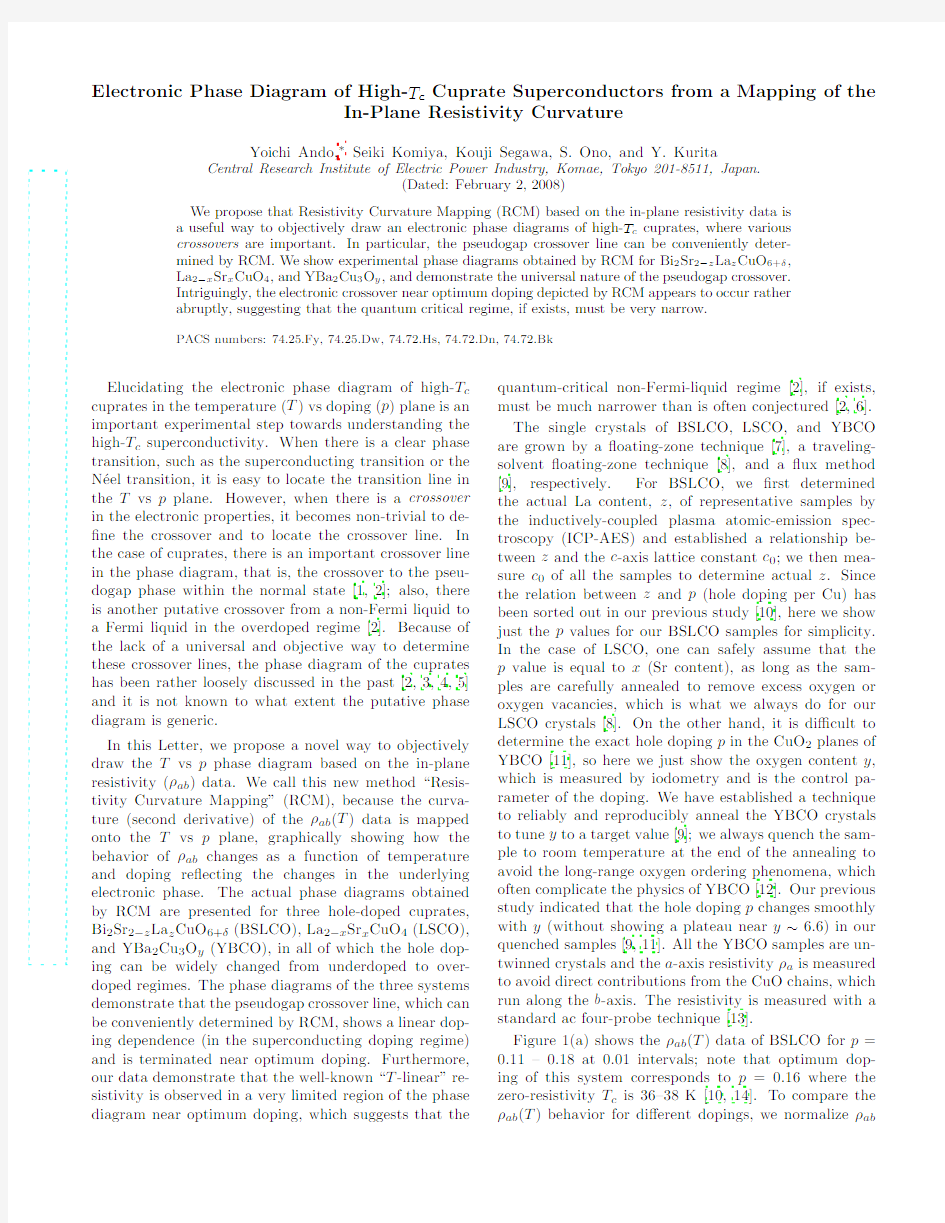
Figure 1(a)shows the ρab (T )data of BSLCO for p =0.11–0.18at 0.01intervals;note that optimum dop-ing of this system corresponds to p =0.16where the zero-resistivity T c is 36–38K [10,14].To compare the ρab (T )behavior for di?erent dopings,we normalize ρab
2
T e m p e r a t u r e (K )
0.18
0.16
0.14
0.12
p (Hole doping per Cu)
ρa b ( m ?c m )
FIG.1:(a)ρab (T )data of BSLCO for p =0.11–0.18at 0.01intervals;the data for underdoped (overdoped)samples are shown in blue (red),while that for optimum doping is shown in green.(b)Resistivity curvature mapping,namely,a false
color mapping of d 2ρn ab /dT 2
in the T vs p plane,for BSLCO.The solid green circles show T c ’s for the measured composi-tions.
by its 300-K value to obtain ρn ab [=ρab /ρab (300K)].By
calculating the second derivative of ρn ab (T ),d 2ρn ab /dT 2
,for each doping (wherein we employ modest numerical smoothing [15])and linearly interpolating the results,we
can draw a false color mapping of d 2ρn ab /dT 2
in the T vs p plane as shown in Fig.1(b),where the red (blue)color corresponds to positive (negative)curvature,while the white color means that the curvature is essentially zero.Note that when ρab (T )changes linearly with T ,the curvature of ρab (T )is zero;thus,the vertical white band apparent in Fig.1(b)at p ?0.16means that the T -linear resistivity is observed there.Furthermore,the vertical red region in Fig.1(b)for p 0.17graphically demonstrates that as soon as BSLCO is overdoped the ρab (T )behavior loses the T -linearity;actually,we have shown [16]that ρab (T )of the overdoped BSLCO samples are well ?tted with ~T αwith α>1.
More importantly,Fig.1(b)also depicts the e?ect of the pseudogap opening in underdoped samples:It is known [16,17]that the pseudogap tends to cause ρab (T )to show an “S-shape”behavior,which has been inter-preted to be due to a rapid reduction in the inelastic scattering rate of the electrons in the pseudogap phase
upon lowering temperature [17].Although it was recently proposed [18]that this S-shape may better be viewed in terms of a gradual participation of the quasiparticles near (π,0)of the Brillouin zone with increasing temperature,in any case the partial destruction of the Fermi surface [19]is responsible for the peculiar ρab (T )behavior in the pseudogap phase.If one accepts the S-shape to be a sig-nature of the pseudogap in the dc transport,then there is a unique and unambiguous temperature which char-acterize the S-shape,that is,the in?ection point.It is thus natural to consider the in?ection point in the ρab (T )curve as a “characteristic temperature”of the pseudo-gap,T pg ,though it may not denote the “onset”of the pseudogap.In our RCM the in?ection point shows up in white,so the diagonal white band that vertically sepa-rates the blue and red regions in the underdoped regime (p <0.16)signi?es how the characteristic temperature for the pseudogap crossover changes with doping.It is intriguing to see that the pseudogap boundary signi?ed by T pg changes essentially linearly with doping and is terminated near optimum doping.
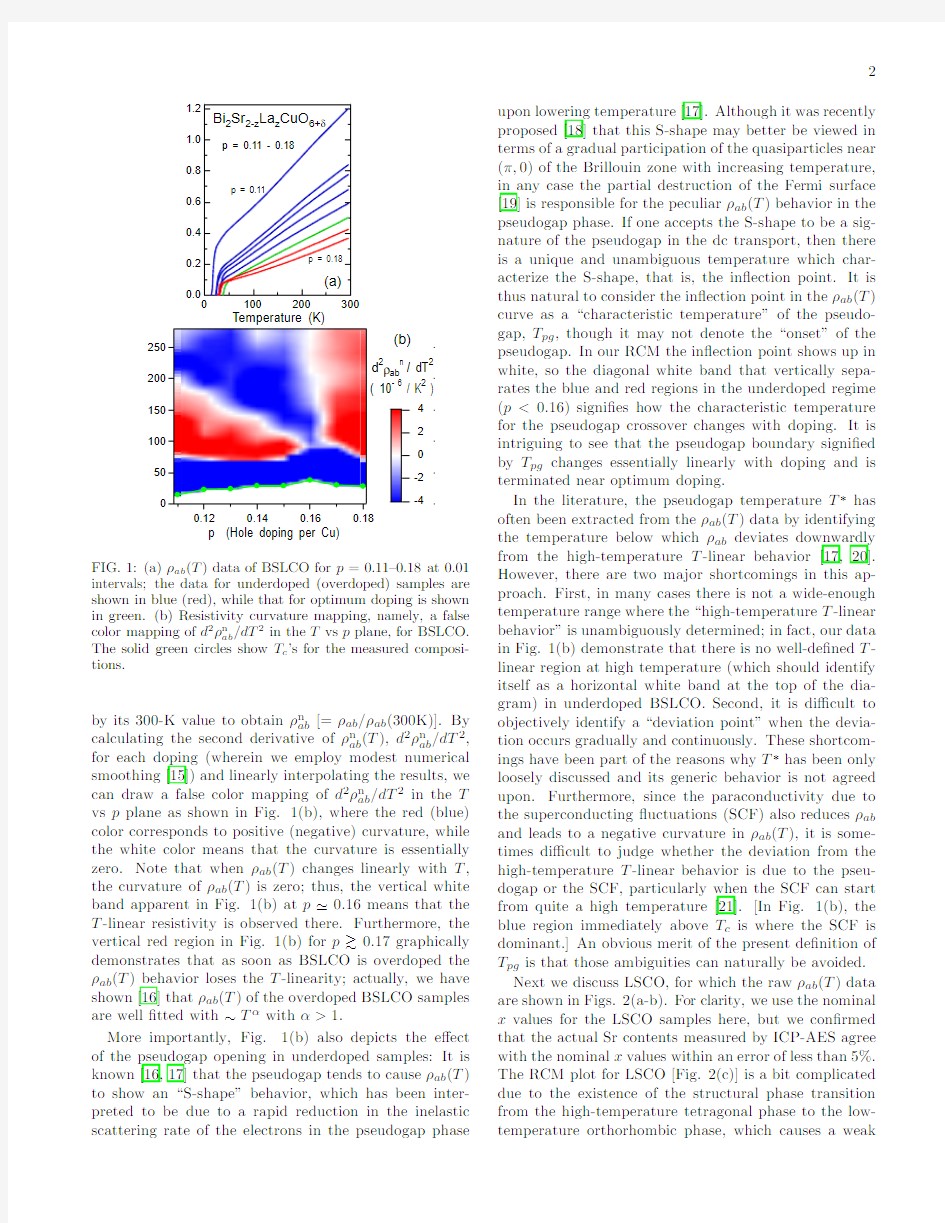
In the literature,the pseudogap temperature T ?has often been extracted from the ρab (T )data by identifying the temperature below which ρab deviates downwardly from the high-temperature T -linear behavior [17,20].However,there are two major shortcomings in this ap-proach.First,in many cases there is not a wide-enough temperature range where the “high-temperature T -linear behavior”is unambiguously determined;in fact,our data in Fig.1(b)demonstrate that there is no well-de?ned T -linear region at high temperature (which should identify itself as a horizontal white band at the top of the dia-gram)in underdoped BSLCO.Second,it is di?cult to objectively identify a “deviation point”when the devia-tion occurs gradually and continuously.These shortcom-ings have been part of the reasons why T ?has been only loosely discussed and its generic behavior is not agreed upon.Furthermore,since the paraconductivity due to the superconducting ?uctuations (SCF)also reduces ρab and leads to a negative curvature in ρab (T ),it is some-times di?cult to judge whether the deviation from the high-temperature T -linear behavior is due to the pseu-dogap or the SCF,particularly when the SCF can start from quite a high temperature [21].[In Fig.1(b),the blue region immediately above T c is where the SCF is dominant.]An obvious merit of the present de?nition of T pg is that those ambiguities can naturally be avoided.Next we discuss LSCO,for which the raw ρab (T )data are shown in Figs.2(a-b).For clarity,we use the nominal x values for the LSCO samples here,but we con?rmed that the actual Sr contents measured by ICP-AES agree with the nominal x values within an error of less than 5%.The RCM plot for LSCO [Fig.2(c)]is a bit complicated due to the existence of the structural phase transition from the high-temperature tetragonal phase to the low-temperature orthorhombic phase,which causes a weak
3
a b
Temperature (K)
ρa b ( m ?c m )
Temperature (K)350300
25020015010050T e m p e r a t u r e (K )
0.20
0.15
0.10
0.05
Sr content x
-8
-6-4-20246
8d 2ρab n /dT
2
(10-6
/ K 2
)
(c)
FIG.2:(a,b)ρab (T )data of LSCO for x =0.01–0.22at 0.01intervals.(c)Electronic phase diagram depicted by RCM for LSCO;here ρn ab =ρab /ρab (400K).The dashed line is a guide to the eyes to emphasize T pg and the solid green circles show T c ’s for the measured compositions.
kink in the ρab (T )data;the diagonal red band that ends at x =0.18signi?es this transition,whose position is con-sistent with the data in the literature [22].Apart from this structural transition,one can see that the phase dia-gram of LSCO depicted by RCM is very similar to that of BSLCO in several respects:First,the T -linear resistiv-ity (vertical white band)is observed only near optimum doping (x ?0.16–0.18).Second,the vertical red region for p 0.19demonstrates that the ρab (T )behavior be-comes positively curved in the overdoped regime.Third,T pg (marked by a dashed line)changes approximately linearly with x for x ≥0.06and is terminated near opti-mum doping;incidentally,it is intriguing to see that T pg saturates in the non-superconducting regime (x <0.06)and that the saturated value of T pg is close to the N′e el temperature for x =0(~300K)[22].
Figures 3(a-b)show the ρa (T )data for YBCO,and the RCM plot is shown in Fig.3(c).One can easily see that the phase diagram of YBCO depicted in Fig.3(c)is quite similar to those of BSLCO and LSCO in that (1)the T -
a Temperature (K)
ρa (m ?c m )
Temperature (K)T e m p e r a t u r e (K )
7.0
6.9
6.8
6.7
6.6
6.5
6.4
6.3
Oxygen content y
FIG.3:(a,b)ρa (T )data of YBCO for y =6.30–7.00at 0.05intervals.(c)Electronic phase diagram depicted by RCM for YBCO,where the solid green circles show T c ’s for the measured compositions.
linear resistivity is observed only near optimum doping (i.e.,y ?6.95),and (2)T pg changes approximately lin-early with y in the superconducting regime and tends to saturate in the antiferromagnetic regime.In addi-tion,one can see that ρa (T )becomes slightly positively curved in the overdoped regime,which is recognized by the faint red color at y =7.00for T >150K.How-ever,Fig.3(c)also shows a departure from the universal phase diagram suggested by BSLCO and LSCO in two aspects:(1)T pg is terminated at y ?6.8,which is near optimum doping but is in the underdoped regime,and (2)the high-temperature behavior at 6.80 y 6.90is complicated.(The red blob at the top of the diagram for 6.85≤y ≤6.90is due to a slight curving of the ρa (T )data near 300K at these dopings,which we con?rm to be very reproducible;this is due to the oxygen motion in the Cu-O chains [23].)Phenomenologically,it appears that these peculiarities are related to the fact that the T c -vs-y diagram of YBCO [see the green symbols in Fig.3(c)]shows two plateaus at ~60K and ~90K,the former called the 60-K phase and its origin is still under debate [9];clearly,the phase diagram is more ordinary in the 60-K phase and below (y ≤6.80),but becomes peculiar near the 90-K phase.One interesting possibility is that
4
the phase diagram for y≤6.80re?ects the physics of the CuO2planes alone,while in the90-K phase the Cu-O chains introduce additional complications.In any case, the slight nonuniversality in YBCO is most likely related to its structural peculiarity.
The above results demonstrate that the cuprate phase diagram is surprisingly universal unless some additional feature(such as the Cu-O chains in YBCO)adds another layer of complications.In particular,the fact that the T-linear resistivity is observed only near optimum dop-ing andρab(T)becomes positively curved as soon as the system is overdoped is commonly observed in the three cuprate systems studied here.In this regard,our data do not give strong support to the notion that the T-linear resistivity is associated with a quantum critical region (where the physics is scaled by a single energy scale T [6]);based on our data,one should probably conclude that the quantum critical region,if exists,must be much narrower in cuprates than is observed in other systems [24,25],where it clearly fans out with increasing T like an inverse triangle.It seems that our data(particularly those of BSLCO)would rather suggest that there are simply two di?erent electronic states for underdoped and overdoped regimes,and the T-linear resistivity appears to be a property of a singular electronic state realized only at optimum doping.It is useful to note that such an abrupt nature of the crossover at optimum doping might be related to a change in the underlying Fermi-surface state,which was recently shown to occur at optimum doping in BSLCO[26].
Finally,it is useful to note that in all three cuprates the pseudogap crossover line T pg(p)is terminated some-where near optimum doping and it does not extend into the overdoped regime.This might appear to be incon-sistent with the results of the angle-resolved photoemis-sion spectroscopy(ARPES)[27]or the scanning tunnel-ing microscope(STM)[28]that observed a pseudogap in overdoped samples,but such apparent inconsistency is probably a manifestation of the fact that the pseu-dogap in the cuprates has two di?erent origins[29,30] and only one of them is responsible for the S-shape in ρab(T).In this regard,it is useful to note that the SCF are probably related to various pseudogap features that occur rather close to T c[29,30,31],and in this sense the blue region immediately above T c in our RCM plots can be considered to be representative of the pseudogap of a di?erent origin;this interpretation is actually consis-tent with the phase diagram of BSLCO depicted by the c-axis magnetoresistance[29].In passing,we note that the pseudogap is known to be most directly probed in the c-axis properties[1,2,29]and T pg determined here from RCM is rather indirectly re?ecting the pseudogap, probably giving a lower measure of its development.
In summary,we demonstrate that the Resistivity Cur-vature Mapping(RCM)o?ers a powerful tool to draw an electronic phase diagram of high-T c cuprates based on the resistivity data.The biggest merit of this method is that it allows one to objectively draw the pseudogap crossover line T pg(p).It also allows one to see where in the phase diagram the T-linear resistivity is observed.The RCM-derived phase diagrams we present for BSLCO,LSCO, and YBCO demonstrate that the essential feature of the phase diagram is surprisingly universal and that the electronic crossover near optimum doping occurs rather abruptly.
We thank https://www.360docs.net/doc/507286627.html,vrov for helpful discussions.
?Electronic address:ando@criepi.denken.or.jp
[1]T.Timusk and B.Statt,Rep.Prog.Phys.62,61(1999).
[2]J.Orenstein and https://www.360docs.net/doc/507286627.html,lis,Science288,468(2000).
[3]P.W.Anderson,Science288,480(2000).
[4]B.Batlogg and V.J.Emery,Nature382,20(1996).
[5]E.W.Carlson,V.J.Emery,S.A.Kivelson,and D.Or-
gad,cond-mat/0206217.
[6]S.Sachdev,Science288,475(2000).
[7]S.Ono and Y.Ando,Phys.Rev.B67,104512(2003).
[8]S.Komiya,Y.Ando,X.F.Sun,and https://www.360docs.net/doc/507286627.html,vrov,Phys.
Rev.B65,214535(2002).
[9]K.Segawa and Y.Ando,Phys.Rev.Lett.86,4907
(2001).
[10]Y.Ando et al.,Phys.Rev.B61,R14956(2000);63,
069902(E)(2001).
[11]K.Segawa and Y.Ando,Phys.Rev.B69,104521(2004).
[12]Y.Ando,K.Segawa,https://www.360docs.net/doc/507286627.html,vrov,and S.Komiya,J.
Low Temp.Phys.131,793(2003).
[13]Y.Ando et al.,Phys.Rev.Lett.87,017001(2001).
[14]S.Ono et al.,Phys.Rev.Lett.85,638(2000).
[15]At each T,we?t the raw data in a window T±?T with
a polynomial of order2–4and take its second derivative
(?T is typically5K);the resulting RCM is essentially the same for?T of2–10K,except that a sharp feature gets gradually smeared with increasing?T.
[16]Y.Ando and T.Murayama,Phys.Rev.B60,R6991
(1999).
[17]T.Ito,K.Takenaka,and S.Uchida,Phys.Rev.Lett.70,
3995(1993).
[18]Y.Ando et al.,Phys.Rev.Lett.92,197001(2004).
[19]M.R.Norman et al.,Nature392,157(1998).
[20]T.Watanabe,T.Fujii,and A.Matsuda,Phys.Rev.Lett.
79,2113(1997).
[21]Y.Ando and K.Segawa,Phys.Rev.Lett.88,167005
(2002).
[22]M.A.Kastner,R.J.Birgeneau,G.Shirane,and Y.En-
doh,Rev.Mod.Phys.70,897(1998).
[23]https://www.360docs.net/doc/507286627.html,vrov,Phys.Lett.A168,71(1992).
[24]J.Custers et al.,Nature424,524(2003).
[25]R.S.Perry et al.,Phys.Rev.Lett.86,2661(2001).
[26]F.F.Balakirev et al.,Nature424,912(2003).
[27]A.Damascelli,Z.Hussain,and Z.X.Shen,Rev.Mod.
Phys.75,473(2003).
[28]M.Kugler et al.,Phys.Rev.Lett.86,4911(2001).
[29]https://www.360docs.net/doc/507286627.html,vrov,Y.Ando,and S.Ono,Europhys.Lett.57,
267(2002).
[30]R.S.Markiewicz,Phys.Rev.Lett.89,229703(2002).
[31]Y.Wang et al.,Phys.Rev.B64,224519(2001).