Model-based evaluation of cell phone menu interaction
Model-based Evaluation of Cell Phone Menu Interaction
Robert St. Amant and Thomas E. Horton
Department of Computer Science North Carolina State University
Raleigh, NC 27695
stamant@https://www.360docs.net/doc/5316731210.html, tehorton@https://www.360docs.net/doc/5316731210.html,
Frank E. Ritter
School of Information Sciences and Technology
The Pennsylvania State University University Park, PA 16081
ritter@https://www.360docs.net/doc/5316731210.html,
ABSTRACT
Cell phone interfaces are now ubiquitous. In this paper, we describe concepts to support the analysis of cell phone menu hierarchies. We present an empirical study of user performance on five simple tasks of menu traversal on a cell phone. Two models we tested, based on GOMS and ACT-R, give very good predictions of behavior. We use the study results to motivate an effective evaluation process for menu hierarchies. Our work makes several contributions: a novel and timely study of a new, very common HCI task; new models for accurately predicting performance; novel development tools to support such modeling; and a search procedure to generate menu hierarchies that reduce tra-versal time, in simulation studies, by about a third.
Categories and Subject Descriptors
H.5.2 [Information Interfaces and Presentation]: User Interfaces—Evaluation/methodology.
Keywords
Mobile telephones, menu traversal, cognitive modeling, evaluation
INTRODUCTION
There are at least a billion cellular telephones in use today, and this number is expected to double by 2007 [4]. Cell phones are used for more than making calls; they include tools for managing contact information, voice mail, and hardware settings, and often software for playing games, browsing the Web, and connecting to specialized information services. The market penetration of cell phones is much higher than that of conventional computers, which raises significant opportunities and challenges for HCI. The focus of this paper is on techniques for evaluating spe-cific aspects of cell phone usability, especially the hierar-chical menus that provide access to most functionality aside from dialing and data entry. While cell phone menu inter-faces may appear simple at first glance, they pose a non-trivial design problem. Consider the menu hierarchy for the
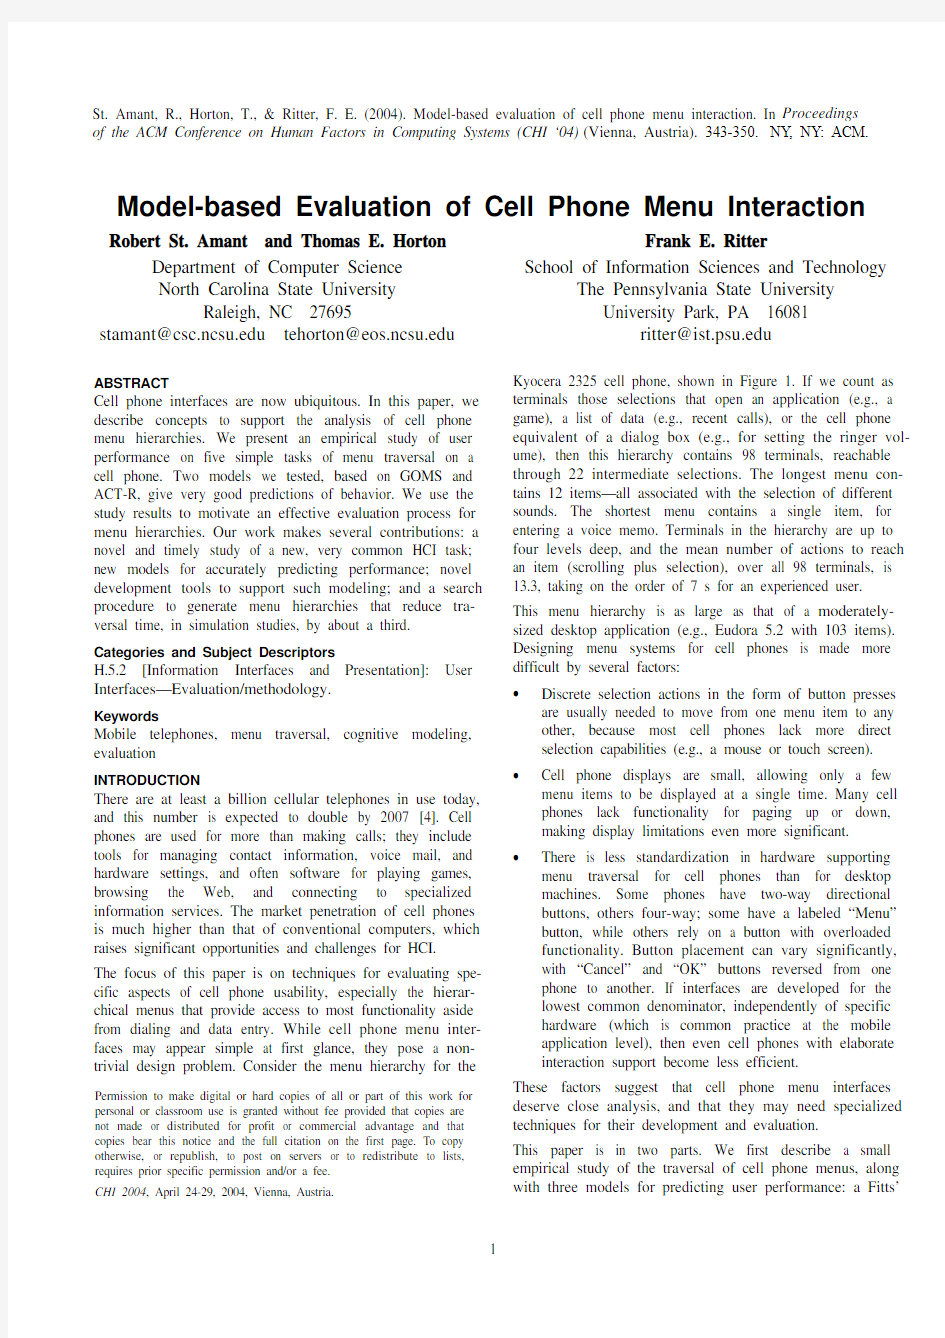
Kyocera 2325 cell phone, shown in Figure 1. If we count as terminals those selections that open an application (e.g., a game), a list of data (e.g., recent calls), or the cell phone equivalent of a dialog box (e.g., for setting the ringer vol-ume), then this hierarchy contains 98 terminals, reachable through 22 intermediate selections. The longest menu con-tains 12 items—all associated with the selection of different sounds. The shortest menu contains a single item, for entering a voice memo. Terminals in the hierarchy are up to four levels deep, and the mean number of actions to reach an item (scrolling plus selection), over all 98 terminals, is 13.3, taking on the order of 7 s for an experienced user. This menu hierarchy is as large as that of a moderately-sized desktop application (e.g., Eudora 5.2 with 103 items). Designing menu systems for cell phones is made more difficult by several factors: ?
Discrete selection actions in the form of button presses are usually needed to move from one menu item to any other, because most cell phones lack more direct selection capabilities (e.g., a mouse or touch screen). ?
Cell phone displays are small, allowing only a few menu items to be displayed at a single time. Many cell phones lack functionality for paging up or down, making display limitations even more significant. ?
There is less standardization in hardware supporting menu traversal for cell phones than for desktop machines. Some phones have two-way directional buttons, others four-way; some have a labeled “Menu” button, while others rely on a button with overloaded functionality. Button placement can vary significantly, with “Cancel” and “OK” buttons reversed from one phone to another. If interfaces are developed for the lowest common denominator, independently of specific hardware (which is common practice at the mobile application level), then even cell phones with elaborate interaction support become less efficient.
These factors suggest that cell phone menu interfaces deserve close analysis, and that they may need specialized techniques for their development and evaluation.
This paper is in two parts. We first describe a small empirical study of the traversal of cell phone menus, along with three models for predicting user performance: a Fitts’
Permission to make digital or hard copies of all or part of this work for personal or classroom use is granted without fee provided that copies are not made or distributed for profit or commercial advantage and that copies bear this notice and the full citation on the first page. To copy otherwise, or republish, to post on servers or to redistribute to lists, requires prior specific permission and/or a fee. CHI 2004, April 24-29, 2004, Vienna, Austria.
St. Amant, R., Horton, T., & Ritter, F. E. (2004). Model-based evaluation of cell phone menu interaction. In Proceedings of the ACM Conference on Human Factors in Computing Systems (CHI ‘04) (Vienna, Austria). 343-350. NY, NY: ACM.
law model, a GOMS model,
and an ACT-R model. The
latter two models give good to
very good predictions of user
behavior. In the second part
of the paper, we turn to the
issue of designer-level
support for evaluating cell
phone menus. We use our
empirical results to define a
novel evaluation metric for
cell phone menus. We de-
scribe a search process that
generates improvements to a
menu hierarchy with respect
to a given set of user profiles.
We make several contribu-
tions: a novel and timely
study of a very common new
HCI task, new models for accurately predicting per-formance, and a simple, theoretically motivated search procedure that generates menu hierarchies that reduce traversal time in simulation studies by a third.
A PERFORMANCE STUDY
Our interest is in expert (i.e., practiced and error-free) use of cell phone menu systems. For control purposes, however, it was not possible to collect data from experienced users on their own cell phones, with all their potential differences in hardware and software. As a compromise, we had users practice a small number of tasks (so that all tasks could be remembered easily) and then carry them out on a single cell phone. Though restrictive, these conditions give a reason-able starting point for an empirical study.
We used a Kyocera 2325, as in Figure 1. The Kyocera display shows three menu items at a time, except for the first level, in which a single selectable item is shown. Each new menu list is displayed with the top item highlighted. The OK button selects the currently highlighted item. If the item is not a terminal, the result is a new list of items. The CLR button returns to the previous level in the hierarchy. On the four-way scrolling button, UP and DOWN move through the item list; except for the first menu, RIGHT and LEFT are inactive. Downward scrolling is incremental, with items appearing one at a time at the bottom of the screen. Procedures
We recruited twelve experienced cell phone users for our study, all male undergraduates in computer science, who took part for course credit. All were right handed. All but one used their right hand to hold the cell phone, and all used their thumb to press keys.
Participants started with a practice stage, in which they familiarized themselves with the cell phone and its menu system. We gave each participant a paper form describing how five target menu items were to be reached, as follows:
Menu > > > Settings > > Sounds > Ringer Volume Menu > > > > Tools & Games > > Tip Calculator Menu, Contacts, View All
Menu > > > > Tools & Games, Scheduler, View Day Menu > > > > > > Web Browser
Each “>” represents a scrolling action, with commas separating consecutive selection actions. Reaching each of the target items (those at the end of each sequence) constituted a task in the study. Participants practiced each task until they could carry it out three times in a row without error.
After the practice stage, we recorded the tone produced by each key press as transmitted through the earphone jack of the cell phone. Data collection was initiated by the first key pressed by the participant. The onset of each key press is detectable by a threshold test on the waveform, using soft-ware we wrote for this purpose. Each tone lasts approxi-mately 0.095 seconds, during which time the display changes, before the key is released. System responses are treated as occurring within elementary key press actions and not contributing to the duration of user actions.
Each trial in the study required reaching one of the target items from the practice stage without access to the paper form. Tasks were presented to participants in a randomized order. We obtained five correct trials per participant (i.e., without errors or extraneous actions), discarding fewer than 10 trials across all participants, less than 3% of the data. This means that our cleaned dataset contains only OK and DOWN key press actions, 2,280 observations in total (2,280 = 12 users ? 5 repetitions ? (10 + 9 + 3 + 8 + 8 actions per task)).
Table 1 shows the mean duration per task, over all participants in the study. User performance is on the order of five times slower than for single-level menu selection with a mouse [3], which highlights the importance of specialized models for this task, as we discuss below. Models of user behavior
We predicted performance with three models, each supported by a considerable background literature. The models were developed independently of each other based on a preliminary pilot test with a single user and a single
task. The models were also developed independently of the Figure 1. Kyocera 2325.
Task N actions Duration
Ringer Volume 10 4.954 (1.077)
Tip Calculator 9 4.027 (0.921)
View All 3 1.271 (0.412)
View Day 8 4.393 (0.971)
Web Browser 8 3.391 (0.827)
Table 1. Task duration in seconds, with mean and
standard deviation shown (in parentheses).
actual study data, and none reflect adjustment of model parameters to fit the data.
The first model is a Fitts’ law model. We use MacKenzie’s model of one finger typing for text-entry on mobile phones [8], in which movement time (in ms) for thumb input is
)1
/
(2
log
64
176+
+
=W
D
MT, (Eq. 1) where D represents the distance (amplitude) of the movement and W the width of the target. The value for D in our study was 14.5 mm, which separates the OK button and the DOWN button area, with widths of 6 mm and 10 mm, as measured on the physical device.
The second model is a GOMS model [6, 7]. GOMS methods for task analysis produce hierarchical descriptions of methods and operators needed to accomplish goals; some GOMS models have been strikingly successful in critical HCI domains [5]. In our model we define a method for each task in the study. Each step within a task corresponds to the selection of a menu item. Thus the Ringer Volume task involves the steps of selecting the Menu, Settings, Sounds, and Ringer Volume items, in sequence. Each of these steps in turn decomposes into a Select-X task, which involves scrolling until a given item X in the sequence is reached:
S1 Look at location for X.
S2 If (found-X and not on-OK-button),
move-to OK-button; select-item; goto S4.
If (found-X and on-OK-button),
select-item; goto S4.
If (not found-X and on-scroll-button), scroll.
If (not found-X and not on-scroll-button),
move-to scroll-button; scroll.
S3 Goto S2.
S4 Return with goal accomplished.
Following guidelines established by Kieras in his work on GOMSL and GLEAN3 [7], all the steps above have a 50 millisecond duration except S2, whose duration is com-puted from movements, following the Fitts’ law model above, and button presses lasting 350 ms. Other models are reasonable, both faster and slower, but we built our model to be as fast as possible, given what we know about the do-main. The model assumes negligible system response time, that there are no verification steps, and that the information on the display starts in focus and does not require re-acquisition during scrolling activity.
The third model is based on the ACT-R 5.0 cognitive architecture [1].1ACT-R integrates theories of cognition, visual attention, and motor movement and has been the basis for a number of models in HCI [10]. ACT-R models simulate internal cognitive processing, such as changes of
1 We picked ACT-R as a representative cognitive modeling architecture and as a common choice in HCI work. All models described in this section, plus the study data, are at https://www.360docs.net/doc/5316731210.html,/~stamant/papers/RSA-TEH-FER-chi04.
attention and memory retrievals, as well as external actions, such as movement of the fingers, producing changes in the state of the model and durations for the actions. Roughly speaking, ACT-R models provide details that can explain behavior in cognitive terms at a level not addressed by more abstract GOMS models [11].
In our ACT-R model, a simulated field of view is main-tained that represents the current menu items in the hierar-chy. This view changes depending on the selection and scrolling actions taken by the model. Before running, the model’s memory is initialized with a set of chunks repre-senting the hierarchical relationships between intermediate and terminal menu items. This allows the model to deter-mine whether a given menu item (e.g., “Settings”) is on the path to a target item (e.g., “Ringer Volume”) by retrieving this information from memory.
The model starts with the goal of selecting a specific target menu item. The simulation environment shows a single highlighted item, which the model searches for in its field of view. Once found, the item is attended and then encoded, so that its text representation becomes accessible. If the text matches the goal item, then the model initiates motor actions to press the OK key. If the text does not match, memory is searched to determine whether the highlighted text is on the path to the target item. If it is, then the OK key is pressed, and the process repeats from the beginning with a new highlighted menu item. If the currently highlighted item is not on the path to the goal item, then the DOWN scroll key is pressed, and again the process starts over. In the model manual scrolling actions can trail behind visual processing by an unspecified amount (determined by processing in the model such as memory retrievals); the visual and manual modules become synchronized when a new menu is https://www.360docs.net/doc/5316731210.html,er errors, such as pressing an incorrect key, are not modeled. Model execution is deterministic, with no noise parameters used.
Model performance
Table 2 shows the predictions each model makes of user performance over all the menu selection tasks. Significant differences between the user data and model predictions, as given by Tukey’s HSD (Honestly Significant Difference) test based on a single run of each model on all tasks, are shown as starred table entries. There are three different categories: all actions aggregated together over all tasks, only selection actions, and only scrolling actions. The Fitts’ All actions Scrolling Selection Users 0.547 (0.256) 0.515 (0.254) 0.610 (0.249) GOMS 0.542 (0.147) 0.505 (0.154) 0.616 (0.098) ACT-R 0.550 (0.242) 0.561* (0.272) 0.527* (0.174) Fitts 0.218* (0.050) 0.202* (0.040) 0.248* (0.057)
Table 2. Mean key press duration across all tasks, in
seconds, with mean and standard deviation shown.
law predictions are significantly different from user performance in all categories. The ACT-R model provides good predictions at the aggregate level, but differs in the more detailed categories, making a qualitative error in predicting that scrolling actions take longer than selection actions. The GOMS model gives predictions within 0.01 seconds (less than 2%) of the user means for all categories. Figure 2 shows a less-aggregated view of the menu selec-tion process. We define a “selection run” as a sequence of scrolling actions up to and including a selection action. The length of a run is the number of scrolling actions it contains, e.g., a run of length 0 corresponds to two consecutive se-lection actions. Figure 2 aggregates selection runs over all trials, showing the mean duration of runs from lengths 0 through 7 (by oversight our data contained no instances of runs of length 6.) As in the previous analysis, the GOMS model is closest to the user data, but here the ACT-R pre-dictions are almost indistinguishable from the GOMS pre-dictions. We see that both models produce larger overesti-mates of scrolling time for shorter runs than for longer runs. For ACT-R, we interpret this as being due to the additional visual processing needed when a new menu list is first seen, in addition to the balancing out of over/underestimates in scrolling/selection actions (the pattern in Figure 2 is more complex than can be attributed only to the latter factor.) For both models, the differences are gradually reduced as scrolling begins to dominate the longer sequences. The Fitts’ law model significantly underestimates all durations. Figure 3 shows performance data broken down by task. One task, View All, involved only three actions and was omitted because it is similar to the other tasks. Again, we see that both the GOMS model and the ACT-R model give good approximations of user performance.
Discussion
Many models of cell phone interaction, such as keypad dialing and one-finger text entry [8], have been based on Fitts’ law, which motivated this aspect of our evaluation. Our Fitts’ law model performs relatively poorly, however, despite the success of such models elsewhere. The model produces times that are about twice as fast as observed in users. This is actually not surprising—much of the activity of this menu selection task is outside the scope of the model. Silfverberg et al. describe a comparable example of where Fitts’ law models break down, in a discussion of text entry on mobile phones [13]. For some cell phones, text entry is aided by lexicon-based word disambiguation. While typing the user ordinarily refers to the display in order to decide whether the system has correctly disambiguated the word being typed. In text entry, such cognitive processing may be rare for expert users familiar with the disambigua-tion system, but in menu selection, under the plausible assumption that users will not have memorized the linear position of the items in each menu, significant visual and cognitive processing is needed at each step in the process. This processing is not captured by Fitts’ law. The GOMS and ACT-R models perform remarkably well in our study, with GOMS edging out ACT-R at a detailed level. As a baseline for performance, we can compare these models to a linear regression fit to all the data, where T represents time and n the number of key presses:
531
.0
=
T500
.0
?
n834
.0
2=
R(Eq. 2.) Neither model accounts for as much variance as the least squares model, but both are close, with the GOMS model averaging an R2 of 0.786 and the ACT-R model 0.790 over the different tasks. Further, from a modeling perspective they have several compensating advantages over a post hoc model. First, they are a priori models—neither was tuned specifically to the data. Second, as seen in Figures 2 and 3, the models track some of the nonlinear aspects of user performance, at least qualitatively. Third, and most important, the GOMS and ACT-R models have theoretical underpinnings that give them explanatory power. In the case of GOMS, performance is explained by the specific tasks that are represented, the hierarchical structure in which they are combined, and dependence on a cognitive processing framework that provides specific timing predictions (e.g., for Fitts’ law movements.) The ACT-R model extends the level of detail in its explanations, in accounting for the interval between actions by explicit visual processing and memory retrievals, and in modeling visual processing and motor actions as proceeding in parallel for scrolling actions but synchronizing with selection actions. Like all model-generated explanations, these are provisional and subject to further testing, but our current results make them plausible, worth pursuing in more detailed experiments.
SUPPORT FOR BUILDING AND USING MODELS Building detailed models of use for novel interfaces is not yet a matter of applying simple, off-the-shelf tools. It requires support for specifying the properties of new
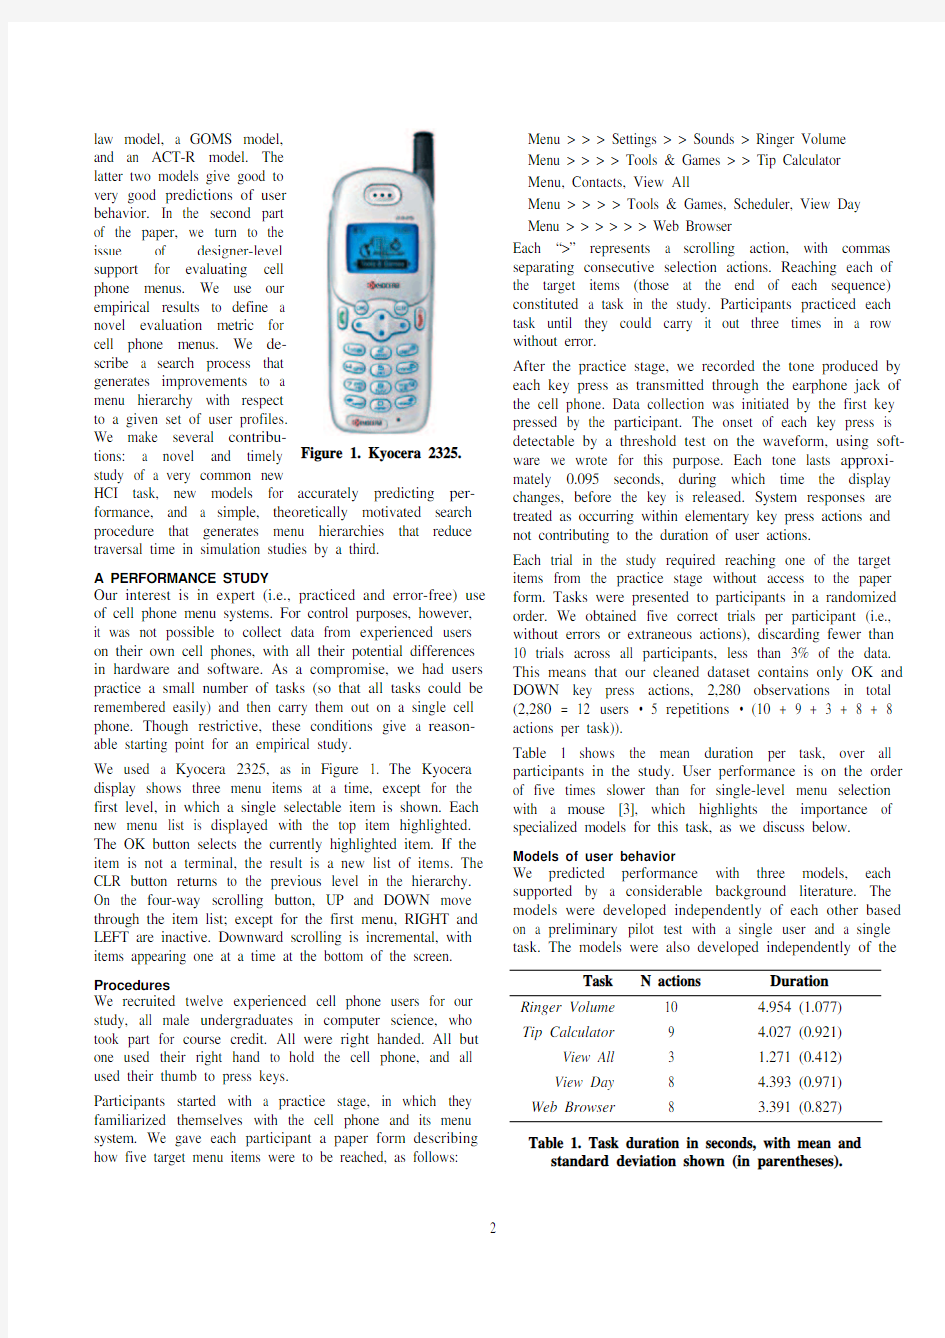
with the platforms to carry out the tasks, which may require customization of modeling architectures. Our work has led us to develop an environment containing tools that facilitate this process for cell phone platforms and tasks. Specifying menu hierarchies in which menu traversal tasks can be defined is the easiest part. Our environment supports loading such specifications through a formatted data file. Once the information is loaded, the modeler can browse and potentially edit the result, through the simple interface shown on the left side of Figure 4.
Platform specification, in the form of building new keypads from scratch, is also straightforward. We have developed a simple direct manipulation interface in which modelers can create and name buttons, size them, and drag them into place. The visual layout of the keypad is automatically translated into a specification that can act as input to all the models in the previous section (though not all information may be used by all the models). The interface is comparable to conventional user interface development tools; we do not present it here because of space considerations. Processing existing phone keypads poses a more interesting problem. It is possible to reproduce an existing keypad through the direct manipulation interface, but this is error-prone and more cumbersome than it need be. Given that images of most cell phones can easily be found online, another approach is possible. We have developed image processing algorithms to give perception capabilities to cognitive models such as ACT-R, Soar, and EPIC [12]. The algorithms are elementary but promise to be adequate for the task of interpreting images of real cell phone keypads. Keypad processing works as follows. The modeler loads a bitmap image of a keypad, which appears in a window
(Figure 4, on the right, shows a later stage of the process).
The modeler then identifies an arbitrary button by “scribbling” over it with the pointer. This serves two purposes: specifying representative visual properties of a key, specifically its color, size, and position, and implicitly describing the background for all the keys. The user can then associate a specific symbol with this key, such as “1” or “#”. All keys can be specified in this way, or the system can be directed to detect and identify all keys automatically. Results can then be reviewed and modified by the modeler. Figure 4 shows the result for a sample cell phone, with call outs generated and laid out by the system.2
Currently the system can detect only buttons that are well-differentiated from the background, and can identify (i.e., associate a symbol with) only the 12 standard keypad keys (“0” through “9”, plus “*” and “#”). Other keys can be detected but not automatically identified; naming these keys is left to the modeler. Once the relevant keys on the keypad have been identified, the system generates a specification of key names, sizes, and positions, identical in structure to that of the direct manipulation keypad builder interface.
In an informal test, we downloaded 12 images from the Web, of a quality comparable to Figures 1 and 4, of cell phones from different manufacturers and in different keypad styles. We ran the image processing algorithms on the keypads to identify the 12 standard keys, following the interaction described above. Results fell into three categories. For four of the cell phone images, the system failed to identify any keys at all. For two of the images, the 2 This side of our research ran in parallel with but slightly later than the study. The image processing algorithms handle the Kyocera keypad without problems, but the numbers used for the study were measured by hand. system identified 10 out of the 12 keys correctly. Errors involved the merging of two neighboring keys (e.g., “8” and “0”.) For the remaining six images, all 12 standard keys were identified correctly. The more successful results tended to have good resolution, low variation in back-ground color, easily differentiated key borders, and few lighting artifacts. Figure 4, of a Motorola T193, is representative of an image processed successfully. Work needs to be done on making the image processing techniques more robust, but even in their current state they add value to the modeling process by reducing effort. Once a menu hierarchy and keypad have been specified, model execution can proceed. Our modeling environment is designed as a set of extensions to the ACT-R system. The PM (perceptual/ motor) component of ACT-R has some bias toward desktop activities, such as selecting menu items with the mouse and navigating through windows and dialog boxes [1,3], so we added two extensions. Our first change involved increasing flexibility in the existing models of finger movements and the keyboard, to support finger movements to target keys of arbitrary size and placement. Our second change was a limited form of automated model generation from the menu hierarchy specification. ACT-R productions (rules) are not modified, but memory structures are automatically created (on the order of several hundred chunks) to reflect relationships between intermediate and terminal menu items.
The GOMS and Fitts’ law models co-exist with ACT-R in the same environment, sharing a common code base. We implemented a simple Fitts’ law simulator and a GOMS interpreter that use the geometry of the keypad specification for computing movement times. Fitts’ law movement op-erators are generated from the menu hierarchy, given a target menu item. Similarly, all of the methods and operators for the GOMS model except the Select-X method are automatically generated. Thus given a menu hierarchy, keypad specification, and target menu item, GOMS and Fitts’ law models can be built and run without further effort. To summarize, the tools we have developed assist the developer in specifying new menu hierarchies, building descriptions of new or existing cell phone keypads, and automatically incorporating this information into specialized models. The process requires no programming or explicit model construction, from start to finish.
User profiles and search
Once models of menu traversal have been built, they can be applied toward improving menu hierarchies for end users. This is a key concern for developers who may be less inter-ested in modeling details than in the pragmatic issues of increasing usability.
An evaluation of a menu hierarchy independent of usage patterns would be uninformative: different users choose different items, and items are chosen with varying frequency. In other words, different usage patterns favor
Figure 4. Browsing a menu hierarchy (left); automatic detection and identification of keys (right).
different designs. We can incorporate information about different user categories into an evaluation. We define a user profile to be a probability distribution over the set of terminals in the hierarchy (explained below). The coverage of a profile reflects the ratio of users it represents with respect to all users of the cell phone (some profiles will be more common than others), and the usage of a profile gives the average frequency with which items are chosen (e.g., two profiles may contain similar probabilities, but one may apply to users who access their cell phones several times as often as the other set of users.) As an example, imagine that 20% of users access two items equally, "Recent Calls" and "View All Contacts", on average three times a day. These users would have a profile such that in its probability distribution, those two item have probability 0.5 (all others 0.0); its coverage is 0.20; and its usage is 3 (a value that only becomes meaningful in the context of the usage values of other profiles.)
These concepts can be used to produce a very straightforward performance measure that represents the cost of traversing a menu hierarchy, over different possible user profiles, for all menu items that are accessed. Specifically, we define the expected cost of making item selections in a menu hierarchy as follows. Let T h be the set of terminals in hierarchy h . Then
∈=h
T t h t p t c h EC )()()
(
(Eq. 3.)
where p (t ) gives the probability of the occurrence of a particular terminal t in hierarchy h , and c h (t ) gives an estimate of the cost of reaching that terminal in the hierarchy. This measure is used by an automated search algorithm to identify alternative designs of the menu hierarchy that improve user performance.
The starting point for the search algorithm is provided by the designer, who enters information about terminal item occurrences. The designer can enter these directly (e.g., such-and-such an action occurs four times per day, week, or month) through a simple fill-in form that is generated from a given menu hierarchy. Alternatively, the designer can provide such information for specific user profiles. The system searches through modifications to the menu hierarchy, producing alternatives that can be interactively browsed, as shown earlier in Figure 4, to be accepted, rejected, or modified.
To compute p(t), one component of the expected cost measure, the system uses the information from the designer to construct a probability distribution of the occurrence of terminals in T h . This distribution may be directly supplied by the designer as described above, in the form of item access frequencies. If profile-based information is provided instead (i.e., distributions of terminal occurrences conditioned on different user profiles), then an overall distribution is computed using Monte Carlo sampling, based on the usage and coverage values of the profiles.
To compute c h (t ), the other component of the expected cost of traversing the menu hierarchy, we use our study results. For pragmatic reasons, we use the easiest metric we have available to compute cost, the linear regression given in Equation 2 (the GOMS or ACT-R model could have been used, though with a significant increase in processing time.) The factors that make the linear regression less appropriate for modeling do not apply here. Our choice for c h means that EC (h ) produces the expected duration of choosing an arbitrary menu item in h .
An automated, search-based modification of a menu hierar-chy cannot arbitrarily rearrange its structure purely for effi-ciency. Changes must respect the semantic relationships between the items. That is, “Ringer Volume” is under the “Settings” category rather than vice versa for good reason. To avoid the difficulties of representing and reasoning about menu item semantics (we leave this for future work), we rely on two search operators that produce only small changes. For a target item with non-zero probability in some user profile, these operators can be applied:
? Promote item: This operator moves a target item to the beginning of its menu list, to reduce scrolling time. ?
Promote subtree: This operator moves an ancestor of the target item up one level in the hierarchy, to reduce selection of intermediate items to reach the target.
An item or subtree rooted at an ancestor may only be pro-moted once. Even with these constraints, the search space size is exponential in the number of target items with non-zero probability in any profile (e.g. if all non-zero items in a user profile are in one menu list, then all permutations of these items will be considered.) Exhaustive search is thus impractical. A best-first search algorithm, however, gives good results after as few as 100 steps.
Lacking real user profiles, we can only illustrate the search procedure in practice, but our results are promising. Based on the Kyocera menu hierarchy, we defined random profiles of different sizes, where size refers to the number of non-zero probability menu items contained in the profile. The probabilities for each profile were drawn from a uniform random distribution and normalized. Because these profiles were randomly generated, we used only a single profile for the search, rather than composing arbitrary probabilities from different random profiles. Table 3 shows the results for user profiles of size 20, 30, and 40, each given 10 runs in a best-first search bounded at 500 steps. The cost values are means of the time estimates produced by the linear
Profile size Initial cost Final cost Savings
20 7.325 4.530 37.5% 30 6.962 4.762 31.5% 40
7.009
4.940
29.4%
Table 3. Improvement of menu traversal times.
model. The last column gives the time savings in traversing the reordered menus, as a percentage of the duration of the traversals in the original menu hierarchy. Because these results are based on random probabilities of accessing menu items, rather than actual user experiences, they can only be viewed as suggestive.
FUTURE WORK
One aspect of our future work will involve testing with ACT-Simple [11], to see whether the simpler GOMS model might be automatically translated into an improved, more detailed cognitive model based on ACT-R. As obvious as this direction may seem now, we did not pursue it initially, partly because we did not expect the ACT-R and GOMS models to perform as well as they did, and partly because we thought of GOMS as a baseline against which we would demonstrate an ACT-R improvement. (That the ACT-R model produces inferior detailed predictions is disappointing, indicating that our understanding of the task is incomplete at the lower levels. We expect to address its shortcomings in follow-on work.) A comparison of different detailed models, including ACT-R, ACT-Simple, and other possibilities, is now appropriate at this stage. CONCLUSION
In this paper we have described a set of evaluation concepts and tools to support cell phone menu design. Our work has both theoretical and practical implications. Novice user actions, learning, error recovery behavior, and generality across different devices are now areas ripe for further exploration. From a practical standpoint, developers have models that are ready for use—they are general enough that they do not require cognitive modeling expertise or pro-gramming skill to apply them to different traversal tasks, in different menu hierarchies, or on different cell phones. Our longer-term goals for this research include building an inte-grated environment to support the definition of new inter-active environments, the application of modeling techniques to provide insights into usability issues [9], and the applica-tion of intelligent tools that can contribute information to aid design. We believe that as modeling concepts and tech-niques become more accessible to HCI developers, they will become increasingly significant in their contribution to improving interfaces.
ACKNOWLEDGMENTS
The authors wish to thank David Golightly and five anony-mous reviewers for their helpful comments. This effort was supported by the National Science Foundation under award IIS-0083281 and by the Space and Naval Warfare Systems Center, San Diego. The information in this paper does not necessarily reflect the position or policies of the U.S. gov-ernment, and no official endorsement should be inferred. REFERENCES
1. Anderson, J., & Lebiere, C. (1998). The atomic compo-
nents of thought. Mahwah, NJ: LEA.
2. Byrne, M. D., & Gray, W. D. (2003). Returning human
factors to an engineering discipline: Expanding the sci-ence base through a new generation of quantitative methods—Preface to the special section. Human Fac-tors, 45, 1-4.
3. Byrne, M. D. (2001). ACT-R/PM and menu selection:
Applying a cognitive architecture to HCI. Int. J. Hu-man-Computer Studies, 55(1):41-84.
4. Charney, B. (2003). Cell phone use to double. CNET
https://www.360docs.net/doc/5316731210.html,, https://www.360docs.net/doc/5316731210.html,/2100-1039-5060745.html, August 6, 2003.
5. Gray, W. D., John, B. E., and Atwood, M. E. (1993).
Project Ernestine: Validating a GOMS analysis for pre-dicting and explaining real-world task performance, Human-Computer Interaction, 8(3): 237-309.
6. John, B. (2003). Information processing and skilled be-
havior. HCI models, theories, and frameworks, Carroll, J. (ed), SF, CA: Morgan Kaufman.
7. Kieras, D. (1999). A Guide to GOMS Model Usability
Evaluation using GOMSL and GLEAN3, ftp://www.
https://www.360docs.net/doc/5316731210.html,/people/kieras/GOMS/GOMSL_Guide.pdf. 8. MacKenzie, I. S. (2003). Motor behavior models for
human-computer interaction. HCI models, theories, and frameworks, Carroll, J. (ed), SF, CA: Morgan Kaufman.
9. Nichols, S., & Ritter, F. E. (1995). A theoretically moti-
vated tool for automatically generating command ali-ases. In Proceedings of CHI, 393-400. NY, NY: ACM.
10. R itter, F. E., and Young, R. M. (2001). Embodied mod-
els as simulated users: Introduction to this special issue on using cognitive models to improve interface design.
Int. J. Human-Computer Studies, 55(1):1-14.
11. S alvucci, D. D., and Lee, F. J. (2003). Simple cognitive
modeling in a complex cognitive architecture. Proceed-ings of CHI, 265-272. New York, NY: ACM.
12. S t. Amant, R., and Riedl, M. O. (2001). A perception/
action substrate for cognitive modeling in HCI. Int. J.
Human-Computer Studies, 55(1):15-39.
13. S ilfverberg, M., MacKenzie, I. S., and Korhonen, P.
(2000). Predicting text entry speed on mobile phones, Proceedings of CHI, 9-16. New York, NY: ACM.
光电传感器工作原理
光电传感器工作原理-标准化文件发布号:(9556-EUATWK-MWUB-WUNN-INNUL-DDQTY-KII
工作原理 摘要: 光电传感器是利用光电子应用技术,将光信号转换成电信号从而检测被测目标的一种装置。光电传感器一般由光源、光学通路和光电元件三部分组成。光电检测方法具有精度高,反应快,非接触等优点,而且可测参数多,传感器的结构简单,形式灵活多样,体积小。它可用于检测直接引起光量变化的非电量,如光强、光照度、辐射测温和气体成分等;也可用来检测能转换成光量的其他非电量,如零件直径、表面粗糙度、应变、位移、振动、速度和加速度,以及物体形状、工作状态等。光电式传感器具有非接触,响应快,性能可靠等特点,因此在工业自动化装置和机器人中获得广泛应用。近年来,新的光电器件不断涌现,特别是CCD图像传感器的诞生,为光电传感器的进一步应用开创了新的一页。 关键字:光电元件、检测技术、传感器、应用 一、光电传感器工作原理 光电式传感器的物理基础是光电效应,即半导体材料的许多电学特性都因受到光的照射而发生变化。光电效应通常分为两大类,即外光电效应和内光电效应。外光电效应是指物质吸收光子并激发出自由电子的行为。当金属表面在特定的光辐照作用下,金属会吸收光子并发射电子,发射出来的电子叫做光电子。光的波长需小于某一临界值 (相等于光的频率高于某一临界值)时方能发射电子,其临界值即极限频率和极限波长。由E =hn-W如果入射光子的能量hn大于逸出功W,那么有些光电子在脱离金属表面后还有剩余的能量,也就是说有些光电子具有一定的动能。因为不同的电子脱离某种金属所需的功不一样, 所以它们就吸收了光子的能量并从这种金属逸出之后剩余的动能也不一样。由于逸出功W是使电子脱离金属所要做功的最小值,所以如果用E 表示动能最大的光电子所具有的动能,那么就有下面的关系式E =hn-W (其中,h表示普兰克常量,n表示入射光的频率),这个关系式通常叫做爱因斯坦光电效应方程。
光电传感器工作原理
工作原理 摘要: 光电传感器是利用光电子应用技术,将光信号转换成电信号从而检测被测目标的一种装置。光电传感器一般由光源、光学通路和光电元件三部分组成。光电检测方法具有精度高,反应快,非接触等优点,而且可测参数多,传感器的结构简单,形式灵活多样,体积小。它可用于检测直接引起光量变化的非电量,如光强、光照度、辐射测温和气体成分等;也可用来检测能转换成光量的其他非电量,如零件直径、表面粗糙度、应变、位移、振动、速度和加速度,以及物体形状、工作状态等。光电式传感器具有非接触,响应快,性能可靠等特点,因此在工业自动化装置和机器人中获得广泛应用。近年来,新的光电器件不断涌现,特别是CCD图像传感器的诞生,为光电传感器的进一步应用开创了新的一页。 关键字:光电元件、检测技术、传感器、应用 一、光电传感器工作原理 光电式传感器的物理基础是光电效应,即半导体材料的许多电学特性都因受到光的照射而发生变化。光电效应通常分为两大类,即外光电效应和内光电效应。外光电效应是指物质吸收光子并激发出自由电子的行为。当金属表面在特定的光辐照作用下,金属会吸收光子并发射电子,发射出来的电子叫做光电子。光的波长需小于某一临界值(相等于光的频率高于某一临界值)时方能发射电子,其临界值即极限频率和极限波长。由E =hn-W如果入射光子的能量hn大于逸出功W,那么有些光电子在脱离金属表面后还有剩余的能量,也就是说有些光电子具有一定的动能。因为不同的电子脱离某种金属所需的功不一样,所以它们就吸收了光子的能量并从这种金属逸出之后剩余的动能也不一样。由于逸出功W是使电子脱离金属所要做功的最小值,所以如果用 E 表示动能最大的光电子所具有的动能,那么就有下面的关系式E =hn-W (其中,h表示普兰克常量,n表示入射光的频率),这个关系式通常叫做爱因斯坦光电效应方程。 如
光电传感器工作原理
光电传感器工作原理 电子电路 2008-05-31 22:27 阅读6004 评论3 字号:大中小 本文来源网络 光电传感器工作原理 光电传感器是通过把光强度的变化转换成电信号的变化来实现控制的。光电传感器在一般情况下,有三部分构成 它们分为:发送器、接收器和检测电路。发送器对准目标发射光束,发射的光束一般来源于半导体光源,发光二极管(LED)、激光二极管及红外发射二极管。光束不间断地发射,或者改变脉冲宽度。接收器有光电二极管、光电三极管、光电池组成。在接收器的前面,装有光学元件如透镜和光圈等。在其后面是检测电路,它能滤出有效信号和应用该信号。此外,光电开关的结构元件中还有发射板和光导纤维。三角反射板是结构牢固的发射装
置。它由很小的三角锥体反射材料组成,能够使光束准确地从反射板中返回,具有实用意义。它可以在与光轴0到25的范围改变发射角,使光束几乎是从一根发射线,经过反射后,还是从这根反射线返回。分类和工作方式⑴槽型光电传感器把一个光发射器和一个接收器面对面地装在一个槽的两侧的是槽形光电。发光器能发出红外光或可见光,在无阻情况下光接收器能收到光。但当被检测物体从槽中通过时,光被遮挡,光电开关便动作。输出一个开关控制信号,切断或接通负载电流,从而完成一次控制动作。槽形开关的检测距离因为受整体结构的限制一般只有几厘米。⑵对射型光电传感器若把发光器和收光器分离开,就可使检测距离加大。由一个发光器和一个收光器组成的光电开关就称为对射分离式光电开关,简称对射式光电开关。它的检测距离可达几米乃至几十米。使用时把发光器和收光器分别装在检测物通过路径的两侧,检测物通过时阻挡光路,收光器就动作输出一个开关控制信号。⑶反光板型光电开关把发光器和收光器装入同一个装置内,在它的前方装一块反光板,利用反射原理完成光电控制作用的称为反光板反射式(或反射镜反射式)光电开关。正常情况下,发光器发出的光被反光板反射回来被收光器收到;一旦光路被检测物挡住,收光器收不到光时,光电开关就动作,输出一个开关控制信号它的检测头里也装有一个发光器和一个收光器,但前方没有反光板。正常情况下发光器发出的光收光器是找
光感式传感器原理及其应用
光电式传感器原理及其应用 姓名 (测仪111班,刘俊杰,5801211048) Principle and application of photoelectric sensor 英文姓名 (measurement of class 111, Junjie Liu, 5801211048) 摘要:光电式传感器是以光电器件作为转换元件的传感器。它可用于检测光量变化或直接引起光量变化的非电量,也可用于检测能转换成光量变化的其他非电量。它首先把被测量的变化转换成光信号的变化,然后借助光电元件进一步将光信号转换成电信号。光电式传感器具有响应快、精度高、能实现非接触测量等优点,而且可测参数多,传感器的结构简单,形式灵活多样,因此,光电式传感器在检测和控制领域应用非常广泛。 关键词:光电式传感器;检测光量变化;电信号;检测与控制。 Abstract:photoelectric sensor is photoelectric device as a sensor element. It can be used for non electric quantity detection light intensity or directly caused by light intensity, and can also be used for detection can be converted into other non electrical quantity change. It divides the changes measured into optical signal changes, then with the help of optoelectronic devices to convert optical signals into electrical signals. Photoelectric sensor has the advantages of fast response, high precision, can realize the non-contact measurement etc., and measurable parameters, the sensor has the advantages of simple structure, flexible and diverse forms, therefore, application of photoelectric sensors in the detection and control field is very wide. Key words:photoelectric sensor; detection of light intensity; signal; detection and control. 1 前言 传感器是将感受的物理量、化学量等信息,按一定规律转换成便于测量和传输的信号的装置。电信号易于传输和处理,所以大多数的传感器是将物理量等信息转换成电信号输出的。例如传声器就是一种传感器,它感受声音的强弱,并转换成相应的电信号。又如电感式位移传感器能感受位移量的变化,并把它转换成相应的电信号。 光电测量时不与被测对象直接接触,光束的质量又近似为零,在测量中不存在摩擦和对被测对象几乎不施加压力。因此在许多应用场合,光电式传感器比其他传感器有明显的优越性。 2 光电式传感器工作原理 2.1 光电效应 光电效应是光照射到某些物质上,使该物质的导电特性发生变化的一种物理现象,可分为外光电效应、内光电效应和光生伏特效应(光生伏特效应包含于内光电效应,在此为特意列出)三类。 外光电效应是指在光线作用下,物体内的电子逸出物体表面向外发射的现象。光子是以量子化“粒子”的形式对可见光波段内电磁波的描述。光子具有能量hν,h为普朗克常数,ν为光频。光子通量则相应于光强。外光电效应由爱因斯坦光电效应方程描述: EK=hν-W 当光子能量等于或大于逸出功时才能产生外光电效应。因此每一种物体都有一个对应于光电效应的光频阈值,称为红限频率。对于红限频率以上的入射光,外生光电流与光强成正比。 内光电效应是指在光线作用下,物体的导电性能发生变化或产生光生电动势的效应,分为光电导效应和光生伏特效应两类。光电导效应是指,半导体材料在光照下禁带
光电传感器的工作原理
光电传感器工作原理(红外线光电传感器原理) 光电传感器工作原理(红外线光电传感器原理) 光电传感器是通过把光强度的变化转换成电信号的变化来实现控制的。 光电传感器在一般情况下,有三部分构成,它们分为:发送器、接收器和检测电路。 发送器对准目标发射光束,发射的光束一般来源于半导体光源,发光二极管(LED)、激光二极管及红外发射二极管。光束不间断地发射,或者改变脉冲宽度。接收器有光电二极管、光电三极管、光电池组成。在接收器的前面,装有光学元件如透镜和光圈等。在其后面是检测电路,它能滤出有效信号和应用该信号。 此外,光电开关的结构元件中还有发射板和光导纤维。 三角反射板是结构牢固的发射装置。它由很小的三角锥体反射材料组成,能够使光束准确地从反射板中返回,具有实用意义。它可以在与光轴0到25的范围改变发射角,使光束几乎是从一根发射线,经过反射后,还是从这根反射线返回。 分类和工作方式 ⑴槽型光电传感器 把一个光发射器和一个接收器面对面地装在一个槽的两侧的是槽形光电。发光器能发出红外光或可见光,在无阻情况下光接收器能收到光。但当被检测物体从槽中通过时,光被遮挡,光电开关便动作。输出一个开关控制信号,切断或接通负载电流,从而完成一次控制动作。槽形开关的检测距离因为受整体结构的限制一般只有几厘米。 ⑵对射型光电传感器 若把发光器和收光器分离开,就可使检测距离加大。由一个发光器和一个收光器组成的光电开关就称为对射分离式光电开关,简称对射式光电开关。它的检测距离可达几米乃至几十米。使用时把发光器和收光器分别装在检测物通过路径的两侧,检测物通过时阻挡光路,收光器就动作输出一个开关控制信号。 ⑶反光板型光电开关 把发光器和收光器装入同一个装置内,在它的前方装一块反光板,利用反射原理完成光电控制作用的称为
光感式传感器原理及其应用
光感式传感器原理及其 应用 SANY标准化小组 #QS8QHH-HHGX8Q8-GNHHJ8-HHMHGN#
机电工程系 传感器与检测技术学习报告 专业班级:生产过程自动化14-2 姓名:张鹏宇 学号: 19 项目名称:光感式传感器的应用与发展 指导教师:刘辉 评定成绩: 2015年12月15日
摘要:光电式传感器是以光电器件作为转换元件的传感器。它可用于检测光量变化或直接引起光量变化的非电量,也可用于检测能转换成光量变化的其他非电量。它首先把被测量的变化转换成光信号的变化,然后借助光电元件进一步将光信号转换成电信号。光电式传感器具有响应快、精度高、能实现非接触测量等优点,而且可测参数多,传感器的结构简单,形式灵活多样,因此,光电式传感器在检测和控制领域应用非常广泛。 关键词:光电式传感器;检测光量变化;电信号;检测与控制。 1 前言 传感器是将感受的物理量、化学量等信息,按一定规律转换成便于测量和传输的信号的装置。电信号易于传输和处理,所以大多数的传感器是将物理量等信息转换成电信号输出的。例如传声器就是一种传感器,它感受声音的强弱,并转换成相应的电信号。又如电感式位移传感器能感受位移量的变化,并把它转换成相应的电信号。 光电测量时不与被测对象直接接触,光束的质量又近似为零,在测量中不存在摩擦和对被测对象几乎不施加压力。因此在许多应用场合,光电式传感器比其他传感器有明显的优越性。 2 光电式传感器工作原理 光电效应 光电效应是光照射到某些物质上,使该物质的导电特性发生变化的一种物理现象,可分为外光电效应、内光电效应和光生伏特效应(光生伏特效应包含于内光电效应,在此为特意列出)三类。 外光电效应是指在光线作用下,物体内的电子逸出物体表面向外发射的现象。光子是以量子化“粒子”的形式对可见光波段内电磁波的描述。光子具有能量hν,h为普朗克常数,ν为光频。光子通量则相应于光强。外光电效应由爱因斯坦光电效应方程描述: EK=hν -W 当光子能量等于或大于逸出功时才能产生外光电效应。因此每一种物体都有一个对应于光电效应的光频阈值,称为红限频率。对于红限频率以上的入射光,外生光电流与光强成正比。 内光电效应是指在光线作用下,物体的导电性能发生变化或产生光生电动势的效应,分为光电导效应和光生伏特效应两类。光电导效应是指,半导体材料在光照下禁带中的电子受到能量不低于禁带宽度的光子的激发而跃迁到导带,从而增加电导率的现象。能量对应于禁带宽度的光子的波长称光电导效应的临界波长。光生伏特效应指光照使不均匀半导体或半导体与金属结合的不同部位之间产生电位差的现象。 光生伏特效应首先是由光子转化为电子、光能量转化为电能量的过程;其次,是形成电压过程。可分为势垒效应(结光电效应)和侧向光电效应。势垒效应的机理是在金属和半导体的接触区(或在PN结)中,电子受光子的激发脱离势垒(或禁带)的束缚而产生电子空穴对,在阻挡层内电场的作用下电子移向N区外侧,空穴移向 P区外侧,形成光生电动势。侧向光电效应是当光电器件敏感面受光照不均匀时,受光激发而产生的电子空穴对的浓度也不均匀,电子向未被照射部分扩散,引起光照部分带正电、未被光照部分带负电的一种现象。
光感式传感器原理及其应用完整版
光感式传感器原理及其 应用 HEN system office room 【HEN16H-HENS2AHENS8Q8-HENH1688】
机电工程系 传感器与检测技术学习报告 专业班级:生产过程自动化14-2 姓名:张鹏宇 学号: 项目名称:光感式传感器的应用与发展 指导教师:刘辉 评定成绩: 2015年12月15日 摘要:光电式传感器是以光电器件作为转换元件的传感器。它可用于检测光量变化或 直接引起光量变化的非电量,也可用于检测能转换成光量变化的其他非电量。它首先 把被测量的变化转换成光信号的变化,然后借助光电元件进一步将光信号转换成电信 号。光电式传感器具有响应快、精度高、能实现非接触测量等优点,而且可测参数 多,传感器的结构简单,形式灵活多样,因此,光电式传感器在检测和控制领域应用 非常广泛。 关键词:光电式传感器;检测光量变化;电信号;检测与控制。 1 前言 传感器是将感受的物理量、化学量等信息,按一定规律转换成便于测量和传输的 信号的装置。电信号易于传输和处理,所以大多数的传感器是将物理量等信息转换成 电信号输出的。例如传声器就是一种传感器,它感受声音的强弱,并转换成相应的电 信号。又如电感式位移传感器能感受位移量的变化,并把它转换成相应的电信号。 光电测量时不与被测对象直接接触,光束的质量又近似为零,在测量中不存在摩 擦和对被测对象几乎不施加压力。因此在许多应用场合,光电式传感器比其他传感器 有明显的优越性。 2 光电式传感器工作原理 光电效应 光电效应是光照射到某些物质上,使该物质的导电特性发生变化的一种物理现 象,可分为外光电效应、内光电效应和光生伏特效应(光生伏特效应包含于内光电效 应,在此为特意列出)三类。
光电传感器原理及应用
光电传感器原理及应用 院系:电气与机械工程学院 班 级: 13级电气2班 姓 名: 李 刚 学号: 131050147 PINGDINGSHANUNIVERSITY
前言 随着科技的发展,人类越来越注重信息和自动化,在日常的生产学习过程中,人们常常要进行自动筛选、自动传送,安全防护,而为了实现这些,光电传感发挥了不可磨灭的作用。光敏传感器的物理基础是光电效应,即光敏材料的电学特性因受到光的照射而发生变化。 光电传感器的原理 理论基础——光电效应 光电效应通常分为外光电效应和内光电效应两大类。外光电效应是指在光照射下,电子逸出物体表面的外发射的现象,也称光电发射效应,基于这种效应的光电器件有光电管、光电倍增管等。内光电效应是指入射的光强改变物质导电率的物理现象,称为光电导效应,大多数光电控制应用的传感器,如光敏电阻、光敏二极管、光敏三极管、硅光电池、光电耦合器件等都属于内光电效应类传感器。 1.外光电效应 光照在照在光电材料上,材料表面的电子吸收的能量,若电子吸收的能量足够大,电子会克服束缚逸出表面,从而改变光电子材料的导电性,这种现象成为外光电效应。 根据爱因斯坦的光电子效应,光子是运动着的粒子流,每种光子的能量为hv(v 为光波频率,h 为普朗克常数),由此可见不同频率的光子具有不同的能量,光波频率越高,光子能量越大。假设光子的全部能量交给光子,电子能量将会增加,增加的能量一部分用于克服正离子的束缚,另一部分转换成电子能量。根据能量守恒定律: 式中,m 为电子质量,v 为电子逸出的初速度,w 为逸出功。 由上式可知,要使光电子逸出阴极表面的必要条件是hv>w 。由于不同材料具有不同的逸出功,因此对每一种阴极材料,入射光都有一个确定的频率限,当入射光的频率低于此频率限时,不论光强多大,都不会产生光电子发射,此频率限称 为“红限”。相应的波长为 式中,c 为光速,w 为逸出功。 2.内光电效应 在光线作用下,物体的导电性能发生变化或产生光电电动势的效应称为内光电效应。内光电效应可分为以下两类: (1)光电导效应 在光线作用下,对于半导体材料吸收了入射光子能量,若光子能量大于或等于半导体材料的禁带宽度,就激发出电子—空穴对,使载流子浓度增加,半导体的导电性增加,阻值减低,这种现象称为光电导效应。光敏电阻就是基于这种效应的光电器件。 (2)光生伏特效应 在光线的作用下能够使物体产生一定方向的电动势的现象称为光生伏特效应。基于该效应的光电器件有光电池。 w hv -=2mv 21w hc K =λ
光感式传感器原理及其应用
机电工程系 传感器与检测技术学习报告 专业班级:生产过程自动化14-2 姓名:张鹏宇 学号:2014060319 项目名称:光感式传感器的应用与发展指导教师:刘辉 评定成绩:
2015年12月15日 摘要:光电式传感器是以光电器件作为转换元件的传感器。它可用于检测光量变化或直接引起光量变化的非电量,也可用于检测能转换成光量变化的其他非电量。它首先把被测量的变化转换成光信号的变化,然后借助光电元件进一步将光信号转换成电信号。光电式传感器具有响应快、精度高、能实现非接触测量等优点,而且可测参数多,传感器的结构简单,形式灵活多样,因此,光电式传感器在检测和控制领域应用非常广泛。 关键词:光电式传感器;检测光量变化;电信号;检测与控制。 1 前言 传感器是将感受的物理量、化学量等信息,按一定规律转换成便于测量和传输的信号的装置。电信号易于传输和处理,所以大多数的传感器是将物理量等信息转换成电信号输出的。例如传声器就是一种传感器,它感受声音的强弱,并转换成相应的电信号。又如电感式位移传感器能感受位移量的变化,并把它转换成相应的电信号。 光电测量时不与被测对象直接接触,光束的质量又近似为零,在测量中不存在摩擦和对被测对象几乎不施加压力。因此在许多应用场合,光电式传感器比其他传感器有明显的优越性。 2 光电式传感器工作原理 2.1 光电效应 光电效应是光照射到某些物质上,使该物质的导电特性发生变化的一种物理
现象,可分为外光电效应、内光电效应和光生伏特效应(光生伏特效应包含于内光电效应,在此为特意列出)三类。 外光电效应是指在光线作用下,物体内的电子逸出物体表面向外发射的现象。光子是以量子化“粒子”的形式对可见光波段内电磁波的描述。光子具有能量hν,h为普朗克常数,ν为光频。光子通量则相应于光强。外光电效应由爱因斯坦光电效应方程描述: EK=hν-W 当光子能量等于或大于逸出功时才能产生外光电效应。因此每一种物体都有一个对应于光电效应的光频阈值,称为红限频率。对于红限频率以上的入射光,外生光电流与光强成正比。 内光电效应是指在光线作用下,物体的导电性能发生变化或产生光生电动势的效应,分为光电导效应和光生伏特效应两类。光电导效应是指,半导体材料在光照下禁带中的电子受到能量不低于禁带宽度的光子的激发而跃迁到导带,从而增加电导率的现象。能量对应于禁带宽度的光子的波长称光电导效应的临界波长。光生伏特效应指光照使不均匀半导体或半导体与金属结合的不同部位之间产生电位差的现象。 光生伏特效应首先是由光子转化为电子、光能量转化为电能量的过程;其次,是形成电压过程。可分为势垒效应(结光电效应)和侧向光电效应。势垒效应的机理是在金属和半导体的接触区(或在PN结)中,电子受光子的激发脱离势垒(或禁带)的束缚而产生电子空穴对,在阻挡层内电场的作用下电子移向N区外侧,空穴移向P区外侧,形成光生电动势。侧向光电效应是当光电器件敏感面受光照不均匀时,受光激发而产生的电子空穴对的浓度也不均匀,电子向未被照射部
传感器原理与应用习题第8章光电式传感器
《传感器原理与应用》及《传感器与测量技术》习题集与部分参考答案 教材:传感器技术(第3版)贾伯年主编,及其他参考书 第8章光电式传感器 8-1 简述光电式传感器的特点和应用场合,用方框图表示光电式传感器的组成。 8-2 何谓外光电效应、光电导效应和光生伏特效应? 答:外光电效应:在光线的作用下,物体内的电子逸出物体表面向外发射的现象。 光电导效应:在光线作用下,电子吸收光子能量从键合状态过渡到自由状态,而引起材料电导率的变化的现象。 光生伏特效应:在光线作用下能够使物体产生一定方向的电动势的现象。 8-3 试比较光电池、光敏晶体管、光敏电阻及光电倍增管在使用性能上的差别。 答:光电池:光电池是利用光生伏特效应把光直接转变成电能的器件。它有较大面积的PN结,当光照射在PN结上时,在结的两端出现电动势。当光照到PN结区时,如果光子能量足够大,将在结区附近激发出电子-空穴对,在N区聚积负电荷,P区聚积正电荷,这样N区和P区之间出现电位差。 8-4 通常用哪些主要特性来表征光电器件的性能?它们对正确选用器件有什么作用? 8-5 怎样根据光照特性和光谱特性来选择光敏元件?试举例说明。 答:不同类型光敏电阻光照特性不同,但光照特性曲线均呈非线性。因此它不宜作定量检测元件,一般在自动控制系统中用作光电开关。 光谱特性与光敏电阻的材料有关,在选用光敏电阻时,应把光敏电阻的材料和光源的种类结合起来考虑,才能获得满意的效果。 8-6 简述CCD图像传感器的工作原理及应用。 8-7 何谓PSD?简述其工作原理及应用。 8-8 说明半导体色敏传感器的工作原理及其待深入研究的问题。 8-9 试指出光电转换电路中减小温度、光源亮度及背景光等因素变动引起输出信号漂移应采取的措施。 8-10 简述光电传感器的主要形式及其应用。 答:模拟式(透射式、反射式、遮光式、辐射式)、开关式。 应用:光电式数字转速表、光电式物位传感器、视觉传感器、细丝类物件的在线检测。 8-11 举出你熟悉的光电传感器应用实例,画出原理结构图并简单说明原理。 8-12 试说明图8-33(b)所示光电式数字测速仪的工作原理。(1)若采用红外发光器件为光源,虽看不见灯亮,电路却能正常工作,为什么?(2)当改用小白炽灯作光源后,却不能正常工作,试分析原因。
光电式传感器的工作原理
光电式传感器的工作原理 来源:电子资料文库作者:发布时间:2013-5-4 浏览(9113)次光电式传感器的英文解释:photoelectric transducer 光电传感器的构成 光电传感器由光源、光学通路、光电元件构成。 光电式传感器应用 1、光量变化的非电量; 2、能转换成光量变化的其他非电量。 光电式传感器的应用可归纳为四种基本形式,即辐射式(直射式)、吸收式、遮光式、反射式。 光电式传感器特点 非接触、响应快、性能可靠。 图a所示是光电式传感器的工作原理图,位于光敏二极管的对面的是作为光源的发光二极管,在它们之间有一个能断续遮光的转盘。当转盘上的缺口、缝隙或小孔对准发光二极管时,光线可以通过,光敏二极管即发出信号指示转轴的某一位置或转速。它输出的信号是方波脉冲,故它能适应数字式控制系统的需要。这里的发光二极管的发光频率一般在红外线和紫外线范围内,是肉眼看不见的。 图b、c所示为六缸发动机用分电器内的光电式曲轴转角传感器的结构,由发光二极管和光敏二极管组合来计测带缝隙的转盘的旋转位置,安装在分电器内(或凸轮轴前部)。它决定分组喷射控制及电子点火控制曲轴每转两转的喷油正时和点火正时。在转盘上每隔60°设置了宽度不同的4种缝隙,利用发光二极管发出的光束,经过安装在分电器轴上转盘的刻度缝隙,照射在光敏二极管上,使波形电路产生电信号、并传给ECU。 光电式曲轴转角传感器的工作原理与结构 a)工作原理图b)结构图c)转盘 1-输出信号2-光敏二极管3-发光二极管4-电源5-转盘6-转子头盖7-
密封盖8-波成形电路9-第一缸120°信号缝隙10-10信号缝隙11-120°信号缝隙 光电效应 它是光照射到某些物质上,使该物质的电特性发生变化的一种物理现象,可分为外光电效应和内光电效应两类。外光电效应是指,在光线作用下物体内的电子逸出物体表面向外发射的物理现象。光子是以量子化“粒子”的形式对可见光波段内电磁波的描述。光子具有能量hv,h为普朗克常数,v为光频。光子通量则相应于光强。外光电效应由爱因斯坦光电效应方程描述:hv=1/2*mv0的平方式中m为电子质量,v0为电子逸出速度。当光子能量等于或大于逸出功时才能产生外光电效应。因此每一种物体都有一个对应于光电效应的光频阈值,称为红限频率。对于红限频率以上的入射光,外生光电流与光强成正比。内光电效应又分为光电导效应和光生伏打效应两类。光电导效应是指,半导体材料在光照下禁带中的电子受到能量不低于禁带宽度的光子的激发而跃迁到导带,从而增加电导率的现象。能量对应于禁带宽度的光子的波长称光电导效应的临界波长。光生伏打效应是指光线作用能使半导体材料产生一定方向电动势的现象。光生伏打效应又可分为势垒效应(结光电效应)和侧向光电效应。势垒效应的机理是在金属和半导体的接触区(或在PN结)中,电子受光子的激发脱离势垒(或禁带)的束缚而产生电子空穴对,在阻挡层内电场的作用下电子移向N区外侧,空穴移向P区外侧,形成光生电动势。侧向光电效应是当光电器件敏感面受光照不均匀时,受光激发而产生的电子空穴对的浓度也不均匀,电子向未被照射部分扩散,引起光照部分带正电、未被光照部分带负电的一种现象。 光电式传感器分类 基于外光电效应的光电敏感器件有光电管和光电倍增管。基于光电导效应的有光敏电阻。基于势垒效应的有光电二极管和光电三极管(见半导体光敏元件)。基于侧向光电效应的有反转光敏二极管。光电式传感器还可按信号形式分为模拟式光电传感器(见位移传感器)和数字式光电传感器(见转速传感器、光栅式传感器、数字式传感器)。光电式传感器还有光纤传感器、固体图像传感器等。 光电传感器的构成 光电开关是通过把光强度的变化转换成电信号的变化来实现控制的。 光电传感器在一般情况下,有三部分构成,它们分为:发送器,接收器和检测电路。
光电传感器工作原理及结构分析
光电传感器工作原理及结构分析 摘要:光电传感器的工作原理是通过把光强度的变化转换成电信号的变化,从而实现控制的。光电开关是一种小型电子设备,可以检测出其接收到光强的变化。光电传感器通常由三部分构成,它们分别为:发送器、接收器和检测电路。 关键字:接收器, 光电传感器, 半导体光源 光电传感器的工作原理是通过把光强度的变化转换成电信号的变化,从而实现控制的。光电开关是一种小型电子设备,可以检测出其接收到光强的变化。光电传感器通常由三部分构成,它们分别为:发送器、接收器和检测电路。 发射器带一个校准镜头,将光聚焦射向接收器,接收器出电缆将这套装置接到一个真空管放大器上。在金属圆筒内有一个小的白炽灯做为光源,这些小而坚固的白炽灯传感器就是如今光电传感器的雏形。来源:大比特半导体器件网发送器对准目标发射光束,发射的光束一般来源于半导体光源,发光二极管(LED)、激光二极管及红外发射二极管。光束不间断地发射,或者改变脉冲宽度。 接收器有光电二极管、光电三极管及光电池组成。在接收器的前面,装有光学元件如透镜和光圈等。在其后面是检测电路,它能滤出有效信号和应用该信号。光敏二极管是现在最常见的传感器。光电传感器光敏二极管的外型与一般二极管一样,只是它的管壳上开有一个嵌着玻璃的窗口,以便于光线射入,为增加受光面积,PN结的面积做得较大,光敏二极管工作在反向偏置的工作状态下,并与负载电阻相串联,当无光照时,它与普通二极管一样,反向电流很小称为光敏二极管的暗电流;当有光照时,载流子被激发,产生电子-空穴,称为光电载流子。 在外电场的作用下,光电载流子参于导电,形成比暗电流大得多的反向电流,该反向电流称为光电流。光电流的大小与光照强度成正比,于是在负载电阻上就能得到随光照强度变化而变化的电信号。来源:大比特半导体器件网光电开关光敏三极管除了具有光敏二极管能将光信号转换成电信号的功能外,还有对电信号放大的功能。光敏三级管的外型与一般三极管相差不大,一般光敏三极管只引出两个极——发射极和集电极,基极不引出,管壳同样开窗口,以便光线射入。为增大光照,基区面积做得很大,发射区较小,入射光主要被基区吸收。工作时集电结反偏,发射结正偏。在无光照时管子流过的电流为暗电流Iceo=(1+β)Icbo,比一般三极管的穿透电流还小;当有光照时,激发大量的电子
光感式传感器原理及其应用
光感式传感器原理及其应 用 Revised by BLUE on the afternoon of December 12,2020.
机电工程系 传感器与检测技术学习报告 专业班级:生产过程自动化14-2 姓名:张鹏宇 学号: 19 项目名称:光感式传感器的应用与发展 指导教师:刘辉 评定成绩: 2015年12月15日
摘要:光电式传感器是以光电器件作为转换元件的传感器。它可用于检测光量变化或直接引起光量变化的非电量,也可用于检测能转换成光量变化的其他非电量。它首先把被测量的变化转换成光信号的变化,然后借助光电元件进一步将光信号转换成电信号。光电式传感器具有响应快、精度高、能实现非接触测量等优点,而且可测参数多,传感器的结构简单,形式灵活多样,因此,光电式传感器在检测和控制领域应用非常广泛。 关键词:光电式传感器;检测光量变化;电信号;检测与控制。 1 前言 传感器是将感受的物理量、化学量等信息,按一定规律转换成便于测量和传输的信号的装置。电信号易于传输和处理,所以大多数的传感器是将物理量等信息转换成电信号输出的。例如传声器就是一种传感器,它感受声音的强弱,并转换成相应的电信号。又如电感式位移传感器能感受位移量的变化,并把它转换成相应的电信号。 光电测量时不与被测对象直接接触,光束的质量又近似为零,在测量中不存在摩擦和对被测对象几乎不施加压力。因此在许多应用场合,光电式传感器比其他传感器有明显的优越性。 2 光电式传感器工作原理 光电效应 光电效应是光照射到某些物质上,使该物质的导电特性发生变化的一种物理现象,可分为外光电效应、内光电效应和光生伏特效应(光生伏特效应包含于内光电效应,在此为特意列出)三类。 外光电效应是指在光线作用下,物体内的电子逸出物体表面向外发射的现象。光子是以量子化“粒子”的形式对可见光波段内电磁波的描述。光子具有能量hν,h为普朗克常数,ν为光频。光子通量则相应于光强。外光电效应由爱因斯坦光电效应方程描述: EK=hν -W 当光子能量等于或大于逸出功时才能产生外光电效应。因此每一种物体都有一个对应于光电效应的光频阈值,称为红限频率。对于红限频率以上的入射光,外生光电流与光强成正比。 内光电效应是指在光线作用下,物体的导电性能发生变化或产生光生电动势的效应,分为光电导效应和光生伏特效应两类。光电导效应是指,半导体材料在光照下禁带中的电子受到能量不低于禁带宽度的光子的激发而跃迁到导带,从而增加电导率的现象。能量对应于禁带宽度的光子的波长称光电导效应的临界波长。光生伏特效应指光照使不均匀半导体或半导体与金属结合的不同部位之间产生电位差的现象。 光生伏特效应首先是由光子转化为电子、光能量转化为电能量的过程;其次,是形成电压过程。可分为势垒效应(结光电效应)和侧向光电效应。势垒效应的机理是在金属和半导体的接触区(或在PN结)中,电子受光子的激发脱离势垒(或禁带)的束缚而产生电子空穴对,在阻挡层内电场的作用下电子移向N区外侧,空穴移向 P区外侧,形成光生电动势。侧向光电效应是当光电器件敏感面受光照不均匀时,受光激发而产生的电子空穴对的浓度也不均匀,电子向未被照射部分扩散,引起光照部分带正电、未被光照部分带负电的一种现象。
光学传感器的原理及应用领域
光学传感器的原理 发光二极管照亮采样表面,对比度强烈的待采样影像通过透镜在cmos上成像,cmos将光学影像转化为矩阵电信号传输给dsp,dsp则将此影像信号与存储的上一采样周期的影像进行比较分析,然后发送一个位移距离信号到接口电路。接口电路对由dsp发来的位移信号进行整合处理,而已传入计算机内部的位移信号再经过驱动程序的进一步处理,最终在系统中形成光标的位移。 光学传感器的应用领域 磁光效应传感器的原理主要是利用光的偏振状态来实现传感器的功能。当一束偏振光通过介质时,若在光束传播方向存在着一个外磁场,那么光通过偏振面将旋转一个角度,这就是磁光效应。也就是可以通过旋转的角度来测量外加的磁场。在特定的试验装置下,偏转的角度和输出的光强成正比,通过输出光照射激光二极管ld,就可以获得数字化的光强,这样就可以用来测量特定的物理量。 环境光传感器近年来在消费电子产品中得到广泛的应用,它可以用来感知周围光线情况,并告知处理芯片自动调节显示器背光亮度,降低产品的功耗。例如,在手机、笔记本等移动应用中,显示器消耗的电量高达电池总电量的30%,采用环境光传感器可以最大限度地延长电池的工作时间。另一方面,环境光传感器有助于显示器提供柔和的画面。当环境亮度较高时,使用环境光传感器的液晶显示器会自动调成高亮度。当外界环境较暗时,显示器就会调成低亮度,实现自动调节亮度。 光学传感器是光电鼠标的核心部件,“cmos感光器”和“数字信号处理器(dsp)”是其中最重要的两部分。cmos感光器是一个由数百个光电器件组成的矩阵,恰似一部相机,用来拍摄鼠标物理位移的画面。光学传感器会将拍摄的光信号进行放大并投射到cmos矩阵上形成帧,然后再将成帧的图像由光信号转换为电信号,传输至数字信号处理器进行处理。dsp对相邻帧之间差别进行除噪和分析后,将得出的位移信息通过接口电路传给计算机。 艾驰商城是国内最专业的MRO工业品网购平台,正品现货、优势价格、迅捷配送,是一站式采购的工业品商城!具有10年工业用品电子商务领域研究,以强大的信息通道建设的优势,以及依托线下贸易交易市场在工业用品行业上游供应链的整合能力,为广大的用户提供了传感器、图尔克传感器、变频器、断路器、继电器、PLC、工控机、仪器仪表、气缸、五金工具、伺服电机、劳保用品等一系列自动化的工控产品。 如需进一步了解图尔克、奥托尼克斯、科瑞、山武、倍加福、邦纳、亚德客、施克等各类传感器的选型,报价,采购,参数,图片,批发信息,请关注艾驰商城https://www.360docs.net/doc/5316731210.html,/
光电传感器原理
光电传感器原理 2007年05月21日星期一13:44 1.光电传感器原理 光电传感器是指能够将可见光转换成某种电量的传感器。光敏二极管是最常见的光传感器。光敏二极管的外型与一般二极管一样,只是它的管壳上开有一个嵌着玻璃的窗口,以便于光线射入,为增加受光面积,PN结的面积做得较大,光敏二极管工作在反向偏置的工作状态下,并与负载电阻相串联,当无光照时,它与普通二极管一样,反向电流很小(<μA),称为光敏二极管的暗电流;当有光照时,载流子被激发,产生电子-空穴,称为光电载流子。在外电场的作用下,光电载流子参于导电,形成比暗电流大得多的反向电流,该反向电流称为光电流。光电流的大小与光照强度成正比,于是在负载电阻上就能得到随光照强度变化而变化的电信号。 光敏三极管除了具有光敏二极管能将光信号转换成电信号的功能外,还有对电信号放大的功能。光敏三级管的外型与一般三极管相差不大,一般光敏三极管只引出两个极——发射极和集电极,基极不引出,管壳同样开窗口,以便光线射入。为增大光照,基区面积做得很大,发射区较小,入射光主要被基区吸收。工作时集电结反偏,发射结正偏。在无光照时管子流过的电流为暗电流Iceo=(1+β)Icbo(很小),比一般三极管的穿透电流还小;当有光照时,激发大量的电子-空穴对,使得基极产生的电流Ib增大,此刻流过管子的电流称为光电流,集电极电流Ic=(1+β)Ib,可见光电三极管要比光电二极管具有更高的灵敏度 2.光电传感器应用 光电传感器是一种小型电子设备,它可以检测出其接收到的光强的变化。早期的用来检测物体有无的光电传感器是一种小的金属圆柱形设备,发射器带一个校准镜头,将光聚焦射向接收器,接收器出电缆将这套装置接到一个真空管放大器上。在金属圆筒内有一个小的白炽 灯做为光源。这些小而坚固的白炽灯传感器就是今天光电传感器的雏形。 LED(发光二极管) 发光二极管最早出现在19世纪60年代,现在我们可以经常在电气和电子设备上看到这些二极管做为指示灯来用。LED就是一种半导体元件,其电气性能与普通二极管相同,不同之处在于当给LED通电流时,它会发光。由于LED是固态的,所以它能延长传感器的使用寿命。因而使用LED的光电传感器能被做得更小,且比白炽灯传感器更可靠。不象白炽灯那样,LED抗震动抗冲击,并且没有灯丝。另外,LED所发出的光能只相当于同尺寸白炽灯所产生光能的 一部分。(激光二极管除外,它与普通LED的原理相同,但能产生几倍的光能,并能达到更远的检测距离)。LED能发射人眼看不到的红外光,也能发射可见的绿光、黄光、红光、蓝光、蓝绿光或白光。 经调制的LED传感器 1970年,人们发现LED还有一个比寿命长更好的优点,就是它能够以非常快的速度来开关,开关速度可达到KHz。将接收器的放大器调制到发射器的调制频率,那么它就只能对以此频率振动的光信号进行放大。 我们可以将光波的调制比喻成无线电波的传送和接收。将收音机调到某台,就可以忽略其他 的无线电波信号。经过调制的LED发射器就类似于无线电波发射器,其接收器就相当
光电传感器及原理.
《光电传感器及原理》课程设计报告 设计名称 :光电式转速测量传感器 专业: 成员姓名: 成员学号: 指导老师: 光电式转速测量传感器 一、光电式转速传感器工作原理框图: 二、光电式转速传感器工作原理 <一 >直射式是在待测转速轴上固定一带孔的调制盘, 在调制盘一边有激光器产生一恒定光源, 透过盘上的小孔到达光敏二极管组成的光电转换器上, 转换成相应的电脉冲信号, 经过放大整形电路输出整齐的脉冲信号, 脉冲信号由计数装置计数, 则通过计算可知该转速轴的转速。
光电直射数字式转数表原理图 <二 >反射式是在待测转速的轴上固定一个涂有黑白相间条纹的圆盘,他们具有较大的反射率差,当轴转动时,反光与不反光交替出现,光敏间断的接受反射信号,转换成脉冲信号,经过放大整形电路输出整齐的脉冲信号, 脉冲信号由计数装置计数, 则通过计算可知该转速轴的转速。 光电反射数字式转数表原理图 三、电路设计 每分钟转速 n 与脉冲频率 f 的关系如下: n=60*f / N 式中N为转盘上的空数或白条纹数例如:空数 N=60 ,光电转换器的输出脉冲号频率为 4.8KHZ ,
则 n=60*f / N=4800r/min 四、光电转速传感器优点 1、光电转速传感器为非接触式转速表 光电转速传感器采用光学原理制造,属于非接触式转速测量仪表,它的测量距离一般可达 200mm 左右。光电转速传感器的测量无需与被测量对象接触,不会对被测量轴形成额外的负载,因此光电转速传感器的测量误差更小,精度更高。 2、光电转速传感器的结构紧凑
光电转速传感器的结构紧凑, 主要由投射光线部件、接收光线部件也就是光敏元件和放大元件等组成,因此光电转速传感器的体积设计小巧、内部结构精致,一般重量不会超过 200g , 非常便于使用者的携带、安装和使用。 3、光电转速传感器的抗干扰性好 光电转速传感器多采用 LED 作为光线投射部件,极少会出现光线停顿的情况,也不会存在灯泡烧毁等故障危险。另外, 光电转速传感器的光源都是经过特殊方式调制的, 有极强的抗干扰能力,不会受普通光线的干扰。 4、光电转速传感器的测量能力好 光电转速传感器的可采用光纤封装, 可于测量微小的物体, 特别是微小旋转体的测量, 特别适用于高精密、小元件的机械设备测量。光电转速传感器的运行稳定, 有良好的可靠性, 测量的精度较高,能满足使用者的测量要求。