SSC of MAXI experiment

a r X i v :a s t r o -p h /0107445v 1 23 J u l 2001
SSC of MAXI experiment
M.Sakano 1,H.Tomida 1,M.Matsuoka 1,S.Ueno 1,S.Komatsu 1,Y.Shirasaki 1,M.Sugizaki 1,K.Torii 1,W.Yuan 1,E.Miyata 2,1,H.Tsunemi 2,1,T.Kamazuka 2,C.Natsukari 2,M.Jobashi 3,
I.Tanaka 4,N.Kawai 5,6,1,T.Mihara 6,1,H.Negoro 6and A.Yoshida 7,6,1
1
SURP/NASDA,2-1-1Sengen,Tsukuba,Ibaraki 305-8505,Japan
2
Dept.of Earth and Space Science,Osaka University,1-1Machikaneyama,Toyonaka,Osaka 560-0043,Japan
3
ICRR,University of Tokyo,5-1-5Kashiwa-no-Ha,Kashiwa City,Chiba 277-8582,Japan 4
The Graduate University for Advanced Studies,Hayama-chou,Miura,Kanagawa 240-0193,Japan 5
Dept.of Physics,Tokyo Institute of Technology,2-12-1Ookayama,Meguro-ku,Tokyo 152-8551,Japan
6
Cosmic Radiation Laboratory,RIKEN,2-1Hirosawa,Wako,Saitama 351-0198,Japan
7
Dept.of Physics,College of Science &Engineering,
Aoyama Gakuin University,6-16-1Chitosedai,Setagaya,Tokyo 157-8572,Japan
E-mail(MS):sakano@https://www.360docs.net/doc/8e6683993.html,sc.nasda.go.jp
Abstract
Monitor of All-sky X-ray Image (MAXI)on the International Space Station (ISS)has two kinds of X-ray detectors:the Gas Slit Camera (GSC)and the Solid-state Slit Camera (SSC).SSC is an X-ray CCD array,consisting of 16chips,which has the best energy resolution as an X-ray all-sky monitor in the energy band of 0.5to 10keV.Each chip consists of 1024×1024pixels with a pixel size of 24μm,thus the total area is ~200cm 2.We have developed an engineering model of SSC,i.e.,CCD chips,electronics,the software and so on,and have constructed the calibration system.We here report the current status of the development and the calibration of SSC.
Key words:X-ray:detectors —detectors:CCD —SSC —International Space Station (ISS)
1.MAXI
Monitor of All-sky X-ray Image (MAXI:Matsuoka et al.1997a,1997b,1999;Kawai et al.1999;Mihara et al.1999,2000;Torii et al.1999;Tomida et al.2000a;Mihara et al.2001b in this proceeding)is one of the ?rst payloads of Japanese Experiment Module (JEM or KIBO)/Exposed Facility on the International Space Sta-tion (ISS).In one orbit of the ISS with 90minutes,MAXI covers the whole sky.It is ?nally expected to monitor activities of about 2000–3000X-ray sources with the lim-iting sensitivity of up to 1mCrab (for detail,see Yuan et al.2001in this proceeding).The observation is sched-uled to start in the beginning of 2005and continue for two years.
MAXI consists of two kinds of X-ray detectors:the Gas Slit Camera (GSC:Mihara et al.2001a,2001b)and the Solid-state Slit Camera (SSC:Torii et al.1999;Miy-ata et al.1999,2000;Tomida et al.2000b;Kamazuka et al.2001).The X-ray detector of the SSC is a CCD ar-ray,whereas that of the GSC is gas proportional counter.Hence,SSC has better energy resolution,and better de-tection e?ciency in the soft energy band.We here report on the current status of the development of SSC.
2.SSC
2.1.Overview of SSC camera
MAXI has two SSC cameras (for the arrangement,see Mihara et al.2001b in this proceeding),each of which is identical.Each SSC consists of an array of 16CCD chips.The whole SSC is developed by NASDA and Os-aka University.The principle of determining positions with a slit camera is found in Matsuoka et al.(1997a),Tomida et al.(2000a),and Mihara et al.(2001b)in this proceeding.
The schematic view of SSC is given in Fig.2.SSC consists of three main parts:SSC Unit (SSCU),SSC Electronics (SSCE),and Data Processor (DP).The CCD chips and pre-ampli?ers are contained in SSCU.The ana-logue signal generated in SSCU is digitized in SSCE,then,handled in DP,and sent to the telemetry as data packets (see section 2.3.).
https://www.360docs.net/doc/8e6683993.html,D
The chips for SSC are developed by Hamamatsu Photon-ics K.K.and Osaka University.Table 1lists the details of the CCD chip.The X-ray detection area is 25×25mm 2for 1-chip,accordingly 200cm 2in total (for 2SSCs).Since SSC is a slit camera,the CCD needs only one-
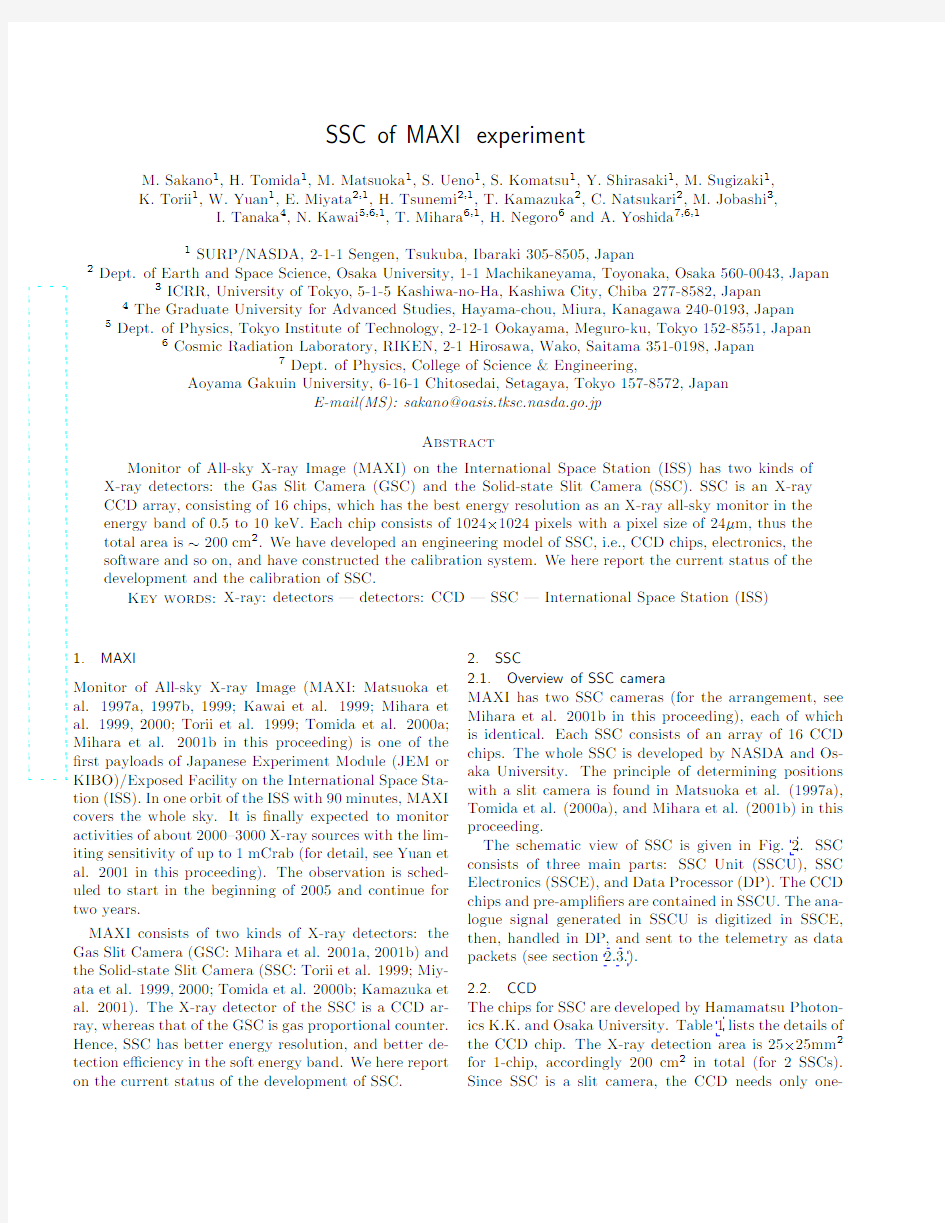
opened
Cover (NOTE: Only 3 chips are mounted at present.)
X?ray
SSC EM
(Engineering model)
Fig.1.The SSC EM where slat collimators are removed.Only 3chips in 16are currently mounted.
Data Processor (DP)
multi plexer
SSC Electronics (SSCE)
SSC Unit (SSCU)
command
12bit data
CCD readout board
radiator X-rays
heat
heat pipe Fig.2.Schematic view of SSC.
Table1.details of MAXI-CCD chip
Parameters Present Goal Unit clocking pattern2phase,full frame transfer
front/back-side front-side illumination
optical?lter by Al coating
?:The thickness of depletion layer of the chips mounted on EM is less than20μm.However,we have already developed the chips with the depletion-layer thickness of40μm.
?:FWHM at5.9keV.
dimensional image;therefore,we adopt full-frame trans-fer type for the CCD chips of SSC.To block the optical light,aluminium(Al)is evaporated on the surface of the CCD chips.Whereas a large shock is generally expected in launch operation,this Al-coating method is tough for the shock,and accordingly makes it possible to design a simple structure for the whole camera.Note that this Al-coating also can minimize the radiative heat-input to the CCD chip.
X-ray CCDs must be cooled.To do this,we com-bine passive radiators,loop heat pipes(LHP)with liq-uid propylene fabricated by Swales K.K.,and Peltier cooler buried in each CCD chip.The power consumed by Peltier cooler is~1W/CCD,which can make the tem-perature di?erence on hot and cold sides in the Peltier cooler to be?T=40?C.We expect that the hot side of the Peltier cooler can be cooled down to?20?C by LHP and the radiator,hence the CCD temperature of?60?C will be achieved.However,there may still remain some problems,which is being studied;e.g.,the thermal envi-ronment around MAXI in the ISS is not completely?xed, or the condition in which the LHP works has not been well understood,yet.The detailed discussion is found in Tomida et al.(2000b).
The radiation damage is one of the most critical prob-lems of the X-ray CCD observation in orbit,as seen in the case of ASCA/SIS(Yamashita et al.1997)and Chandra/ACIS.Although the MAXI mission time of 2years is not long,the accumulated radiation dam-age may cause signi?cant degradation.We are looking for the most e?ective and practical method against this problem,such as the charge injection(CI)method(To-mida et al.1997).Detailed discussion is found in Tomida
et al.(2001b).
2.3.Camera unit(SSCU),Electronics(SSCE),and Data
Processor(DP)
SSCU and SSCE are fabricated by Meisei Electric K.K.,
and DP is,by NEC K.K.SSCE drives the SSCU and
reads analogue signals from SSCU;since each SSCU has16CCDs,SSCE reads out the signals from those
CCDs one after another by switching multiplexers in each SSCU.Then,SSCE digitizes the signal data into
12-bit data,and transfers them to DP.
We have tried three readout methods(for each pixel) in SSCE:integration,delay,and correlated double sam-
pling(CDS).The respective methods are used in Chan-dra/ACIS and ASTRO-E/XIS(Hayashida et al.1999),
in ASCA/SIS(Burke et al.1994),and in commercially
available(optical)CCDs.We recorded the best perfor-mance with the integration method,hence adopted it. The signal charges along the same columns in each chip are summed up like the fast mode in ASCA/SIS
(Burke et al.1994)or the P-sum mode of ASTRO-E/XIS
(Hayashida et al.1999)because only one-dimension po-sitional information is required.In default,charges of16
pixels are summed up,where we can indicate the num-
ber of bins by the command.The readout speed is125 kHz;accordingly the readout time for all the16chips is
~9sec in the default binning.
The algorithm of the data reduction in DP is also al-
most the same as that in the timing mode of ASTRO-
E/XIS.The DP detects events,and sends the position, grade,and the summed pixel-level of each event to the
telemetry.We have the frame-and dark-frame-modes for diagnosis,which are also the same as that of ASTRO-
E/XIS.
2.4.Slit and Collimators
Fig.3shows the schematic view of the slit and the slat
collimator system on SSCU to determine the photon arrival direction.The accuracy of estimated position
mainly depends on the size of the slit;if the slit is nar-
rower,the accuracy is better,but the e?ective area is smaller,and vice versa.The?eld of view of each SSC
is1~2?×90?.The thickness of slat collimators will be ~100μm,which are aligned by~3mm pitch,although these values may be changed.Another point for the po-
sitional accuracy is?atness and non-re?ectivity of the collimator.We are now searching for the best method to hold the?atness and to reduce surface re?ectivity of the collimators.Mihara et al.(2001b)in this proceeding gives further information on this problem.We?nally ex-pect to determine the photon arrival direction with the accuracy of~1?or better.
slat collimators
Fig.3.Schematic view of the slit and the slat collimators of SSC.
3.Calibration
The calibration of CCD chips and the SSC-EM (Engi-neering model)is on-going at NASDA and Osaka Uni-versity.For the ?exible calibration system at Osaka Uni-versity,which aims in particular at the calibration in the lower energy band below 2keV,see Miyata et al.(2000)and Kamazuka et al.(2001).For the higher energy band above 1keV,we use ?uorescent X-rays from var-ious metal elements (Torii et al.1999;Tomida et al.2000b),which is similar to the calibration system for the ASTRO-E /XIS at Kyoto University (Hamaguchi et al.2000).Combining collimators and ?lters,illuminating ?uorescent X-rays from each atom are puri?ed
accord-ing to the method in Hamaguchi et al.(2000).Fig.4shows the SSC-EM set in the vacuum chamber.
Fig.5shows the spectrum of 55Fe K-lines with SSC-EM in the operation at ?60?C,whereas Table 1sum-marizes some important parameters obtained in the cur-rent calibration.We are steadily recording a FWHM of 150eV or better for the energy resolution at 5.9keV where single pixel events are accumulated,6electron (RMS)for the read-out noise,and more than 99.999%ef-?ciency for the CTE (Charge Transfer E?ciency).Note that these values were obtained when we use preliminary chips and EM electronics;the improvement is on-going.We have already developed new chips with much thicker depletion layer of more than 40μm,but have not com-bined it with the SSCE,yet.We have also made the preliminary version of the DP software;now it is being tested.
For the calibration of the collimator,which is impor-tant to determine the arrival direction of each X-ray pho-ton,we will calibrate them using 19m X-ray beam line at NASDA (see Torii et al.1999).The absolute detection
Fig.4.SSC-EM is put in the center of the vacuum chamber.The back-side (upper-left)of SSC is a cold plate,which is cooled by mechanical cooler out of vacuum chamber.X-rays are illumi-nated from lower-left side,which is connected with another vac-uum chamber where an X-ray generator is placed.In addition,a radio isotope 55Fe can be set on the X-stage in front of SSC.
e?ciency will be measured with well-calibrated reference detectors:X-ray proportional counters.We are now fur-ther improving all the SSCU including chips,SSCE,and DP,and will accomplish the SSC ?ight model (FM)until 2004.
4.Summary
We have been developing the CCD camera,SSC,which will be onboard the all-sky X-ray monitor MAXI on ISS/JEM.MAXI has two SSCs,and each SSC has 16CCD chips fabricated by Hamamatsu Photonics K.K.At present,calibration and development of the engineer-ing model of SSC are on-going.We achieved the energy resolution of 150eV for the FWHM at 5.9keV.Another chips with thicker depletion layer of more than 40μm have been developed.We are continuing the develop-ment,and plan to accomplish the ?ight model of SSC until 2004.The start of the MAXI observation is sched-uled in the beginning of 2005.
The authors express their thanks to Dr.M.J.L.Turner for reviewing the manuscript.
References
Burke B.E.et al.1994IEEE Trans.Nuc.Sci.,41,375Hamaguchi K.et al.2000Nucl.Inst.Meth.A,450/2-3,360
Hayashida K.et al.1998proc of SPIE.,3445,278
Kamazuka T.et al.2001proc of “New Century of X-ray Astronomy”,submitted
Kawai N.et al.1999Astron.Nachr.,320,372
Fig.5.SSC-EM spectrum of Mn K-lines(55Fe).The FWHM of the main peak at5.9keV is150eV,where the statistical uncertainty is quite small,~0.1eV.
Matsuoka M.et al.1997a Proc of All-sky X-ray Obser-
vations in the Next Decade,eds.M.Matsuoka,N.
Kawai(Published by RIKEN),249
Matsuoka M.et al.1997b proc of SPIE.,3114,414
Matsuoka M.et al.1999Astron.Nachr.,320,275
Mihara T.et al.2000Advances in Space Research,25(3-
4),897
Mihara T.et al.2001a proc of“New Century of X-ray
Astronomy”,submitted
Mihara T.et al.2001b in this proceeding
Miyata E.et al.1999Nucl.Instr.Meth.A,436,91
Miyata E.et al.2000proc of SPIE(New Astronomy
2000),4012,186
Tomida H.et al.1997PASJ.,49,389
Tomida H.et al.2000a proc of SPIE(New Astronomy
2000),4012,178
Tomida H.et al.2000b proc of SPIE.,4140,304
Torii K.et al.1999proc of SPIE.,3765,636
Yamashita A.et al.1997IEEE Trans.Nucl.Sci.,44,
847
Yuan W.et al.2001in this proceeding
漏斗实验(Funnel Experiment)
漏斗实验(Funnel Experiment) 在戴明博士四日谈中,以漏斗实验来解释管理与干预问题。管理人员常因缺乏对系统变异的统计思考方式而对系统进行干预,造成问题越变越离谱。譬如,厂内的管理阶层在品质会议中要 求不良率最高的单位提出改善计划或业务会议中要求营业额退步的营业员提出对策。以前国中的 导师每周对学生评分排名,对退步的学生给与严厉的指责警告(现在应该还是一样)。但是以长期 来看不良率依然有高有低;营业额每月仍是有好有坏;学生的排名每周还是有进有退,这些数据 的变异很多是系统的正常变异,也就是所谓共同原因的变异。但是,管理人员对这些变异进行干 预,采取矫正措施,使得系统越变越复杂。例如,制程管理人员隐藏不良品使不良率好看;营业 人员虚报营业额使得帐面上好看;学生到补习班先练习考试题目使得排名进步。以上这些现象在 我们所处的工作或生活环境中屡见不鲜,我们应该先了解系统的变异是来自特殊原因或是共同原 因,再采取适当的行动。 所谓,就是假想我们有一漏斗,装在桌上约半公尺高的架上,桌上有个靶。假设我 们把一颗弹珠放入漏斗,不论我们放下的方式如何,弹珠就会以随机的方式滚下漏斗,然后由漏
斗底部掉下到靶上,再用铅笔在落点做个记号。我们利用一些简单的规则来使漏斗瞄准目标,这 些规则相当于我们在使用设备、流程或系统中作的一些决策规则。 [编辑] 漏斗实验的四种规则: 规则一:每次都不调整漏斗位置(结果:弹珠落点随机分布在目标值两侧) 规则二:根据上一次落点,调整漏斗位置(结果:弹珠落点范围较规则一大了约41%) 规则三:调整前先归回目标值(结果:弹珠落点由两侧大幅散开) 规则四:瞄准上一次的落点(结果:弹珠落点呈随机漫步到天边) 将四个规则仿真的结果绘在同张图上,可以一目了然地比较四种规则的结果。 :一个漏斗、一粒可以很容易通过漏斗的弹珠、一张桌子,最好铺上桌布。 第一次实验:规则为漏斗位置不变。首先在桌布上标出一点作为目标,开始实验。将漏斗口 瞄准目标点。保持这种状态,将弹珠由漏斗口落下50次,在弹珠每次落下的静止位置作标记。
死亡实验(the experiment)观后感
暴力行为是否属于侵犯行为呢?在判断某行为是否是侵犯行为时,有三个标准:一是个体外在的行为,二是看该行为是否违反社会主流规范,三是个体的内在动机或意图如何。显而易见地,看守的行为动机就是对罪犯进行报复,是故意的,而且也有外在的暴力动作,但是否能将这种暴力行为归于侵犯,我仍有一丝疑虑,因为在实验之初就已经说过,囚犯会丧失部分人权,所以这样的行为有没有违反社会主流规范仍旧存在疑虑,因为“看守看管囚犯,即使他运用了怎样的手段,也是可以理解的”这种思想没有经过调查,不好判断它是否属于社会主流思想。侵犯行为是否与生俱来也是社会心理学界争论的问题。霍尔提出过“挫折——侵犯理论”,他认为挫折是指当一个人为实现某种目标而努力时遭受干扰或破坏,致使需求不能得到满足时的情绪状态,人的侵犯行为是因为个体遭受挫折而引起的。从这个实验来看,如果证实了“看守”的行为的确属于侵犯行为的话,那么可见侵犯行为确实不是与生俱来的。因为在实验之前,他们都是正常人,而是在实验过程中,由于17号的挑战对于监狱管理产生困难与挫折,看守才最终选择了暴力侵犯行为。 关于群体压力。群体借助规范的力量形成的对其成员心理上的强迫力量,就是群体压力,群体借助这种力量达到对群体成员行为的约束作用。看守将17号关入黑屋子的惩罚就是为了造成对囚犯的群体压力。然而群体压力也有积极的意义:增强群体团结,有助于群体任务的完成,对多数成员内心安全感的形成起很大作用。这点明见于最后的囚犯群体大逃亡。但群体心理对于群体内固执己见的少数人
第18章-随机实验与自然实验
1 ? 陈强,《高级计量经济学及 Stata 应用》课件,第二版,2014 年,高等教育出版社。 第 18 章 随机实验与自然实验 18.1 实 验 数 据 假设研究x 1 是否导致 y 。假定{x 1, x 2 , , x K }包含所有影响 y 的因素。 不同学科采用不同的实验方法,大致分为以下几类。 (1) 控制实验(controlled experiment):在理想的物理实验中,控制 {x 2 , , x K }全部不变,单独让x 1 变化,观察 y 的变化。 (2) 随机(控制)实验(randomized controlled experiment):
【例】医学上对新药x 疗效的实验。由于参加实验者的体质与生活 1 方式不同,不可能完全控制所有其他因素{x2 , , x K }。 随机实验将实验人群(或个体)随机地分为两组,其中“实验组”或“处理组”(treatment group)服用真药,而“控制组”(control group,也称“对照组”)服用“安慰药”(placebo)。 被试者不知道自己分在哪一组,避免心理干扰。有时科研人员也不知道被试者在哪一组,称为“双盲法”(double blind)。 【例】农学中将地块随机地分成三组(很难找到土壤条件完全一样的地块),分别给予不同的施肥量,然后考察施肥的效果。 2
(3)自然实验或准实验(natural experiment or quasi experiment): 由于某些并非为了实验目的而发生的外部突发事件,使得当事人仿佛被随机地分在了实验组或控制组。 【例】一个州通过某法律,但相邻州未通过此法律。两州民众事先不知道哪个州会通过此法律,故无法自我选择住在哪个州。从考察法律的效果而言,可近似认为民众随机选择住在哪个州,或被随机分为实验组(通过法律)与控制组(没通过法律)。 (4)思想实验(thought experiment): Milton Friedman 曾设想在小岛上通过空投货币,考察该岛的宏观经济的变化。 3
完全随机设计试验资料的方差分析-东北农业大学植物科学与技术实验
东北农业大学本科课程教学大纲 课程名称:田间试验与统计方法 英文名称:Field Experiment and Statistic-method 课程编号:01600008j 适用专业:草业科学、植物生产类 总学时数:40 总学分:2.5 大纲主撰人:李文霞 内容简介 《试验设计与统计分析》是一门收集整理数据、分析数据, 并根据数据进行推断的科学。本课程为高等农业院校农学类专业的专业基础课,主要讲授有关田间试验的基本知识和统计分析的基本方法和技能,为学习专业课程奠定基础,使学生具备承担科学试验,正确分析和评价科学试验结果及其可靠性的能力。 教学大纲 一、课堂讲授部分 (一)分章节列出标题、各章节要点及授课时数(务必将要点写清楚) 第1章绪论 一、基本内容 1.1 农业科学试验的任务和要求1学时 1.1.1 农业科学试验和田间试验 1.1.2 农业科学试验的任务和来源 1.1.3 农业科学试验的基本要求 1.2 试验误差及其控制2学时 1.2.1 试验误差 1.2.2 试验误差的来源 1.2.3试验误差的控制 1.3 生物统计学与农业科学试验1学时 1.3.1 部分生物统计学基本概念 1.3.2 生物统计学的形成与发展 1.3.3 生物统计学在农业科学试验中的作用和注意问题 二、教学目的与要求 要求学生掌握农业科学试验的基本要求、试验误差的概念、来源和控制、部分生物统计学的概念,了解农业科学试验的任务和来源、生物统计学在农业科学试验中的作用和注意问题。 三、重点与难点 重点:农业科学试验的基本要求、试验误差的概念、来源和控制、部分生物统计学的概念
难点:试验误差的概念和生物统计学的基本概念的理解 第2章试验的设计和实施 一、基本内容 2.1 试验方案1学时 2.1.1 试验方案的概念和类别 2.1.2 处理效应 2.1.3 试验方案的设计要点 2.2 试验设计原则 1.5学时 2.2.1 重复 2.2.2 随机排列 2.2.3 局部控制 2.3 小区技术0.5学时 2.3.1 小区 2.3.2 区组和小区的排列 2.3.3 保护行 2.4 常用的试验设计1学时 2.4.1 对比法设计 2.4.2 间比法设计 2.4.3 完全随机设计 2.4.4 随机区组设计 2.4.5 拉丁方设计 2.4.6 裂区设计 2.5 试验的实施(学生自学) 2.6 田间抽样(学生自学) 二、教学目的与要求 要求学生掌握试验方案、试验设计原则、小区技术和常用的试验设计,自学试验的实施和田间抽样。 三、重点与难点 重点:试验方案、试验设计原则、小区技术和常用的试验设计。 难点:试验设计原则、小区技术、试验方案的设计要点的理解。 第3章描述性统计 一、基本内容 3.1 次数分布 1.5学时 3.1.1次数分布表 定量资料、定性资料 3.1.2次数分布图 柱形图、多边形图 3.1.3其它常用统计图 结合Excel的作图向导讲解,重点柱形图和折线图 3.2 平均数1.5学时
热传导实验(Heat Conduction Experiment)
熱傳導實驗(Heat Conduction Experiment) 目的:測定各種金屬之『熱傳導係數』,並探討物質具有不同大小之熱傳導係數要如何應用。實驗設備:自己填寫 實驗方式:分別以沿『軸向』及『徑向』之熱傳導試件進行實驗,以試件內之溫度達到穩定狀態時為準,來計算金屬之熱傳導係數。 操作步驟: (1)將金屬試件(不鏽鋼或黃銅、 不鏽鋼或鋁)安裝到要進行實 驗的座位台上 (2)打開電源,選擇溫度顯示相近 的RTD測溫棒插入試件的測 溫孔,並確定測溫棒與測溫孔 緊密接觸 (3)選擇『軸向』或『徑向』之加 熱源,並調整熱率輸入視窗之 數值為20W (4)每隔5分鐘讀取每支測溫棒 之溫度,每個試件至少記錄六次共30分鐘,歸納結果時要將各個測溫點的『溫度-時間圖』畫出,並以溫度達到穩定狀態時為準,來計算金屬之熱傳導係數。 (5)更換試件重複步驟(1)~(4) 實驗數據記錄: 試件名稱:軸向熱傳導 T1(℃) T2(℃) T3(℃) T4(℃) T5(℃)測溫點 時間 5(min) 10(min) 15(min) 20(min) 25(min) 30(min) 試件名稱:軸向熱傳導 T1(℃) T2(℃) T3(℃) T4(℃) T5(℃)測溫點 時間 5(min) 10(min) 15(min) 20(min) 25(min) 30(min)
試件名稱: 徑向熱傳導 測溫點 時間 T1(℃) T2(℃) T3(℃) T4(℃) T5(℃) 5(min ) 10(min ) 15(min ) 20(min ) 25(min ) 30(min ) 試件名稱: 徑向熱傳導 測溫點 時間 T1(℃) T2(℃) T3(℃) T4(℃) T5(℃) 5(min ) 10(min ) 15(min ) 20(min ) 25(min ) 30(min ) 實驗數據圖示: (1) 用Excell 畫出各個測溫點的『溫度-時間』圖 (2) 依據(1)之圖,估計各個測溫點達到穩定狀態時的溫度,依此溫度,畫出各試件在各個 測溫點達到穩定狀態的『溫度-位置』圖(在『軸向』實驗中應有兩試件之線;在『徑向』實驗中也應有兩試件之線) 實驗數據計算: (1) 依據穩定狀態的『溫度-位置』圖,將各點連成擬合直線(不是折線),依據此直線之斜 率(『軸向』為 X T ΔΔ)(『徑向』為)ln(i o o i r r T T ?)來 計算『熱傳導係數K 』。 (2) 『軸向』公式為X T KA Q ΔΔ=;Q :輸入熱率(A :試件截面積(m 2);△T :直線上兩點之溫度差(℃);△X :直線上兩點之位置差(m ) (3) 『徑向』公式為)ln(2i o o i r r T T KL Q ?=π;L=試件厚度(m ),T i =靠近圓心處之溫度(℃),r i =靠近圓心處之半徑(m ),T o =靠外側處之溫度(℃),r o =靠外側處之半徑(m ) 結果與討論: (1) 書本上不鏽鋼的『熱傳導係數K 』約為20W/m ℃;黃銅約為100W/m ℃;鋁約為200W/m ℃,為何實驗計算出的值比書本提供的值為大?
15章随机实验与自然实验-ShandongUniversity
教学用PPT ,《高级计量经济学及Stata 应用》,陈强编著,高等教育出版社,2010年 第15章 随机实验与自然实验 15.1实验数据 不同学科可能依条件的不同而采用不同的实验方法。 (1)控制实验(controlled experiment ):在理想的物理实验中,对除1x 以外的因素{}2,,K x x "全部控制不变,单独让
x变化,然后观察y变化的情况。 1 (2)随机(控制)实验(randomized controlled experiment):通常将实验人群随机地分为两组,其中“实验组”(treatment group)服用真药,而“控制组”(control group,也称“对照组”)服用“安慰药”(placebo)。 (3)自然实验或准实验(natural experiment or quasi experiment):由于某些并非为了实验目的而发生的外部突 发事件,使得当事人仿佛 ..被随机分在了实验组或控制组。
15.2 理想的随机实验 在理想的随机实验(ideal randomized experiment)中,实验组与控制组的成员决定完全随机,比如,通过抛硬币或电脑随机数来决定。故个体究竟被分在哪一组或得到多大的实验“剂量水平”(treatment level),与个体的特征或其他可能影响实验结果的因素是完全独立的。这就避免了遗漏变量偏差(omitted variable bias)。
考虑以下回归模型, i i i y x αβε=++ (15.1) 其中,i x 是完全随机地决定的。由于i x 与i ε相互独立,故 Cov(,)0i i x ε=,因此OLS 是一致的。由于i x 与i ε相互独立,故1E(|,,)0i n x x ε=",故OLS 也是无偏的。 在理想的随机实验中,X 对y 的因果效应表现在条件期望的差别,即E(|)E(|0)y X x y X =?=,也称为“实验效应”
实验安全风险分析EXPERIMENT RISK ANALYSIS
E UROPEAN S YNCHROTRON R ADIATION F ACILITY INSTALLATION EUROPEENNE DE RAYONNEMENT SYNCHROTRON EXPERIMENT RISK ANALYSIS Experimental Number:Beamline: Main Proposer: Title of the Experiment: 1EXPERIMENT (only if changes since the proposal) Classification of the sample: Radioactive Contaminant Corrosive Oxidising Explosive Biological Other: Sample Description: Crystal Powder Polycrystalline Multilayer Liquid Gas Nanoparticles Other: Container: Capillaries Flat plate Pressure cell – Type: Other: ESRF equipment to be used: Furnace Magnet Cryostat Cryogenic gas stream Refrigerator Laser High pressure Fixed temperature Other: The Safety Group must immediately be informed of all modifications made and which differ from the original proposal and this at least two weeks before your arrival on site. Your equipment has been tested by your home institute. No changes can be made before your arrival at the ESRF and until your experiment has started. Page 1 / 12- Analyse des risques de l’expérience
experiment1
实验一 电位、电压的测量和叠加定理的研究 一、实验目的 1.熟悉实验台的整体布置及交、直流电源和交、直流仪表的使用。 2.学会测量电路中各点的电位和电压的方法。 3.掌握线性电路的叠加定理。 二、实验设备 实验箱(EEL-51)(EEL-53)、恒压源、直流电压表、直流电流表 三、实验内容 1.熟悉实验台的整体布局、记录实验台的主要设备和仪表的参数。要求记录:设备的名称、规格、量程及精度。 2.熟悉直流恒压源、恒流源和直流电压表、电流表的使用。 (a)自行设计一个电路,以某点为参考点,测量电路各点的电位和两点之间的电压。具体要求: ①用三个电阻和一个电源(电压不超过8V )组成一个简单电路; ②由附录中实验箱选择电阻元件的阻值,并画出电路; ③选择参考点计算各点的电位和两点之间的电压,自行设计一个表格,将所计算的数据填入表格中。然后实际连接电路,测量电位和电压。 (b)叠加定理的研究 使用EEL-53实验箱,按叠加原理图1-1进行实验,测量每个电源(V U S 121 =,V U S 62 =) 单独作用时和共同作用时各支路电流值,填入表1-1中。 表1-1 图1-1 4 5
四、实验注意事项 1.测量直流电压应并联在被测元件上,注意正负极性。测量直流电流时应串联在被测支路中,要注意电流的方向。 2.选择测量仪表的量程,根据估算选择稍大的量程,如电流偏小,再降低量程,以保证测量的精度。注意测量仪表报警铃响时,应关闭仪表的电源,检查原因,改正后重新合上仪表的电源。 3.正确使用可调直流恒压源和恒流源,正确读数(读数以电压表测量为准,而不以电源表盘指示值为准)。 4.使用电流插头测量时应注意仪表的极性的正确连接,以及读数时"",""-+号的记录。 5.叠加定理实验中,每个电源单独作用时,去掉另一个电源,是由开关S 1 ,S 2 操作完成,而不能将直流电源短路。 五、预习思考题 1.叠加定理实验中1 S U ,2 S U 分别单独作用时实验中应如何操作? 2.如将叠加定理中电阻R 3改为二极管D 时,叠加定理是否成立? 3.电路中各点电位与选择的参考点有什么关系?任意两点之间的电压与参考点的选择有关系吗? 六、实验报告要求 1.预习报告内容的要求:实验目的、实验设备(写出具体实验箱的型号和测量仪表的型号)、实验内容及步骤、根据实验内容,具体画出线路及实验参数,计算结果,以及设计出测量用的记录表格。 2.总结报告内容的要求:除预习报告内容之外,再增加数据的误差分析或曲线比较,理论分析,故障分析和心得体会。
Reynolds_experiment雷诺实验(英文版)
Reynolds experiment Aim of the experiment 1.Observe the laminar and turbulent flow, and the process of transition from one state to the other. 2.Measure the critical Reynolds number and develop the skills on how to distinguish the pipe flow state. 3.Study the dimensional analysis method to analyze the experiment, confirming the criterion number of flow state for a non-circular pipe. Experimental apparatus 1. The figure of the apparatus Figure 1 shows the experimental apparatus and the name of each part. Figure 1. 1: Self-circulating water supply, 2: Hydraulic bench, 3: Speed controller, 4: Constant head water tank, 5: Coloured water pipe, 6: Perforated plate, 7: Overflow, 8: Experiment pipe, 9: Flow rate control valve
DOE(Design of Experiment,试验设计)
DOE 出自 MBA智库百科(https://www.360docs.net/doc/8e6683993.html,/) DOE(Design of Experiment,试验设计) 目录 [隐藏] ? 1 什么是DOE ? 2 为什么需要DOE ? 3 DOE的基本原理 ? 4 DOE实验的基本策略 ? 5 DOE的步骤 ? 6 DOE的作用 ?7 DOE的方法 [编辑] 什么是DOE DOE(Design of Experiment)试验设计,一种安排实验和分析实验数据的数理统计方法;试验设计主要对试验进行合理安排,以较小的试验规模(试验次数)、较短的试验周期和较低的试验成本,获得理想的试验结果以及得出科学的结论。 试验设计源于1920年代研究育种的科学家Dr.Fisher的研究, Dr. Fisher 是大家一致公认的此方法策略的创始者, 但后续努力集其大成, 而使DOE在工业界得以普及且发扬光大者, 则非Dr. Taguchi (田口玄一博士) 莫属。 [编辑] 为什么需要DOE ?要为原料选择最合理的配方时(原料及其含 量); ?要对生产过程选择最合理的工艺参数时; ?要解决那些久经未决的“顽固”品质问题 时;
?要缩短新产品之开发周期时; ?要提高现有产品的产量和质量时; ?要为新或现有生产设备或检测设备选择最 合理的参数时等。 另一方面,过程通过数据表现出来的变异,实际上来源于二部分:一部分来源于过程本身的变异,一部分来源于测量过程中产生的变差,如何知道过程表现出来的变异有多接近过程本身真实的变异呢?这就需要进行MSA测量系统分析。 [编辑] DOE的基本原理 试验设计的三个基本原理是重复,随机化,以及区组化。 所谓重复,意思是基本试验的重复进行。重复有两条重要的性质。第一,允许试验者得到试验误差的一个估计量。这个误差的估计量成为确定数据的观察差是否是统计上的试验差的基本度量单位。第二,如果样本均值用作为试验中一个因素的效应的估计量,则重复允许试验者求得这一效应的更为精确的估计量。如 s2是数据的方差,而有n次重复,则样本均值的方差是。这一点的实际含义是,如果n=1,如果2个处理的y1 = 145,和y2 = 147,这时我们可能不能作出2个 处理之间有没有差异的推断,也就是说,观察差147-145=2可能是试验误差的结果。但如果n合理的大,试验误差足够小,则当我们观察得y1随机化是试验设计使用统计方法的基石。 所谓随机化,是指试验材料的分配和试验的各个试验进行的次序,都是随机地确定的。统计方法要求观察值(或误差)是独立分布的随机变量。随机化通常能使这一假定有效。把试验进行适当的随机化亦有助于“均匀”可能出现的外来因素的效应。 区组化是用来提高试验的精确度的一种方法。一个区组就是试验材料的一个部分,相比于试验材料全体它们本身的性质应该更为类似。区组化牵涉到在每个区组内部对感兴趣的试验条件进行比较。 [编辑] DOE实验的基本策略 策略一:筛选主要因子(X型问题化成A型问题)
experiment
Project 1 Technology Enhanced Presentations Choice 1. To begin a presentation: a.choose the New menu, then choose New. b.choose the File menu, then choose New Presentation. c.choose the File menu, then choose New. d.click the New Slide button on the toolbar. 2. To insert footer into the slide presentation: a.click the Header/Footer button on the toolbar. b.choose the View menu, choose Master, then choose Slide Master. c.choose the Edit menu, then choose Header/Footer. d.choose the View menu, then choose Header/Footer. 3. The type of animation that is caused by the change from one slide to another is a(n): a.action setting. b.custom animation. c.slide transition. d.preset animation. 4. To set a transition: a.choose the Slide Show menu, then choose Transition. b.choose the Slide Show menu, then choose Slide Transition. c.click the Transition button on the toolbar. d.choose the Format menu, then choose Transition. 5. What is the first step in setting a custom animation? a.Clicking the Animation button on the toolbar. b.Choosing the Slide Show menu. c.Clicking the mouse on a part of the text to be animate d. d.Clicking the Add Effect button on the toolbar. Essay Questions What is the purpose of having a clear beginning and ending to a presentation?
操作系统experiment3
实验2 存储管理 1. 实验目的 存储管理的主要功能之一是合理地分配空间,请求页式管理式一种常用的虚拟存储管理技术。本实验的目的是通过请求页式管理中页面置换算法的模拟设计,了解虚拟存储技术的特点,掌握请求页式存储管理的页面置换算法。 2. 实验内容 (1) 通过随机数产生一个指令序列,共320条指令,指令地址按下述原则生成 ①50%的指令是顺序执行; ②25%的指令是均匀分布在前地址部分; ③25%的指令是均匀分布在后地址部分; 具体的实施方法是 ①在[0, 319] 的指令地址之间随机选取一起点m ; ②顺序执行一条指令,即执行地址为m+1 的指令; ③在前地址[0, m+1] 中随机选取一条指令并执行,该指令的地址是m’; ④顺序执行一条指令,其地址为m’+1 ; ⑤在后地址[m’+2, 319] 中随机选取一条指令并执行; ⑥重复上述步骤①~⑤,直到执行320次指令。 (2) 将指令序列变为页地址流 设:①页面大小为1K ; ②用户页面内存容量为4页到32页; ③用户虚存容量为32K 。 在用户虚存中,按每K 存放10条指令排列虚存地址,即320条指令在虚存中的存放方式为: 第0条~第9条指令为第0页(对应虚存地址为[0, 9]); 第10条~第19条指令为第1页(对应虚存地址为[10, 19]); …… …… 第310条~第319条指令为第31页(对应虚存地址为[310, 319]); 按以上方式,用户指令可组成32页。 (3) 计算并输出下述各种算法在不同内存容量下的命中率 ①First-In-First-out (FIFO) Page Replacement ②Least-Recently-Used (LRU) Page Replacement ③Optimal Page Replacement 其中③和④为选择内容
Dr. Heidegger's Experiment读后感
Ambiguity and Uncertainty in Dr. Heidegger's Experiment Nathaniel Hawthorne's short story, Dr. Heidegger's Experiment, reveals that people have a futile and self-destructive desire to relive their pasts instead of moving onward and accepting their fates. In Dr. Heidegger's Experiment, Hawthorne uses a point of view that allows ambiguity to enter the narration. The unnamed narrator opens many aspects of the story to more than one interpretation and enhances the revelation of the theme through uncertainty as he tells of the reactions of four old people to the water of the Fountain of Youth. The narrator himself seems unsure whether the events he is relating have even occurred. "Was it delusion?" he asks, "Even while the draught was passing down their throats, it seemed to have wrought a change on their whole systems." Commenting on the many tales that have sprung up around the mysterious Dr. Heidegger, the narrator even admits his own unreliability, stating, "Some of these fables, to my shame be it spoken, might possibly be traced back to mine own veracious self; and if any passages of the present tale should startle the reader's faith, I must be content to bear the stigma of a fiction-monger." These uncertainties divorce the story's happenings from reality, enhancing the allegorical meaning of the tale. The narrator is uncertain whether Dr. Heidegger's four old subjects have attained a second youth. As they drink the water, their actions become those of youths, but have their bodies changed too? "...the three gentlemen behaved in such a manner, as proved that the water of the Fountain of Youth possessed some intoxicating qualities; unless, indeed, their exhilaration of spirits were merely a lightsome dizziness, caused by the sudden removal of the weight of years." When they lose their newfound "youth," the same doubts are shown: "A strange chillness, whether of body or spirit they could not tell, was creeping gradually over them all. They ... fancied that each fleeting moment snatched away a charm, and left a deepening furrow where none had been before. Was it an illusion? Had the changes of a life-time been crowded into so brief a space... In truth, they had [grown old]. The Water of Youth possessed merely a virtue more transient than that of wine." The Elixir of Youth is likened to an alcoholic drink, yet the effects of an actual loss of age, and later a loss of their new-found youth, are felt in the four subjects. The narrator, and thus the reader, does not know the true extent of Dr. Heidegger's "experiment." This does not obscure the truths that the subjects reactions reveal; whatever interpretation the reader chooses, the theme remains. This uncertainty also highlights the multiple meanings of certain lines. When the four old
JAVA Experiment
以下所有实验完成的环境: OS: Windows XP IDE: Eclipse Database: MySQL或SQL Server 实验一 实验名称:JAV A中循环结构 实验目的:熟悉循环结构,熟悉JA V A类的定义以及参数的传递。 实验时间:(2学时) 实验内容: 1.金字塔:Pyramid.java 在屏幕上显示一个由星型符号“*”组成的金字塔图案,示例如下: * *** ***** 实验二 实验名称:封装,继承与多态 实验目的:熟悉JA V A面向对象的三大特性。 实验时间:(4学时) 实验内容: 1.定义一个形状类(Shape)方法:计算周长,计算面积 子类: 矩形类(Rect):额外的方法:cha()计算长宽差 圆形类(Circle) 正方形类(Square)矩形的子类 生成几个不同的形状对象,放在一个Shape类型的数组里,分别求每个形状的周长和面积。如果形状对象是一个矩形,且不是正方形,则计算长宽差。 实验三 实验名称:集合 实验目的:熟悉JA V A的集合框架,熟练掌握以下接口和类的使用,Collection, Map, List,Set, SortedSet, ArrayList, LinkedList, Vector, HashMap, Hashtable等。 实验时间:(2学时) 实验内容: 1. 数组拷贝CopyArray.java 定义数组int[] a = { 1,2,3,4,5,6,7,8,9,10 }和b。 (1)将数组a中的所以元素拷贝到数组b中,打印b中元素。(用循环实现) 结果参考: 1,2,3,4,5,6,7,8,9, (2)将数组a中从第3个元素起连续5个元素拷贝到数组b中,打印b中的元素(用api中提供的数组拷贝方法实现)
第18章-随机实验与自然实验(优选.)
1 ? 陈 强,《高级计量经济学及S t a t a 应用》课件,第二版,2014年,高等教育出版社。 第1 8章 随机 实验与自然实验 18.1 实 验 数 据 假设研 究1x 是否导致y 。假定{}12,,,K x x x 包含所有影响y 的因素。 不同学科采用不同的实验方法,大致分为以下几类。 (1) 控制实验(c o n t r o l l e d e x p e r i m e n t ):在理想的物理实验中,控制{}2,,K x x 全部不变,单独让1x 变化,观察y 的变化。 (2) 随机(控制)实验(r a n d o m i z e d c o n t r o l l e d e x p e r i m e n t ):
2 【例】 医学 上对 新药 1x 疗效的 实验。 由于 参加实验者的体质 与生 活 方式不同 ,不 可能 完全 控制 所有 其他因 素 {} 2, , K x x 。 随机实 验将实验人群(或个体)随机地分为两组,其中“实验组”或“处理组” (t r e a t m e n t g r o u p )服用真药,而“控制组”(c o n t r o l g r o u p ,也称“对照组”)服用“安慰药”(p l a c e b o )。 被试 者不知道自己分在哪一组,避免心理干扰。有时科研人员也不知道被试者 在哪一组,称为“双盲法”(d o u b l e b l i n d )。 【例 】农学中将地块随机地分成三组(很难找到土壤条件完全一样的地块 ),分 别给予不同的施肥量,然后考察施肥的效果。
3 (3) 自然实验或 准实验 (n a t u r a l e x p e r i m e n t o r q u a s i e x p e r i m e n t ): 由于某些 并非 为 了实 验 目的而发生的外部突发事件,使得当事 人 仿佛被随机 地分在 了实验 组或控制组。 【例】一个州通过某法律,但相邻州未通过此法律。两州民众事先不知道哪个州会通过此法律,故无法自我选择住在哪个州。从考察法律的效果而言,可近似认为民众随机选择住在哪个州,或被随机分为实验组(通过法律)与控制组(没通过法律)。 (4) 思想实验(t h o u g h t e x p e r i m e n t ): M i l t o n F r i e d m a n 曾设想在小岛上通过空投货币,考察该岛的宏观经济的变化。
Experiment_Report
Experiment Report (实验报告) Experiment Name(实验名称) The first Experiment(第 1 次实验) Experiment Date(日期) 2014-06-17 Teacher(老师) Student ID(学号) Name(姓名) Class(班级) Score(成绩) 一.Aim and Requirement(目的和要求) Define a Class containing an overloaded method area(), which calculates area of a Square, Rectangle, and a Circle depending on the type and number of arguments passed to it. 二. Experiment Content(实验内容) 1、Write an overloaded method area(), which calculates area of a Square, Rectangle, and a Circle. 2、Write the main function to test the method. 三.Experimental Procedures(实验步骤) 1、Write an overloaded method area() to calculate area of a Circle. 2、Overload the method area() again to calculate area of a Square or a Rectangle. 3、Write the main function to test the method. 4、Run the project file, the result shows that: 四.Experimental Summary(实验小结)