A User-Centered Tool for the Interactive 3D Visualization of Electronic Structure in Molecu
A User-Centered Tool for the Interactive 3D Visualization of Electronic Structure
in Molecules and Solids
Timothy B. Terriberry1, David F. Cox2, Doug A. Bowman1
1Department of Computer Science
2Department of Chemical Engineering
Virginia Polytechnic Institute and State University
Blacksburg, VA 24061
{tterribe, dfcox, bowman}@https://www.360docs.net/doc/931708807.html,
Abstract
This paper presents the VASP data viewer, a desktop 3D
visualization applic ation for the analysis of elec tronic
struc ture information derived from ab-initio quantum-
me c hani
c
al density fun
c
tional
c
al
c
ulations. This tool
allows a sc ientist to direc tly view and manipulate the c alc ulated c harge density from an elec tronic struc ture c alc ulation, providing insight into the nature of c hemic al bonding. Particular attention was given to the design and implementation of the user interface for the data viewer. It provides for both expert and novic e usage, and both natural direct manipulation and precise numerical control. The data viewer has proven immediately useful to chemical engineers for real-world research.
1. Introduction
Tools for three-dimensional (3D) scientific visualization of data sets are becoming more commonplace in the academic and industrial communities. These range from simple static images that convey 3D information to fully-immersive, interactive virtual environments (VEs). However, users of complex 3D visualization tools are often frustrated or distracted from their task of gaining insight into data by user interface (UI) and usability problems. While creating 3D images is fairly straightforward, 3D interaction is not well-understood [4].
Springmeyer et al [11] provide important principles for the interaction design of visualization tools. These include supporting active exploration, capturing the context of analysis, and decreasing the difficulty of navigation. Adoption of these principles should lead to the development of tools that are easy to use, making the interface as transparent as possible so that the user feels he is able to analyze and interact with the data directly.
In this paper, we discuss the development and usage of the VASP data viewer. This tool allows 3D viewing and manipulation of data produced by the Vienna Ab-Initio Simulation Package (VASP). The output from this package includes information regarding valence charge density and the electron localization function for a molecule or 3D solid. Visualization of this data is essential for gaining chemical insight into this complex information.
The data viewer was developed from a user-centered perspective. An iterative design process was followed, with each successive prototype being presented to and discussed with the principal scientific user. We attempted to support both novice and expert users by providing a traditional 2D WIMP interface style, keyboard shortcuts for all functions, and 3D direct manipulation of the data.
We also followed Springmeyer’s principles during the tool’s design. Active exploration is encouraged by easy accessibility to the data through direct manipulation and simple methods for reversing incorrect actions. The tool is focused on the use context for which it was developed. For example, the user can create bonds of varying thickness between selected atoms, even though this information is not included in the data files from VASP. Also, users may choose between direct manipulation and numerical input for parameters such as the orientation of a slice through the data, allowing both natural interaction and scientific precision. Navigation in and around the data set is made easier by providing multiple methods for setting the viewpoint’s position and orientation relative to the data.
In the next section, we describe the functionality of the tool and focus on two interaction techniques of particular interest. Section 3 discusses the impact of the data viewer on real-world research. We conclude by offering some possibilities for further work.
2. The VASP data viewer
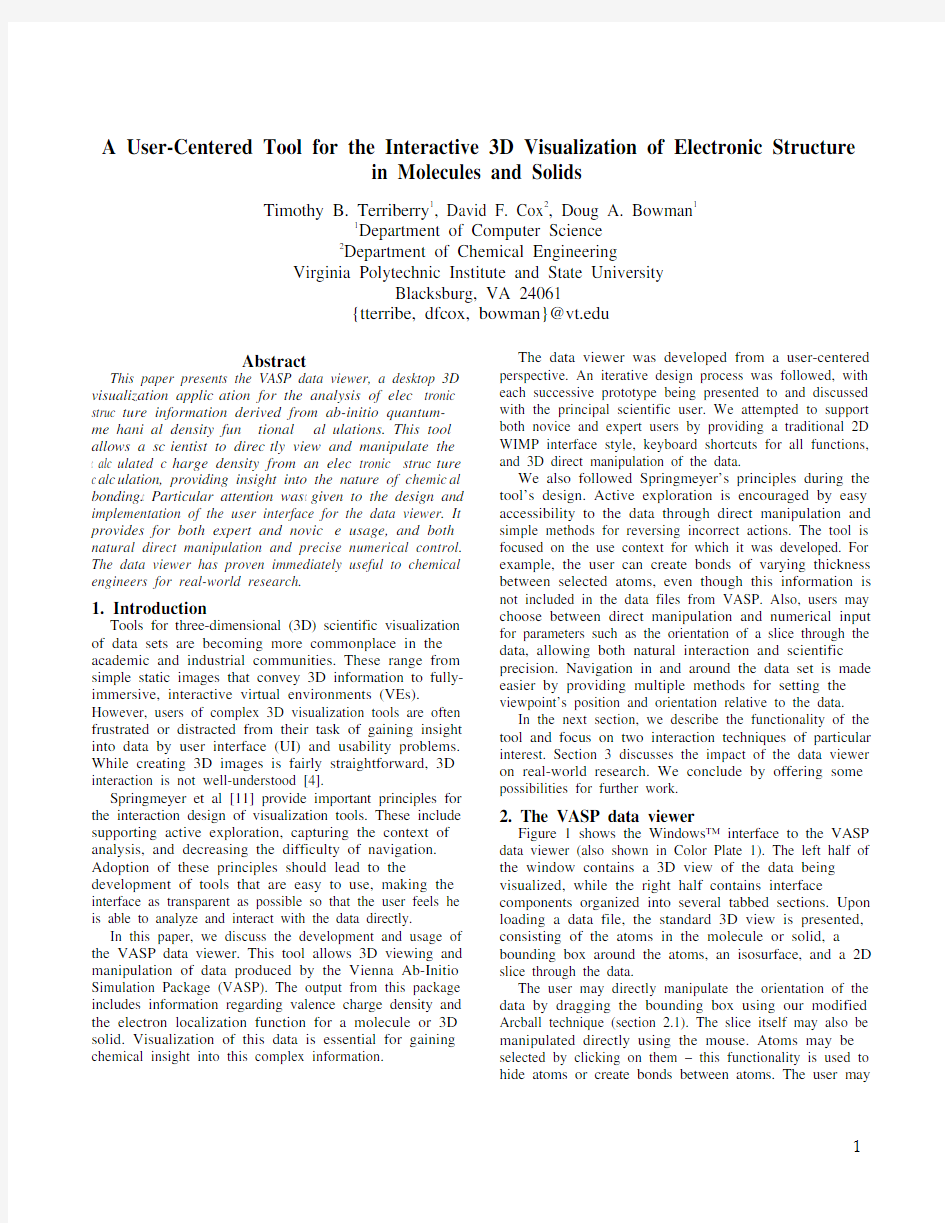
Figure 1 shows the Windows? interface to the VASP data viewer (also shown in Color Plate 1). The left half of the window contains a 3D view of the data being visualized, while the right half contains interface components organized into several tabbed sections. Upon loading a data file, the standard 3D view is presented, consisting of the atoms in the molecule or solid, a bounding box around the atoms, an isosurface, and a 2D slice through the data.
The user may directly manipulate the orientation of the data by dragging the bounding box using our modified Arcball technique (section 2.1). The slice itself may also be manipulated directly using the mouse. Atoms may be selected by clicking on them – this functionality is used to hide atoms or create bonds between atoms. The user may
also set the zoom factor with which the data is viewed, center the view on a particular atom, or align the view to the slice. Finally, the user can choose to replicate the original data set along any of the three principal axes, so that a larger part of an infinite solid can be viewed. Most viewing controls are available via direct manipulation, slider or numeric input in the graphical user interface
(GUI), or via keyboard controls.
Figure 1. User interface
The user can change the value associated with the isosurface, and also the level of detail with which it is rendered (important to allow interactive response even on older machines). When the slice is activated, a color or gray scale legend indicating the mapping between data values and hue or gray level is shown.
The design of most of the GUI and interaction techniques was straightforward, although we had to pay attention to details such as labels, grouping of functionality in the tabbed panes, and the user’s mental model for setting slice orientation. Two of the direct manipulation techniques, however, posed interesting implementation problems. They are described in the following sections. 2.1 Specifying an Orientation
A common problem encountered in visualizing three-dimensional data is specifying a 3D orientation for the data set using only a 2D input device, such as a mouse. The orientation of a 3D object can be specified as three consecutive rotations, each around one of the principal axes, providing three degrees of freedom. A mouse, however, provides only two degrees of freedom.
The original solution to this problem was the concept of a Virtual Spher e, introduced by Chen [3], which simulates a trackball. The Virtual Sphere is represented by a circle drawn around the object being oriented. If the user drags the mouse inside the circle, the mouse position is projected orthographically onto a sphere passing through the circle outline. Rotations around two of the principal axes keep the point on the sphere the user initially clicked on under the mouse cursor, so that the user appears to drag the track-ball
around. A third degree of freedom is achieved by dragging the mouse outside the circle, which produces a rotation about the third principal axis.
Another technique similar to the Virtual Sphere is the Arcball introduced by Shoemake [10]. Instead of constraining rotations produced by dragging inside the sphere to two principal axes, it uses the mathematical concept of quaternions to find a “canonical” rotation that moves one point on the sphere to another. Each dragging motion is still constrained to two degrees of freedom, but by using multiple dragging motions, any orientation can be achieved. Hence the region outside the circle is eliminated. While the Arcball has been called the best-known 2D technique for 3D rotation, an empirical study [5] has shown that users achieve the same speed and accuracy with an Arcball as with a Virtual Sphere.
While both of these techniques allow direct manipulation of a sphere enclosing the object to be oriented, neither allows actual direct manipulation of the object itself. Our tool uses a system based upon the Arcball, but in which the user manipulate the actual data. When the user first clicks on the object, the point in three space where the user clicked can be determined by casting a ray from the viewpoint through the mouse cursor, and finding the first intersection with the object. We can now construct an imaginary sphere whose radius is equal to the distance of the click point from the center of the object, and project further mouse movement onto this sphere, rotating the object as we would with the Arcball technique. The effect is that the point on which the user clicked always remains under the mouse cursor, so that it appears the user is rotating the object itself.
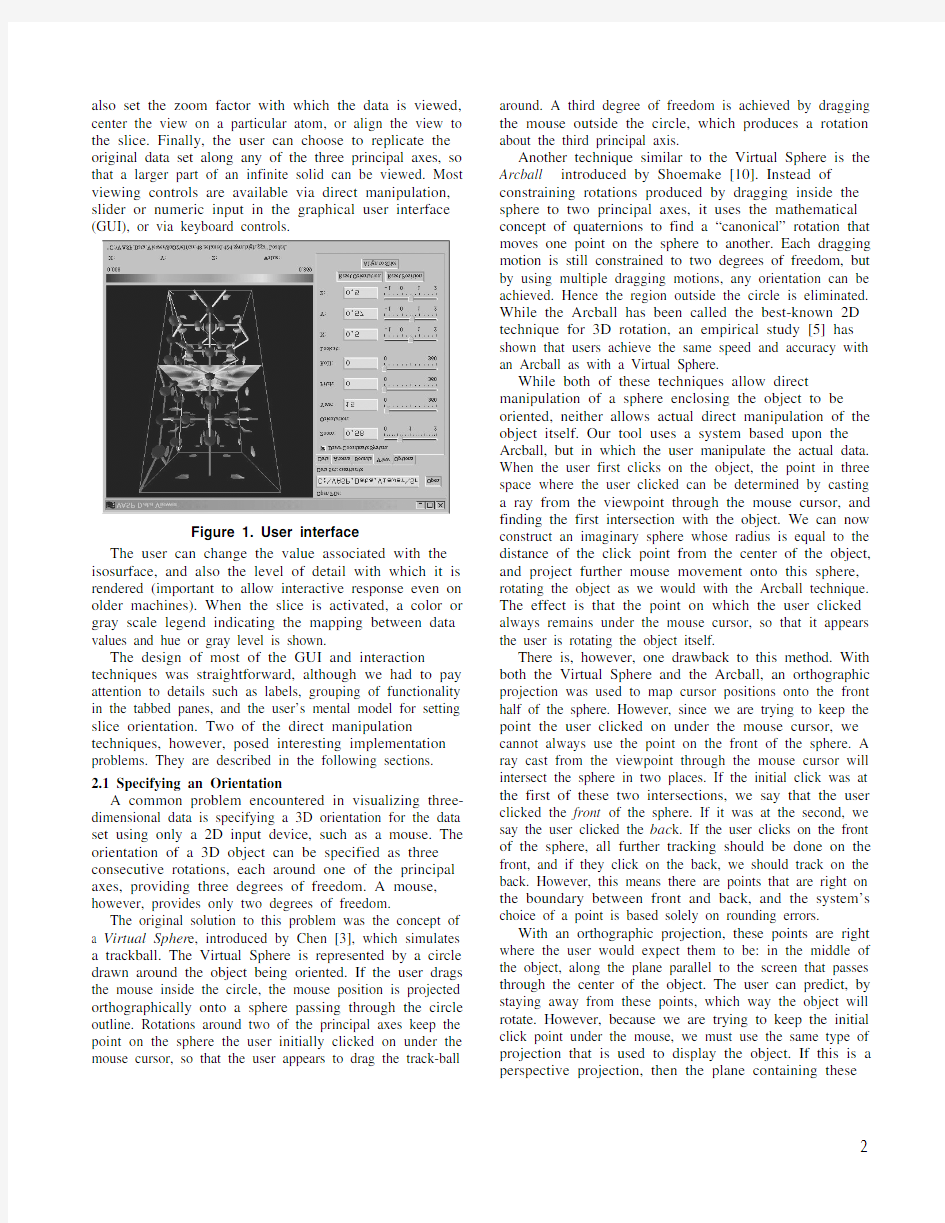
There is, however, one drawback to this method. With both the Virtual Sphere and the Arcball, an orthographic projection was used to map cursor positions onto the front half of the sphere. However, since we are trying to keep the point the user clicked on under the mouse cursor, we cannot always use the point on the front of the sphere. A ray cast from the viewpoint through the mouse cursor will intersect the sphere in two places. If the initial click was at the first of these two intersections, we say that the user clicked the front of the sphere. If it was at the second, we say the user clicked the bac k. If the user clicks on the front of the sphere, all further tracking should be done on the front, and if they click on the back, we should track on the back. However, this means there are points that are right on the boundary between front and back, and the system’s choice of a point is based solely on rounding errors.
With an orthographic projection, these points are right where the user would expect them to be: in the middle of the object, along the plane parallel to the screen that passes through the center of the object. The user can predict, by staying away from these points, which way the object will rotate. However, because we are trying to keep the initial click point under the mouse, we must use the same type of projection that is used to display the object. If this is a perspective projection, then the plane containing these
ambiguous points is well forward of the center of the object (Figure 2). In fact, with the dimensions of our original test data set, the front, top edge lay very close to this plane. By clicking slightly above the edge, one would drag the top backwards, and by clicking slightly below, one would drag the top forwards. This was not a very intuitive place for this singularity to occur, and caused some confusion.
Back of sphere Front of sphere
Figure 2. Singularities in the modified Arcball
technique
On the other hand, this technique did make possible many of the other direct manipulation techniques used in the system. With the Virtual Sphere and Arcball, the entire screen inside the sphere is a target for rotating the object. Using our method, however, only the actual portions of the screen covered by the object are required. For example, the entire data set can be rotated by rotating the bounding box that surrounds it. This leaves the region inside this box free for other direct manipulation, such as selecting atoms, drawing bonds between them, and rotating the 2D slice.
2.2 Region Selection
Another common problem in visualizing large data sets is the quick isolation of a specific portion of the data set. One way of solving this is to allow the user to travel into the data set with an egocentric viewpoint. However, this technique can disorient users, and may not be effective if the data set is dense and nearby objects occlude too much [1]. Instead, we provide a simple mechanism that allows the user to intuitively cull away large portions of the data set at once. The user can click somewhere in an empty region (often just outside the boundaries of the data set), and drag out a rectangle that covers just the portions they wish to see, as seen in Color Plate 2. The sides of the box surrounding the data set are then moved inwards until they fit completely within the rectangle described by the user, whereupon the new region is centered on the screen.
The difficulty in implementing this technique is determining how to cull the box so that it fits inside the rectangle. We project the rectangle into a volume with four planar boundaries that pass through the edges of the rectangle. When using perspective projection, this is just an open-ended pyramid, while for an orthographic projection, this is a rectangular prism of infinite extent. Once these four planes have been defined, we can clip the edges of the box surrounding the data set, moving one of the sides of the box in every time an edge is clipped.
However, clipping the edges in a different order can produce different boxes. In order to provide some sort of consistency, so the user can get a good idea what kind of box they will wind up with, we need a way to unambiguously determine an order in which to clip the edges. Our solution was to find all the intersection points between the four planes and the twelve box edges, and then actually clip the one closest to the viewer. This makes sense to the user, since these are the points that fall directly on the edge of the clip rectangle and are not obscured by anything else. Finally, we give the user feedback as they are dragging out the rectangle, in the form of a translucent box surrounding the actual region they would see if they let go of the mouse button at that moment (Color Plate 2).
Finally, since users often want to be able to “back up” to see how the region they were viewing fits into the data set as a whole [6], we keep a stack of previous views, and allow the user to go back through them using a second mouse button. This also allows the user a way out if they activated the feature by accident, or the region they selected did not match their expectation.
3. Impact on scientific analysis
VASP can be used to determine the minimum energy configuration of atoms in a molecule or an infinite 3D solid, and the wave functions generated by VASP describe the electronic states (orbitals) associated with the chemical bonding within the structure. However, because a plane-wave basis set is used for the calculation, the wave functions are not as easily interpretable in chemical terms as those generated using a linear combination of atomic orbitals (LCAO). Chemical insight can be improved by visualization of the valence charge density supplied by VASP in the CHGCAR output files or by visualization of the electron localization function (ELF) [2] supplied in the ELFCAR output file. Visualization of the ELF is particularly useful, and provides a scaled (0-1) picture of the charge density relative to a homogeneous electron gas. Isosurfaces at high values of ELF (~0.8-1.0) can often be interpreted in terms of bonding and non-bonding electron pairs [2,7,8]. There is currently no standard tool available from the VASP group for visualizing these files, so the viewer fills an important need for users of the code. The usefulness of the visualization tool is illustrated for the case of a bulk SnO
2
structure.
The “Draw Slice” functionality on the Data tab allows one to examine the variation in ELF on a given plane within the structure. Using the slice angle and slice offset sliders one may position the slice anywhere within a structure. When the plane is chosen to include nearest-neighbor atoms, the nature of the ELF along the bond path between the atoms gives insight into the nature of the bonding. In Color Plate 3, a slice along a (110) plane containing both Sn and O atoms in bulk SnO
2
is shown.
The highest values of ELF appear around the locations of the O atoms (red) in the structure, with intermediate values around the Sn atoms (blue). This distribution is indicative of a separation of charge due to the predominantly ionic nature of the bonding, but the trigonal shape and elongation of the charge density towards the tin atoms
indicates some minor covalent character to the bond.
Figure 3. Isosurface (ELF=0.85) of the localization function around an oxygen atom in bulk SnO 2 The isosurface feature allows one to examine the 3D distribution of the ELF around the individual atoms in a structure. Features of the viewer that are particularly helpful for this purpose are those that allow navigation within the structure. One may select an atom within the structure, center it with the “Look at Atom” feature on the Atoms tab, then move into the structure with the “Zoom” feature on the view tab. The local region around the chosen atom may then be selected or isolated from the rest of the structure by dragging a box around the region of interest. Figure 3 shows an isosurface at a high (0.85) value of ELF around an O atom in bulk SnO 2. The two lobes of charge density above and below the plane of the nearest neighbor bonds are easily recognizable as the O 2p lone-pair electronic states described by LCAO tight-binding calculations of the SnO 2 electronic structure [9].
4. Conclusions and future work
We have presented the VASP data viewer, a tool for three-dimensional visualization of electronic structure information. Due to its accurate and intuitive representation of the data, and the care with which the user interface was constructed, this tool has proven useful in providing scientific insight.
One possible extension to this work is to provide true 3D viewing and interaction using an immersive virtual environment. By employing a head-mounted display (HMD) or surround-screen stereoscopic display such as the CAVE?, the scientist could more naturally specify his viewpoint, and could more easily put himself “inside” the dataset. When an exocentric view is desirable, a tabletop
stereoscopic display such as the Immersive Workbench? might prove useful. The use of 3D input devices, including position and orientation trackers, 3D mice, and gloves,
along with appropriate 3D interaction techniques, should allow more natural and efficient manipulation of the data. Second, we plan to continue experimenting with mouse-based 3D rotation techniques. The singularities in our current modified Arcball technique can cause user confusion, so exploring further modifications to address this issue could have an impact on usability.
Finally, we would like to be able to view dynamic simulations within the 3D data set. VASP is capable of
writing different output files for each time step in a molecular dynamics simulation, and the tool could be used for simulation playback. This feature would be especially useful for understanding the atomic motions of the structure, and the spatial variations in the electronic properties resulting from the motion. Acknowledgments
The authors would like to thank Chad Wingrave for his comments and suggestions on early versions of the tool.
References
1. Baker, M.P. and Wickens, C.D. Human Factors in Virtual
Environments for the Visual Analysis of Scientific Data. Tech. Rep. TR032, National Center for Supercomputing Applications, August 1995.
2. Burdett, J.K. and M cCormick, T.A. Electron Localization in
Molecules and Solids: The Meaning of ELF. The Journal of Physical Chemistry A , 102, 1998, pp. 6366-6372.
3. Chen, M ., M ountford, S.J., and Sellen, A. Interactive 3-D
Rotation Using 2-D Control Devices. Computer Graphics , 22, 1988, pp. 121–129.
4. Herndon, K., van Dam, A., and Gleicher, M. The Challenges
of 3D Interaction. SIGCHI Bulletin , 26(4), 1994, pp. 36-43. 5. Hinckley, K., Tullio, J., Pausch, R., Proffitt, D., and Kassell,
N. Usability Analysis of 3D Rotation Techniques. In Pro eedings of the ACM Symposium on User Interfa e Software and Technology , 1997, pp. 1–10. 6. M eyer, T. and Globus, A. Direct M anipulation of Isosurfaces
and Cutting Planes in Virtual Environments. Tech. Rep. RNR-93-019, NASA Ames Research Center, 1993.
7. Robertson, J. Electronic structure of SnO 2, GeO 2, PbO 2, TeO 2
and M gF 2. Journal of Physic s C: Solid State Physic s , 12, 1979, pp. 4767-4776.
8. Savin, A., Nesper, R., Wengert, S., and F?ssler, T.F. ELF:
The Electron Localization Function. Angewandte Chemie International Edition in English , 36, 1997, pp. 1808-1832. 9. Silvi, B. and Savin, A. Classification of chemical bonds based
on topological analysis of electron localization functions. Nature , 371, 1994, pp. 683-686. 10. Shoemake, K. ARCBALL: A User Interface for Specifying
Three-Dimensional Orientation Using a ouse. In Proceedings of Graphics Interface ’92, 1992, pp. 151–156. 11. Springmeyer, R.R., Blattner, M .M ., and M ax, N.L. A
Characterization of the Scientific Data Analysis Process. In Proceedings of IEEE Visualization , 1992, pp. 235-242.
Color plate 1. User interface of the VASP data viewer
Color plate 2. Isolating two atoms
Color plate 3. Slice through an SnO 2 crystal