Municipal solid waste composition determination supporting the integrated solid waste management sys
Country report
Municipal solid waste composition determination supporting the integrated solid waste management system in the island of Crete
E.Gidarakos *,G.Havas,P.Ntzamilis
Laboratory of Toxic and Hazardous Waste Management,Department of Environmental Engineering,
Technical University of Crete,GR-73100Polytechnioupolis Chania,Crete,Greece
Accepted 27July 2005
Available online 3October 2005
Abstract
A one-year survey was conducted in the greater region of Crete (located at the lower region of the Aegean Sea)for the purpose of identifying waste composition (including chemical and physical characterization),as well as any seasonal variation.
The investigation was carried out repeatedly at seven land?lls and one transfer station in Crete,in four phases.Each sampling phase corresponded to a season (autumn,winter,spring,summer).ASTM D5231-92(2003)standard method and RCRA Waste Sampling Draft Technical Guidance were used.Hand sorting was used for classifying the collected wastes into the following cate-gories:plastics,paper,metals,aluminium,leather–wood–textiles–rubbers,organic wastes,non-combustibles and miscellaneous.Further analysis included proximate and ultimate analysis of combustible materials.Metals such as lead,cadmium and mercury were also investigated.
The results show that there has been a signi?cant decrease of organic wastes during the last decade due to the increase of pack-aging materials,as a result of a change in consumption patterns.Three main waste categories were determined:organic wastes,paper and plastics,which combined represent 76%of the total waste in Crete.Furthermore,a high fraction of glass and a seasonal variation of aluminium indicate a strong correlation of waste composition with certain human activities,such as tourism.There is also a variation between the municipal solid waste (MSW)composition in the region of Crete (2003–2004)and MSW composition suggested in the National Solid Waste Planning (2000)[National Solid Waste Planning,https://www.360docs.net/doc/cd10366707.html,pletion and particularization of Common Ministerial Act 113944//1944/1997:National Solid Waste Planning,June 2000].
The results of this survey are to be utilized by the regional solid waste authorities in order to establish an integrated waste treat-ment site,capable of ful?lling the regional waste management demands.ó2005Elsevier Ltd.All rights reserved.
1.Introduction
The cornerstone of successful planning for a waste management program is the availability of reliable infor-mation about the quantity and the type of material being generated and an understanding about how much of that material that collection program managers can expect to prevent or capture.E?ective waste manage-ment through MSW composition studies is important for numerous reasons,including the need to estimate material recovery potential,to identify sources of com-ponent generation,to facilitate design of processing equipment,to estimate physical,chemical,and thermal properties of the waste and to maintain compliance with national law and European directives.The composition of generated waste is extremely variable as a conse-quence of seasonal,lifestyle,demographic,geographic,and legislation impacts.This variability makes de?n-ing and measuring the composition of waste more di?-cult and at the same time more essential.
0956-053X/$-see front matter ó2005Elsevier Ltd.All rights reserved.doi:10.1016/j.wasman.2005.07.018
*
Corresponding author.Tel.:+302821037789;fax:+302821037850.
E-mail address:gidarako@mred.tuc.gr (E.Gidarakos).
https://www.360docs.net/doc/cd10366707.html,/locate/wasman
Waste Management 26(2006)
668–679
In Greece several waste composition studies have been conducted in the past twenty years (Parisakis et al.,1990,1991,1992),but they were not carried out using the same method or under a systematic approach dictated by organized regional waste management strat-egies (Table 1).One can observe a correlation between demographic and socio-economic conditions of a region with the respective MSW composition data.Further-more,MSW composition data of National Planning for the year 2000are di?erent from respective data of more recent studies.In recent studies,for example in Salonica and Pylaia in 1998(Papachristou et al.,2002;Koufodimos and Samaras,2002),one can observe a sig-ni?cant decrease of putrescibles (food stu?,leaves,etc.)and a great increase of plastics and packaging material (see Table 1)(Papachristou and Chatziaggelou,1991;Papachristou et al.,2002;PERPA,1985).
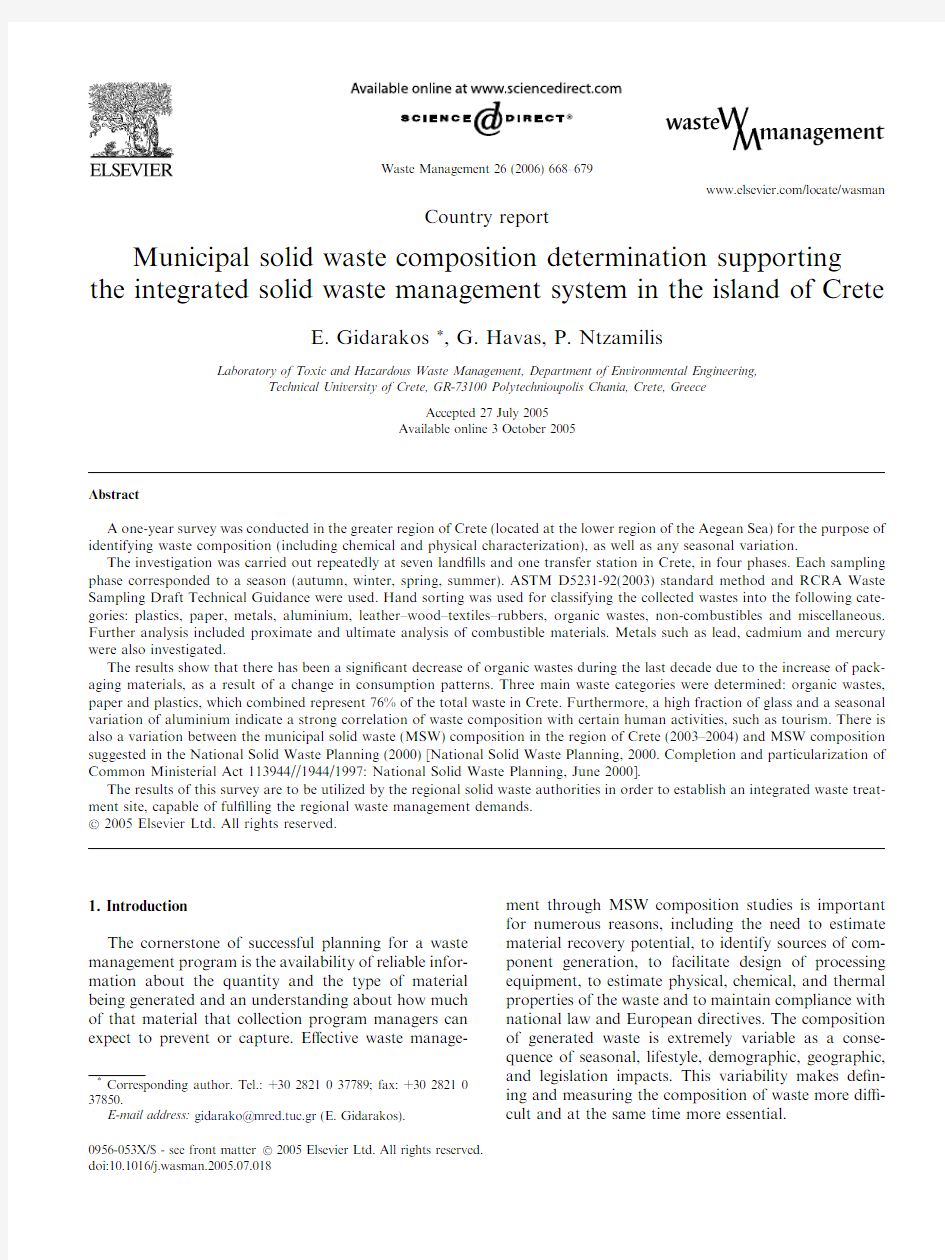
The island of Crete (Fig.1)is one of the greatest tour-ist resorts in Greece (Table 2)and numbers almost half a million residents (2001).Furthermore,Crete is a combi-nation of urban,mountainous,rural and purely tourist regions.Heraklion,geographically located in the centre of Crete (Fig.2)with nearly 140,000residents,is the metropolis of Crete.Chania and Rethymnon lie in the west,and Agios Nikolaos in the east.Regions with high seasonal variability in population due to tourism are Her-sonisos and Malia,located east of Heraklion and west of Agios Nikolaos.Ierapetra,located south of Agios Niko-laos,quali?es as rural mainly because of the numerous greenhouses located there.Taking into account the above special characteristics of the island of Crete,one would expect that a special solid waste management strategy is implemented.Unfortunately,in past years,solid waste management in Crete has consisted mainly of illegal dumping.It was only in the last decade that the ?rst re-gional solid waste management strategy was designed and started being implemented in the region of Chania.According to Waste Framework Directive 75/442/EEC (EEC,1975),member states are obliged to take the necessary measures in order to ensure that the ?nal disposal or exploitation of waste is performed without endangering public health and without causing any damage to the environment.In its 1996Communication on the Review of the Community Strategy for Waste Management 1the EU Commission enacted the waste management hierarchy:prevention/minimization,reuse,recycling,energy recovery and safe disposal.It should be pointed out that this hierarchy is just a proposal and not a result of a detailed environmental and economic eval-uation of each alternative.Such an evaluation has to be performed so that the regional solid waste authorities are able to choose the appropriate management scheme.Essential primary data used in this evaluation are recentreliable waste composition data.
T a b l e 1M S W c o m p o s i t i o n (%)i n s o m e G r e e k r e g i o n s a n d c i t i e s (a d a p t e d f r o m P a r i s a k i s e t a l .),w e t w e i g h t
R e g i o n /c i t y :
A t h e n s 6/83-6/84
S a l o n i c a 4/86-3/87
S a l o n i c a 1998P y l a i a 1998
H e r a k l i o n 1987
R h o d e s 9/87-8/88K o s 1989C h a n i a 1990K o m o t i n i 1992–1993
X a n t h i 1992–1993
K a l a m a t a 1992N a t i o n w i d e p l a n n i n g 2000
P u t r e s c i b l e 595226.64152.542375567624747P a p e r 19.518292317.214
25199152520I n e r t +m i s c .4.5691011.8
5613
11
815.5
L W T R 3.58964546A l u m i n i u m 4
514
0.310
21330.54.5
M e t a l s 3.42.5333P l a s t i c s 77181314.312118677.58.5G l a s s
2.54
4
3
1.4
2
124
22
3
4.5
1
COM 96(399)?nal,30.07.1996.
E.Gidarakos et al./Waste Management 26(2006)668–679669
The primary goal of this study was to develop a rep-resentative,statistically defensible estimation of the waste composition for the region of Rethymnon,Herak-lion and Lassithi (Agios Nikolaos).A survey was con-ducted by the Department of Environmental Engineering of the Technical University of Crete,in the region of Rethymnon,Heraklion and Lassithi,for the purpose of identifying waste composition (including chemical and physical characterization),as well as any
seasonal variation.The sampling plan consisted of one-week sampling period in each of seven land?lls in the region of Crete and was carried out in four phases,corresponding to each season (winter,spring,and sum-mer,autumn)(see Table 2).
In comparing these data with composition data from other regions,certain variations can be observed,which can be attributed to speci?c social activities,such as tourism.This study can hopefully be used to establish a baseline for monitoring progress in achieving waste management objectives and to assist the regional solid waste authorities in setting future policy directions and management priorities.
As it was mentioned above,the geographical areas studied in this analysis are the Prefectures of:Rethym-non,Heraklion and Lassithi in the island of Crete (Fig.2).Regions of Chania and Sitia were excluded from this
study.
Fig.1.Region of Crete.
Table 2
Main characteristics of the study area
Rethymnon
Heraklion Lassithi Population a 81.976292.48957.290b Hotel beds c
24.857
52.616
19.846
a 2001National Census,www.statistics.gr .
b Sitia region excluded.
c
National Tourist Organization (NTO,2002),www.statistics.gr .
670
E.Gidarakos et al./Waste Management 26(2006)668–679
2.Materials and methods 2.1.Waste quantities estimation
The lack of essential equipment (weigh-bridges)at each ?nal disposal site makes the direct determination of disposed waste quantities impossible.Therefore,there is no information on generation rates as a function of season.The estimation of generated quantities of MSW (kg/resident/day)is based on previous studies (Technical Chamber of Greece,1993;OANAK,2000),on o?cial National Census data (2001),as well as on National Tourism Organization (NTO)data for the years 2001/2002.As mentioned above the regions of Si-tia and Chania were not studied.
In this survey the generated MSW quantities in each municipality of the study area were estimated according to the following assumptions:
For communities with population less than 10,000residents:0.8kg MSW per resident per day.
For communities with population more than 10,000residents:1kg MSW per resident per day.
For the Municipalities of Rethymnon,Agios Niko-laos and Ierapetra:1kg MSW per resident per day. For Heraklion:1.2kg MSW per resident per day.
The assumption made for the largest municipalities is based mainly on the Regional Planning of Solid Waste Management for the Prefectures of Rethymnon,Lassithi and Heraklion.
Apart from these quantities,the daily quantities of MSW due to tourism will be taken into account.For the estimation of the number of tourists,o?cial data of NTO are used.The aim of this study was not to verify the reliability of NTO data and therefore these data were accepted as the only available o?cial information.
The estimation of these quantities was carried out using the following data:
The total number of tourist beds in each municipality or community.
The number of tourist beds in use (fullness).
The mean produced quantity of MSW per tourist per day (=1.2kg/tourist/day).
It must be noted that the considered mean produced quantity of MSW per tourist per day is overestimated in an e?ort to take into account unregistered rooms to let (not included in the o?cial NTO data,being used by tourists,visitors,
etc.)
Fig.2.Island of Crete study area (sampling sites are marked with an ‘‘X’’).
Table 3
MSW production estimation for the Prefectures of Rethymnon,Heraklion and Lassithi (2001national census,2001–2002National Tourist Organization data)County
Population
MSW
production (kg/d)MSW
production (ton/y)MSW production from tourists (kg/d)MSW production from tourists (ton/y)Total MSW production (kg/d)Total MSW production (ton/y)Rethymnon 81.97671.37826.05324.113 5.064105.04034.228Heraklion 292.489289.522105.67652.93611.117376.704128.471Lassithi 57.29066.30124.20016.670 3.50175.49930.471Total
431.755
427.201
155.928
93.719
19.681
557.243
193.170
E.Gidarakos et al./Waste Management 26(2006)668–679671
2.2.Waste composition analysis
Sampling was carried out at several?nal disposal sites(land?lls)around Crete,according to international standard ASTM D5231-92(2003),2and RCRA regulation.3
The determination of the mean composition of MSW was based on the collection and manual sorting of a number of samples of waste over a selected time period covering one week for each season and site.Therefore, four phases of seven sampling weeks(twenty eight weeks in total)were carried out.
Vehicle loads of waste were designated for sampling, and a sorting sample was collected from the discharged vehicle load.The sample was sorted manually into waste components.The weight fraction of each component in the sorting sample was calculated by the weights of the components.The mean waste composition was calcu-lated using the results of the composition of each of the sorting samples.
Vehicles for sampling were selected at random dur-ing each day of the one-week sampling period,as to be representative of the waste stream.According ASTM D5231-92,for a weekly sampling period of k days,the number of vehicles sampled each day should be approximately n/k,where n is the total number of vehicle loads to be selected for the determination of waste composition.A weekly period is de?ned as5 days.
According ASTM D5231-92,the number of sorting samples(that is,vehicle loads(n)required to achieve a desired level of measurement precision)is a function of the component(s)under consideration and the con?-dence level.The governing equation for n is as follows: n?et?s=exT2;e1Twhere t*is the student t statistic corresponding to the desired level of con?dence,s the estimated standard deviation,e the desired level of precision,and x is the estimated mean.
Suggested values of s and x for waste components are listed in Table6.Values of t*are given in statistical ta-bles.Table6is the result of one-week sampling at Pera Galinoi land?ll(Fig.2),performed by the investigators, prior to the main sampling period.
Each sorting sample weighed91–136kg and was pre-pared properly(mixed,coned and quartered)from each discharged MSW vehicle load using a front-end loader with at least a1m3bucket.
After sampling,hand sorting was applied for the clas-si?cation of MSW into the following categories:
Organics:
–Paper(all kinds,magazines,newspapers,books, packaging materials,cardboard).
–Putrescibles(food waste,yard waste,leaves).
–Plastics(PVC,PET,HDPE,LDPE,others).
–LWTR(leather,wood,textiles,rubber).
Inorganic:
–Glass(all kinds and colours).
–Metals(all kinds except aluminium).
–Aluminium(all kinds).
–Inert materials(stones,ground,construction and demolition wastes).
Miscellaneous(nappies,sanitary napkins,materials that do not?t in any of the above categories).
Prior to the sampling,land?ll sites were ranked according the following speci?cations:
1.Percentage coverage of urban-tourist and mountain-
ous-rural regions.
2.Total sample size>75%of total MSW production in
the study area.
3.Sampling in regions where a great production
of recycling materials(e.g.,Hersonisos)is expected.
4.Availability of each land?ll during the sampling
period.
According to these requirements,the following sam-pling sites were selected:
Rethymnon Prefecture:
–Amari S.A.sanitary land?ll.
–Maroulas sanitary land?ll.
Heraklion Prefecture:
–Pera Galinoi land?ll(Autumn)and Heraklion Transfer Station(Winter).
–Kazantzakis sanitary land?ll.
–Hersonisos sanitary land?ll.
Lassithi Prefecture:
–Ierapetra land?ll.
–Agios Nikolaos sanitary land?ll.
The above sampling sites appear in Fig.2and are marked with an‘‘X’’.
The laboratory analyses of MSW included:
Proximate analysis:The determination of%moisture content,%ash content,%volatile matter content and the calculation of%?xed carbon.The above analyses were conducted according to ASTM standards E790, E830and E897.
2Standard test method for determination of the composition of
unprocessed municipal solid waste.
3Waste Sampling Draft Technical Guidance,EPA,530-d-02-002.
672 E.Gidarakos et al./Waste Management26(2006)668–679
Elemental analysis:The determination of%content in carbon(C),hydrogen(H)and nitrogen(N).The analyses were conducted according to ASTM stan-dards E777and E778.
Calori?c value determination:According to ASTM standard E955or with other international standard. Heavy metal content determination.
The laboratory sample consisted of four sub-samples: putrescibles(food waste),LWTR,plastics(packaging materials,bottles,etc.)and papers(paper,cardboard ex-cept sanitary papers).The quantity of each fraction was 200–500g according to New Zealand Ministry for the Environment guidelines(Ministry for the Environment, 2002).For the temporary storage and transport of each sample to the laboratory,water-proof sealed bags were used(USEPA,2001,2002).The time interval between col-lection and analysis was1–4h.For the preparation of lab-oratory samples,necessary safety equipment(gloves, masks,goggles)was used,while size reduction of materi-als was achieved using knives and scissors(hand work)so that the moisture content of waste was not a?ected.
For the size reduction a cutting mill(type P-19with cyclone separator,Fritsch GmbH,Germany)was used. Moisture content determination became feasible after 24h of solid waste sample drying(105°C)in an oven (type Jouan EU2118,Innovens).For volatile matter (at950°C)and ash(at550°C)content determination, a furnace capable of high($1200°C)temperatures(type L24/12with control panel B170,Nabertherm)was used. Elemental analysis was performed using an automatic elemental analyser(type CHN600,LECO).The calo-ri?c value of solid waste samples was determined by using a bomb calorimeter(type AC300,LECO).The heavy metal content of samples was determined by?ame atomic-absorption spectroscopy(AAS)(C.A.U.GmbH, Germany).3.Results
3.1.Estimated waste quantity
The estimation of MSW production and disposal in the study area is shown in Table3.Assuming that monthly MSW production from permanent residents is constant,we can assess how tourism a?ects the monthly MSW production.During‘‘high season’’months(months with increased number of tourists),in-creased MSW quantities are produced(tourism e?ect, Fig.3).
3.2.Waste composition
The results of the waste composition analysis for the period2003–2004are shown in Figs.4and5.Fig.6is used to compare current analysis results(mean values) with respective results in other regions of Greece.
Three main waste categories can be identi?ed: Putrescibles Papers and Plastics(P3Dominance),which share about76%of total MSW.Putrescibles represent 39%,while plastics and paper are second with17%and 20%,respectively.The share of glass(7%)is also con-siderable,mainly consisting of disposable(not re?ll-able)bottles.Especially in tourist regions such as Hersonisos and Malia,the glass share reached18%in autumn.
Inert materials are particularly low(2%),as construc-tion and demolition wastes(C&D wastes)are trans-ported to separate disposal sites.
A great seasonal variation in the glass fraction(au-tumn and summer>6.5%,winter$4%),mainly in re-gions of intense tourist activity(e.g.,Hersonisos with peak value$18%)was identi?ed.It was also found that there is an extended use of non-re?llable,non-returnable bottles(e.g.,bottles of low alcohol drinks).
Table4
Laboratory analysis of MSW(mean values a)
Putrescibles LWTR b Plastics Papers Total RDF c %Moisture66.9921.41 2.9317.1136.7211.65 %Ash9.728.86 2.397.077.30 5.31 %Volatile matter76.6983.8794.9584.0983.1988.63 %Fixed carbon13.607.27 2.678.849.52 6.07 C(%)45.5644.9979.5344.4953.0059.20 H(%) 6.24 6.0110.64 6.587.328.22 N(%) 2.290.550.460.57 1.320.52 HHV(kJ/kg) 6.15014.12938.63114.10616.13924.414 LHV(kJ/kg) 4.56312.77136.22812.62214.40822.558 Pb(ppm)na na na na16.7na
Cd(ppm)na na na na0.07na
Hg(ppm)na na na na0.02na na,not available.
a Dry weights.
b Leather,wood,textile,rubber.
c Refuse derive
d fuel,consists of paper,plastics and LWTR fractions.
E.Gidarakos et al./Waste Management26(2006)668–679673
There is also a great seasonal variation for the alu-minium fraction (autumn and summer $2%,winter <1%).Its absolute value is similar to the one in other re-gions in Greece (Fig.7).
Comparing the winter and summer periods,there is a signi?cant decrease in the concentration of papers ($23%),while metals ($3.5%)bulky materials and old cars (end-of-life vehicles)concentrations are not present.Furthermore,in Ierapetra,where there is an extensive use of greenhouses,there is a great seasonal variation of plastics share in MSW.This variation was named ‘‘green e?ect’’(Fig.8).
The ‘‘miscellaneous’’fraction in MSW is the result of the co-mixture of organics (putrescibles)with other fractions.
Furthermore,a comparison of the MSW composi-tion in the region of Crete (2003–2004)and the MSW composition suggested in the National Solid Waste Planning (2000)demonstrates a great
variation.
Fig.3.Monthly variation of MSW production (tourism e?ect),wet
weight.
Fig.4.Waste composition analysis (annual),wet weight.
674 E.Gidarakos et al./Waste Management 26(2006)668–679
As far as the proximate analysis is concerned,a resemblance(HHV,LHV,%moisture content)and a lower value of C/N ratio(20.4)in compari-son to other regions in Greece(Chania,Kos) was found.
The heavy metals content did not present any remarkable di?erence compared to the one available for Chania or Kos(Tables4and5).
Speci?c gravity of waste was determined to be130–135kg/m3,showing no considerable
variance.
4.Discussion
According to the ASTM D5231-92(2003)standard method,a full year of sampling at several ?nal disposal sites around Rethymnon,Heraklion and Lassithi was conducted (see Table 6).
This test method is applied for the determination of the mean composition of MSW based on the
collection
676 E.Gidarakos et al./Waste Management 26(2006)668–679
and manual sorting of a number of samples of waste over a selected time of period covering a minimum of one week.This test method includes procedures for the collection of a representative sorting sample of unprocessed waste,manual sorting of the waste into individual waste components,data reduction,and reporting of the results.
This test method may be applied at land?ll sites, waste processing and conversion facilities,and transfer stations.Its level of con?dence and precision values are,respectively,90%and0.1%.
Current studies results are related to each region sam-pled.A higher share of putrescibles was found in rural regions,whereas a higher share in papers and plastics was determined in urban regions.
Some useful remarks can be noted by observing study results:
There is a clearchange in waste composition during the last decade.
There is a strong relationship between certain social activities(e.g.,tourism)and MSW composition.
There is a variation in the MSW composition among di?erent regions of the country.
There is a variation between National Solid Waste Planning and the current situation in Greece regard-ing the MSW composition.
Speci?cally,while in the previous decade(1985–1995, Table1)the putrescibles share was about55–67%,in re-cent years(1995–2003,Table1,Fig.7)this share has de-creased to27–41%,while National Solid Waste Planning (2000,Table1)suggests a concentration of47%.
Comparing the two decades,a40%decrease of putrescibles share can be observed.This reduction can be explained by an increase of plastic and paper concen-trations.In the previous decade(1985–1995)papers ac-counted for no more than20%and plastics for less than 10%.In contrast,recent studies(1995-current)suggest that papers now comprise25%and plastics percentage doubled reaching20%.This represents an increase of 25%for paper and100%for plastics,or60%in total. In the most recent studies(Salonica1998,Pylaia1998 and Cretan Region2003–2004),there is also an increase in packaging materials.This change is not only a result of the prevailing consumption patterns,but also an out-come of modern practices for marketing of products and goods.
The main point of this study is P3Dominance (Putrescibles,Papers and Plastics)which share in total about76%of MSW.Papers and plastics comprise to-gether about37%or71,000tonnes per year of MSW. This relatively high share of plastics and papers in Crete can be attributed to the extensive use of paper packaging
Table5
Physicochemical analysis of MSW in the region of Crete and in other regions
Region of Crete a Municipality of Chania Municipality of Kos Municipality of Pylaia
%Moisture content36.7b40.830.140.6
%Ash content7.21 3.7 3.9 6.2
HHV(kJ/kg)
Putrescibles 6.6297.0637.410 4.892
Paper14.106––12.037
Plastics38.155––32.617
LWTR13.733––15.617
LHV(kJ/kg)
Putrescibles 5.237 5.524– 1.486
Paper12.621––10.123
Plastics35.702––29.003
LWTR13.069––13.810
C/N20.429.3–25.36
Lead(Pb)(ppm)16.821.4B(d)16.8C(d)7.6
Cadmium(Cd)(ppm)0.070.6B(d) 1.5C(d)0.4
Mercury(Hg)(ppm)0.02–––
d,dry fraction;B,analysis aiming to biological stabilization;C,analysis aiming to combustion.
a Prefectures of Rethymnon,Heraklion and Lassithi,2003–2004.
b Calculation based on mean values of moisture content in each laboratory analysis sub-sample and the%share of each fraction in MSW as determined by?eld analysis.
Table6
Values of mean(x)and standard deviation(s)for within-week
sampling to determine MSW component composition(Pera Galinoi
land?ll,Heraklion,Crete,2003)
Component Standard deviation(s)Mean value(x)
Inert0.46 1.93
Metals 1.79 4.44
Aluminium0.66 3.01
Glass0.52 4.58
LWTR 1.22 3.60
Paper 6.7419.71
Putrescibles 1.9635.45
Plastics 5.6122.49
Misc. 1.33 4.79
E.Gidarakos et al./Waste Management26(2006)668–679677
materials(especially in summer)and mass production of greenhouses wastes(plastic?lms).
The concentration of plastics is higher in winter and autumn(Fig.8),likely as a result of the extensive use of plastics in greenhouses construction.Greenhouses are the major waste producers in Crete(as far as plastics are concerned)and that is why the Municipality of Iera-petra(where most greenhouses are constructed)pro-duces by itself more than30%of the total MSW in Lassithi Prefecture(Fig.6).
The concentration of papers in the Municipality of Agios Nikolaos is also high,as a result of high levels of tourist activities(hotel accommodation,paper pack-aging materials like tetrapak,etc.).
In regions of intense tourist activity(Prefectures of Rethymnon,Heraklion and Lassithi),this study also re-vealed an increased share of glass.Speci?cally,glass reached7%,while in mainly tourist regions,such as Her-sonisos and Malia,it was18%.In comparison,a recent study of Salonica(1998)showed glass share to be about 3%.This di?erence may be explained by the fact that the ratio between the number of tourists and the permanent population is considerably lower in Salonica than in Her-sonisos.Furthermore,glass bottles(e.g.,juices,beer)that are consumed in non-tourist regions are mainly re?llable, while in Hersonisos signi?cant quantities of non-re?llable bottles(mainly low-alcohol drinks)are consumed.
Moreover,it is obvious that modern living standards considerably a?ects MSW composition.For example, in the rural region of Rodopi(Komotini,1993,Fig.1) the putrescibles share is67%while in the metropolis of north Greece,Salonica(1998),it is only27%.The putres-cibles concentration in the region of Crete(2003–2004)is 39%(annual mean value).The same e?ect of the living standards on MSW composition is also observed among the various municipalities of Crete.For example,in the region of Nikos Kazantzakis municipality,a region mainly rural,the putrescibles fraction is almost45%.
Comparing the region of Chania(Chania,1990)with the results of this study,an important di?erence in MSW composition can be noticed.Speci?cally in1990 the putrescibles concentration in Chania region reached 55%,while the corresponding concentration for the re-gions of Rethymnon,Heraklion and Lassithi is now about39%.Taking into account the fact that between the four regions of Crete there are not any important di?erences regarding the total socio-economic character-istics,one can claim that in Crete,in the last decade,the putrescibles content has decreased considerably.This is in accordance with the total change of MSW composi-tion for the whole country that was reported previously.
Furthermore,the highest putrescibles share(41.3%)is observed at Lassithi Prefecture,likely because of the greenhouses operation(not sold putrescibles quantities).
Also,the information published by the National So-lid Waste Planning(2000)presents an important di?er-ence from the results of newer studies(Salonica1998, Pylaia1998and Region of Crete2003–2004).Therefore, the MSW composition that is suggested in the National Solid Waste Planning is not suitable for direct applica-tion in Crete,as it does not consider the local peculiar-ities and social characteristics of the area or the seasonal variations(tourist period).
In order to compare MSW laboratory analysis data with respective data from other regions of Greece,the Municipalities of Chania,Kos and Pylaia(Fig.1)are used.The?rst two municipalities perform in similar way with the region studied,regarding the activities of MSW production,as they are mainly tourist attractive regions.The comparison with the Municipality of Pylaia is useful to test whether di?erent activities and consump-tion patterns and habits are the cause of di?erences in MSW composition.
No di?erences can be identi?ed between the region of Crete(2003–2004)and the region of Chania(1990)(and partly the region of Kos)regarding the MSW calori?c value(HHV and LHV)and the moisture content.The C/N ratio in the region of Crete(2003–2004)has a lower value compared to other regions.The heavy metals con-tent(Pb,Cd and Hg)does not present any remarkable variations between the di?erent studied regions.
5.Conclusion
This study was carried out in order to establish up-to-date waste composition data for local solid waste authorities.
This analysis revealed that in the study area(Rethym-non,Heraklion and Lassithi),there is a strong correla-tion between certain social activities and solid waste composition and quantity.The main activities reviewed in this study are tourism and cultivation.During‘‘high season’’months(months with increased number of tour-ists),not only are increased MSW quantities produced, but also MSW composition is accordingly altered.High fractions of materials like aluminium cans and glass bot-tles(especially non-re?llable ones)and paper and/or plastics packaging materials are representative charac-teristics of intense tourist activities and greenhouses operation in the area.This double impact phenomenon (quantity and quality)was named‘‘tourism e?ect’’and ‘‘green e?ect’’(Figs.3and8).This relationship is a peculiarity of tourist regions and as a result,solid waste authorities have to consider it in Integrated Solid Waste Management Planning.
Of course,tourism and greenhouses are not just a Greek problem,but they are an international one,too. There are still a lot of illegal dumping sites in Greece and Europe,and therefore this methodology and the re-sults of this study are a valuable tool to every solid waste manager.
678 E.Gidarakos et al./Waste Management26(2006)668–679
Comparing the MSW composition data from the present study with other regions?data,various MSW composition changes can be identi?ed.Putrescibles con-centration decreased and papers–plastics concentration increased during the last decade.Moreover,composi-tion data shows a di?erence between various regions in Greece(rural and urban).
In addition,there is a disparity between MSW com-position in the region of Crete(2003–2004)and MSW composition suggested in the National Solid Waste Planning(2000).This is observed not only in the putres-cibles and plastics fractions,but also in materials that seem to have an important seasonal variation in the re-gion of Crete(e.g.,glass).Hence,MSW composition data of National Solid Waste Planning cannot be ap-plied in the region of Crete or in other regions with sim-ilar characteristics to Crete.
This study is the?rst integrated study in Greece,con-ducted in such a great number of?nal disposal sites. Moreover,it was conducted at various types of?nal dis-posal sites(sanitary or not)and transfer stations,so that this study can be utilized in other areas nationally or internationally.
In order to accommodate this study,weigh-bridges have to be installed and used at every?nal disposal site, so that there is a continuous data logging of waste quan-tities produced.The present study is the?rst step to-wards an Integrated Solid Waste Database for the region of Crete.
Acknowledgement
The?nancial support of the United Association of Waste Management of Crete(E.S.D.A.K.)is greatly acknowledged.
References
East Crete Development Association(OANAK),Paraskevopoulos–Georgiades Ltd.,2000.‘‘Integrated Solid Waste Management
Planning in the Region of Crete’’.Regional Corporate Planning of Crete1994–1999,October2000.
EEC,1975.Council Directive on Waste,No.75/442/EEC,July 1975.
EPA,2002.‘‘RCRA Waste Sampling Draft Technical Guidance Planning,Implementation,and Assessment’’,EPA530-d-02-002, August2002.Available from:
Ministry for the Environment,New Zealand,2002.‘‘Solid Waste Analysis Protocol’’,ISBN0-478-24058-9,March2002.Available from:
National Solid Waste Planning,https://www.360docs.net/doc/cd10366707.html,pletion and particulariza-tion of Common Ministerial Act113944//1944/1997:National Solid Waste Planning,June2000.
Papachristou,E.,Chatziaggelou,H.,1991.Qualitative and Quantita-tive Analysis of Municipal Solid Waste of Rhodes,AUTH. Papachristou, E.,Ntarakas, E.,Mpellou, A.,Sfetkos.Ioannidou, Alivanis,K.,Petridis,G.,Savvidis,I.,2002.Qualitative and Quantitative Analysis of Municipal Solid Waste of Thessalonica.
In:Proceedings,1st Congress of Hellenic Solid Waste Management Association,Athens,28/2/2002–2/3/2002.
Parisakis,G.,Skordilis, A.,Andrianopoulos, A.,Lolos, C., Andrianopoulos,J.,Tsompanidis,X.,Lolos,G.,1990.Qualita-tive and quantitative estimation of domestic waste of Chania.
NTUA Laboratory of Analytic and Inorganic Chemistry,Athens 1990.
Parisakis,G.,Skordilis,A.,Andrianopoulos,A.,Lolos,C.,Andria-nopoulos,J.,Tsompanidis,X.,Lolos,G.,1991.Qualitative and quantitative estimation of domestic waste of the Island of Kos.
NTUA Laboratory of Analytic and Inorganic Chemistry,Athens 1991.
Parisakis,G.,Skordilis,A.,Andrianopoulos,A.,Lolos,C.,Andria-nopoulos,J.,Tsompanidis,X.,Lolos,G.,1992.Physicochemical characterisation of municipal solid waste of Kalamata.Estimation in regard to compost production potential.NTUA Laboratory of Analytic and Inorganic Chemistry,Athens1992.
PERPA,1985.‘‘Domestic waste composition study with statistically admissible methods in the wider Athens region’’.ESDKNA, Athens1985.
Technical Chamber of Greece,1993.Solid Waste Management Study, Athens1993.
United States,Environmental Protection Agency,2001.Environmen-tal Investigations Standard Operating Procedures and Quality Assurance Manual,November2001.
United States,Environmental Protection Agency,2002O?ce of Solid Waste,Decision-Makers Guide to Solid Waste Management, Volume II,(EPA/530-R-95-023),August2002.
E.Gidarakos et al./Waste Management26(2006)668–679679
企业生产的七大浪费
企业生产的七大浪费 1.等待浪费 等待并非加工过程,不能改变物料的形状、尺寸、性质和状态从而改变韧料的功能,所以等待不创造价值。 待工和待料是两种最常见的等待情形。常见的等待现象有:物料供应或前工序能力不足造成待料,监视设备作业造成员工作业停顿,设备故障造成生产停滞,质量问题造成停工,型号切换造成生产停顿。 造成等待的常见原因有:流水线能力不平衡,计划不合理,设备维护不到位,物料供应不及时等。 2.搬运浪费 搬运也非加工过程,不能改变物料的形状、尺寸、性质和状态从而改变物料的功能,而且搬运过程中的放置、堆积、移动、整理等造成空间、时间、人力和工具等浪费,可谓费时费力费资源。 3.不良浪费 美国零缺陷大师克劳斯比说:“任何事情没有一步做到位都会造成额外或本。”质量不良也不例外。常见的不良浪费有:材料损失,设备折旧,人工损失,能源损失,价格损失,订单损失,信誉损失等。 4.动作浪费 多余的动作、不合适的动作增加员工作业强度、降低生产效率,因此也是一种浪费。 常见的浪费动作有:两手空闲,单手空闲,作业动作停止,动作幅度过大,左右手交换,步行多,转身角度大,移动中变换动作,未掌握作业技巧,伸背动作,弯腰动作,重复动作及不必要动作。 5.加工浪费 每提高一级加工精度将增加数倍甚至数十倍的费用。过高的加工精度造成浪费,它付出了额外的成本,或造成了不必要的高质量。 常见的加工浪费情形有:加工余量过大、过高的精度、不必要的加工等,其造成的浪费有:设备折旧、人工损失、辅助材料损失、能源消耗等。 6.库存浪费 制造型企业通过物料的大进大出实现产品增值和资金流动,从而创造利润。现场物流直接服务于这一重要的目的,所以,使现场物流有序、顺畅、高效,是现场改善的重要方面。库存是一种等待状态,违背上述目标就造成额外成本。’ 企业内常见的库存形态有:原材料、零部件、辅助材料库存,半成品、在制品库存、成品、在途品库存等 库存将带来额外的搬运储存成本,造成空间浪费,占用资金及孳生的利息和可能的投资回报损失,还有可能使物料价值衰减造成呆料废料,造成先进先出作业困难。库存会掩盖诸多问题、造成假象,难怪日本专家大声疾呼”库存是万恶之源”。 7.制造过多、过早浪费 制造过多、制造过早都会造成库存,违背“适品,适时,适量”的准时制生产(J1T)原则。可能造成的浪费有:造成在库、计划外消耗或提早消耗.增加滞留在库的风险,降低应对变化的能力等,由于各种浪费消耗了企业资源,降低了经营效率,反过来制约了企业的订单履行,必将造成第八种浪费——缺货损失。缺货损失是企业最严重的损失,主要有:紧急订单造成的额外成本,延迟订单造成的额外成本,订单取消造成的利润损失,还有一次严重的缺货或多次发生缺货势必造成机会损失、客户流失最终导致市场机会损失。市场机会损失是巨大的,F}j于客户的相互影响,其损失难以用数量来衡量。
精益七大浪费八大浪费及现场七大效率损失改善法(权威分享含参考答案)
制造不良品的效率损失(上) 产生不良的损失原因分析与改善策略 (一)产生不良效率损失的原因 制造不良品的浪费应该包括以下几种: 基本浪费 当产生不良品时,会造成原材料、人工、设备、能源、管理费用等成本浪费。 返修和报废的浪费 不良产品需要返工修补时,会产生额外的修复、选别、检验等成本浪费,报废则意味着完全的损失。 救火成本 若产生不良品,订单交期可能因此而延误,会产生比如紧急换线、调货、加班、海运变空运等等的救火成本。 防火成本 防火成本是指为了预防救火成本的出现而投入的管理成本。 不良品未被发现而继续向后流出的损失 如果一个不良品在产生的第一时间没有被发现,其结果很可能造成大批量的返工,大批量的返工会产生连锁反应。比如,大批量的返工可能会影响企业的生产进度,导致生产计划的变更。而生产计划的变更,会导致产品来不及交付,还可能会影响到别的订单的产品,致使整个生产进度都会受到波及干扰。同时可能出现救火成本和预防这种情况出现的防火成本。 在管理上这叫做一人错误百人忙,它是一种成本扩大的连锁效应。 图6-1 成本倒增曲线 【图解】 通常一个错误往后传递,会产生所谓的“成本倒增曲线”。这个曲线在日本有一个指数是1:35:600。 它指的是,在产生不良品的第一个时间点进行改正,可能纠正的成本只要1元人民币。若这个错误往后传 递到下一道工序、工段或部门后再被发现,企业需要弥补错误的成本可能是35元人民币。而在更后面的流 程中被发现,弥补错误的成本可能要高达600元人民币。 比如,技术部门的一张图纸上有一个技术参数写错。在技术部门更改,可能3分钟就解决了,也许成 本会低于1元人民币;若这张图纸的错误没有被发现,已经进入车间开始裁减材料时才被发现,可能成本 是35元人民币;假如这时还没有发现错误,继续往后倒流,员工按照图纸进行加工,在做了500个或1000 个以后,到质量检验的时候才发现错了,这个时候要返工,很可能要花600元人民币的代价才能弥补这个 错误。 (二)产生不良效率损失的改善策略 一个产品不良的错误会产生很多的波动,而且每一个波动都会带来变化。假设在生产流程中有一次不良品,就可能会有500个不良品必须返工,这就会产生变化。企业的生产计划要变更,所有物料供应计划要变更,所有生产工艺准备的时间计划也要变更。只要波动的来源不消除,企业的生产计划就永远跟不上变化。因此,要消除产生不良品的效率损失,关键
SOLIDWORKS培训试题带答案
SOLIDWORKS培训试题 姓名得分 一.填空题(每题2分,共20分) 1、Solidworks提供了两种生成孔特征的方法,分别是简单直孔和(异型孔)。 2、根据草图的尺寸标注,可将草图分为(欠定义)、完全定义和过定义3种状态。 3、不同类型的文件,其工作环境是(不同的)。 4、镜向的对象既可以是实体也可以是(特征)。 5、在Solidworks中,零件的配合类型有标准配合和(高级)配合两类。 6、工程图中的尺寸由尺寸数字、尺寸线、(箭头)、延伸线等要素组成。 7、扫描特征只能有一条(扫描路径)。 8、旋转特征方式草图中不允许有多条(中心线)。 9、临时轴是在创建圆柱和(圆锥体)时隐含生成的。 10、在Solidworks中设计钣金零件,必须是同一(厚度)的。 二.选择题(每题3分,共30分) 1、Solidworks的主要建模技术是(B)。 A、参数建模 B、特征建模 C、基础特征建模 D、附加特征建模 2、在新建Solidworks文件对话框中,新建文件类型有(A)种。 A、3 B、2 C、1 3、在Solidworks特征管理设计树中包含(B)基准面。
A、后视 B、右视 C、左视 D、下视 4、9、草图绘制/退出草图的按钮图标是(A)。 A、B、C、D、 5、在Solidworks中要选择多个图形要素应按住(C)键。 A、Ctrl B、Shift C、Tab D、Enter 6、在Solidworks中,绘制的多边形边数最多为(A)。 A、40B、30C、100D、60 7、改变绘制好的椭圆的形状,可以进行如下操作:(B)。A、按住Ctrl键B、左键拖动特征点 C、右键拖动特征点D、Ctrl+Shift键 8、下面中的(B)选项,只有部分零部件模型数据装入内存A.零部件的压缩B.零部件的轻化 C.零部件的隐藏 9、利用旋转特征建模时,旋转轴和旋转轮廓应位于(C)中。A、同一草图中B、不同草图中 C、可在同一草图中,也可不在同草图中 10、Solidworks的文件类型有(A)。 A、sldprtB、dwgC、docD、jpg 三.判断题(每题3分,共30分) 1、SolidWorks可以改变背景颜色。(√) 2、文件属性的信息可以自动插入到工程图中标题栏里。(√)
管理中的七大浪费,比生产七大浪费更重要
管理中的七大浪费,比生产七大浪费更重!!导读( 文/ e-works整理) 大家都知道著名的精益生产七大浪费(TIMWOOD),而事实上,如果管理工作不到位,也会造成极大的浪费! 1 浪费1——管理工作“等” 在管理工作中,等待的浪费主要表现在以下几面: 等待上级的指示:上级不安排工作下级就坐等,上级不指示下级就不执行,上级不询问下级就不汇报,上级不检查下级就拖着办。多干事情多吃亏,出了问题怎么办?听从指示没有错,再大责任可分担。很多工作是在多次检查和催办下才完成的,造成极大的浪费。 等待下级的汇报:任务虽已布置,但是没有检查、监督。不主动深入调查情况,掌握第一手资料,只是被动地听下级汇报,不做核实就做决定或者向上级汇报,出了问题,责任还可以往下级身上推。 等待对的回复:我已与对联系过,什么时候得到回复我无法决定,延误工作的责任应该由对负责,我只能等。追究责任也不怕,我某月某日把这份文件送给对,
这里记录得很清楚,对不回复我能怎么办?你还是和对联系一下吧,以免耽误工作。 等待生产现场的联系:职能部门不主动去为现场提供服务,而是坐等现场的联系,有时还很不耐烦,认为多等一会有什么了不起,却没有设身处地去为现场着想,重地影响了生产现场问题的及时解决。 这些“等待”在工作中是大量存在的,主要是中层管理人员缺乏责任心和主动精神,不愿意承担责任。对于这种浪费,我们认为,根据不同企业的文化氛围,如果不能用Y理论激励员工去消除等待的浪费,就需要用X理论去加强管理,例
如对于较重要的工作,可以用5W1H来进行计划分解,然后进行控制、检查和考核。实际上,X和Y理论都不能从根本上解决问题,X+Y相辅相成也更好一些。2 浪费2——管理工作无序 “没有规矩,不成圆”,这句古语说明了秩序的重要性。缺乏明确的规章、制度、流程,工作中容易产生混乱,这是众所知的。但如果有令不行、有章不循,按个人意愿行事造成的无序浪费,更是非常糟糕的事。
提案改善 七大浪费试题 题库教学文稿
提案改善七大浪费试 题题库
七大浪费及提案改善试卷(一) 姓名:单位:日期:分数: 一、填空题:每空2分,共30分 1.浪费就是不产生任何附加价值的动作、方法、行为和计划等。 2.精益就是不断压缩从客户下单的那一刻起直到我们收到货款所用的时间,我们通过减少无附加值的浪费,缩短时间。 3.七大浪费指的是过量生产、过度加工、等待浪费、库存浪费、搬运浪费、不良品浪费、动作浪费。 4. 过量生产浪费指的是生产的产品超过客户需要的量; 5.消除浪费法是指以识别浪费、消除浪费的角度出发,通过观察分析浪费现象发现改善点。 6.等待浪费是流程中缺乏流的概念,导致材料、劳动力和工时的浪费; 7.库存浪费在精益中被视为万恶之源,这是因为如果容忍它,就不会认真改善其他浪费。 8.寻找浪费遵守三现原则,指的是现场、现实、现物。 9.改善提案是指已经取得改善成效、已经结案的提案改善过程的总结性报告,是在有效的改善完成以后形成的完整案例备档的报告书。 10.ECRS原则指的是取消、合并、重排、简化。 11.经济动作原则的四个要点是:减少动作数量;追求动作平衡;缩短动作移动距离;使动作保持轻松自然的节奏。 二、选择题:每题3分,共45分(多选题答对2个以上给1分,全对得满分) 1.动作经济原则是(ABC ) A使用身体的原则, B作业场布置的原则,还有 C关于工具、机器的原 则 D 使用身体简化程序原则 2.关于工具,机器的原则有(ABCD)A有效果地使用脚;B工具统一为一个;C材料或零件要拿取容易;D手柄应成有效率的模样,放置有效的位置上。 3.下边哪些是经济动作的要点(ABCD)A减少动作数量;B追求动作平衡;C缩短动作移动距离;D使动作保持轻松自然的节奏。 4.下面关于过量生产描述正确的有(ABCD)A、常被视为最大浪费。B过量生产导致库存、资金的占用以及潜在的报废风险。C过早生产或在线库存都视为过量生产;D 过量生产生产出无价值的产品 5.精益思想告诉我们()A需要创造附加价值的活动;B 改善不创造附加价值但现在需要;C除去不创造附加价值的东西。 6.如何界定创新与改善(ABCD) A创新基于方针管理的要求,目的是寻求突破,更上一层楼; B 改善基于日常管理的要求,目的是挖掘潜能,量变引起质变;
(完整版)SolidWorks高级培训手册(全套教程)
SolidWorks 高级培训手册 目录 基础知识 第一课介绍基础知识 第二课薄壁零件基础知识 高级零件建模 第一课复杂外形建模第一部分高级零件 第二课复杂外形建模第二部分高级零件 第三课曲面建模高级零件 钣金 钣金钣金 高级装配建模 第一课自顶向下的装配体建模高级装配 第二课在装配环境下工作高级装配 第三课装配体编辑高级装配 第四课型芯和型腔高级装配 工程图 工程图工程图 1、培训手册: SolidWorks基础知识 第一课介绍SolidWorks高级培训手册 2、基础知识 SolidWorks高级培训手册 基础知识第一课介绍 在成功地学完这一课后,你将能够: 描述一个基于特征的,参数化实体建模系统的主要特色 区分草图特征和直接生成特征 认识SolidWorks用户界面的主要内容 解释如何用不同的尺寸标注方法来表达不同的设计意图 3、基础知识 第一课介绍SolidWorks高级培训手册 4·基础知识 SolidWorks高级培训手册基础知识第一课 关于本课程本课程的目的是教授你如何使用SolidWorks自动机械设计软件来创建零件和装配体的参数化模型,以及如何绘制这些零件和装配体的工程 图。 SolidWorks是一个强劲且功能丰富的应用软件,以致于本课程不可能 覆盖此软件的每一个细节和方面。因此,本课程重点教授你成功应用SolidWorks所需的基本技能和概念。你应该把本培训手册当作系统文 档和在线帮助的补充而不是替代品。一旦你对SolidWorks的基本使用 技能有了较好的基础,你就能参考在线帮助来得到关于不常用的命令 选项的信息。 前提条件我们希望参加本课程学习的学生具有如下经验:
生产管理工作中的七大浪费Microsoft Word 97 - 2003 文档 (3)
生产管理工作中的七大浪费是什么? 很多企业在生产管理中,因管理不当而造成了很多的浪费,企业的生产成本提高了,其中管理中的七大浪费为: 一、等待的浪费 等待上级的指示。等待外部的回复。等待下级的汇报。等待生产现场的联系。 二、协调不利的浪费 工作进程的协调不利。领导指示的贯彻协调不利。信息传递的协调不利。ERP业务流程的协调不利 三、闲置的浪费 固定资产的闲置。职能的闲置或重叠。工作程序复杂化形成的闲置。人员的闲置。信息的闲置。 四、无序的浪费 职责不清造成的无序。业务能力低下造成的无序。有章不循造成的无序。业务流程的无序。
五、失职的浪费 在体系管理中,许多应该日常进行的工作基本上没有认真去做,不重视日常规范管理,缺乏基础工作,审核前突击进行表面工作,来应付审核,则实际效果就可想而知了。在公司布置的工作,没有按计划要求去完成,做一些表面文章,去应付公司的检查。如果再加上承担检查工作的人员也进行应付,或者碍于情面不予指出,就会形成空对空。在涉及系统性和流程性工作时,某些环节特别是前段如果不认真,则将对后续工作产生较大的影响,例如交货期确认不准确、不及时,就会导致生产制造系统出现多种浪费。在工作中没有计划,没有自查,做事只做前面,随着时间的推移,后面的就忘做了甚至不做了。工作缺乏主动,让做什么事,只是应付了事,而不是自己严格要求要做得更好。应做的事,不会做,说一声不会做就不用再做了,不会也不学,不认为站在这个岗位上不会做应当做的事是一种耻辱,更有甚者,告诉如何去做都不做。这些失职都对工作产生极
大的危害。昨天的事今天没有结果,明天做什么也不知道。 六、低效的浪费 工作的低效率或者无效率。相对于管理工作的高效率而言,低效率造成的隐性浪费是非常大的;原来只要一个人承担的工作,需要两个以上人员来完成;应该按计划完成的任务反复拖期。 七、管理成本的浪费 计划编制无依据。公司没有下达指标,部门无法编制自身的工作目标。公司的目标、指标下达后却不知道怎么分解。部门领导没有告诉做什么工作,不知编制计划。计划不如变化快,无法序时地编制计划。综合部门不催不报计划或忘记申报计划,没有日常工作的积累和统计基础,没有定额标准无法编制计划等。没有计划工作概念,没有长远工作规划,工作随想随做,为完成综合计划部门的要求临时\"拍脑子\",上报的计划缺乏可执行性、漏洞百出,需要计划综合部门另外花费大量的时间和人力去分析和查找错误,重新修改和调整,造成极大的浪费。 计划执行不严肃。有计划但领导没有给我,我不知道计划的内容所以无法执行。计划变化过快使计划无法执行。领导临时交代或安排的工作所以没有计划。计划工作由于前道环节工作没有完成致使计划无法完成。计划由于各种原因被迫频繁调整。公司制订的目标、指标由于执行有困难而不予落实执行,按照自己想象的内容去执行。计划编制后根本不看,至于计划的内容是什么都不知道。如:降成本的计划、降成本的项目计划不严格执行,束之高阁。
工业工程 七大浪费
1 七 大 浪 费 1、价值与浪费 在实际生产与工作中,精益生产将所有的工作都被定义为增值活 动(Value-added)与非增值活动(Non Value-added ) 价值指的就是增值活动,而增值活动的定义有三条,满足任何一条 均认为是有价值的,即增值活动。 1) 顾客愿意为之支付的活动 2) 产品和工作有物理或实质上的改变 3) 工作在第一次就被做对 举例: 1)因为客户的原因,将产品的设计弄错,而导致工厂整批产品不 能按期交货,而且需要延期返工才能交货,而此时客户愿意支付返工费和延长交货期。则这样的返工则是增值活动,他同样为工厂创造了价值,因为是顾客愿意为之支付。 但如果是工厂方因为疏忽导致产品延期交货的,则客户不但不会支 付返工费,还要追究因延期交货而带来的损失。即使客户愿意返工,也是工厂来承担返工费,所以这样的则被认为是不增值的。 2)将客户提供的需求订单,通过计算机处理转变为各个部门的生 产计划; 产品的组装和拆分均被认为是增值活动,因为信息的形式发生了变化,产品也发生了物理的变化,被认为是增值。 3)对产品的检查要在第一次就能发现问题,而不是待到最终组装 时才发现问题,则此时的发现则是不增值的,因为在这个时间段内产
2 精益生生了更多的不良品。 浪费(MUDA )指的就是不增值的活动。在我们的生产中有很多 活动是不增值的活动,这其中包括搬运、检验、储存等。 因为在企业的实际生产中这些浪费有些事必不可少的,同时从某 种意义上,他们的存在也是必须的,因为往往被忽视,而把这样的浪费看成一种常态。只有通过工业工程的专业工具才能分析出这些浪费,从而得到改善。但精益生产则将这些浪费归纳为7大浪费,从而在现场中更容易识别和发现。 客户将订单发至给工厂端生产,工厂端开始采购原材料,生产车 间开始加工,加工后品质部门检验合格后,告知发货单位,将成品发至客户指定的地点。在这一系列的过程中,真正的价值很少,而绝大部分都是MUDA ,所以为了更好的为客户创造价值,应尽可能减少浪费,从而使整个成本更低,交货时间更短。 通常情况下,价值和浪费的比例是1比200到300,有的甚至到 1000。这似乎听起来有些不可思议,但事实上确实如此。 2、为什么要识别价值 产的原理与原则为:价值、价值流、一个流、拉的系统、完善。 解释:从各项活动中识别价值,把所有的价值活动形成价值流, 使这个流能成为一个连续的流,不断地流动和进行。依靠拉动的方式
管理 七大浪费学习心得
管理七大浪费的学习心得 通过学习管理七大浪费,使我意识到了管理上的等待、工作无序、协调不力、生产要素闲置、应付、低效、无理都是一种浪费。后续在工作当中,应从以下几方面开始着手以减少管理浪费: 一、减少工作中的等待浪费。 我们平时工作应主动、积极、有目标性的去开展,减少等待领导安排工作或是等待下级的工作汇报。(如:通过会议宣导明确自己和下级的阶段性目标,形成规范,建立整体工作协同网络,提高主观能动性,高效完成各项工作。) 二、减少管理无序。 首先职责要划分清楚,并再依据职责进行流程梳理、整合,最后推动流程的执行,提高效率。(如:了解、熟悉SMT小组内部各岗位工作内容及各流程操作规范,再整合小组各岗位的衔接要点,去粗取精,梳理有效流程,对岗位和执行瓶颈进行协调对应,以提高小组整体的管理效率。) 三、协调不力企业丧失凝聚力。 协调能力作为管理人员,着重在于如果通过协调统筹等方面可以使上级领导的指示得到很好的传达和执行。(如:SMT小组各岗位和
各执行环节均需要良好的协调能力,这对每个小组成员都应形成常态要求,若协调不力将造成各种资源浪费,甚至导致严重的工作失效。作为技术小组,对生产的宣导是非常重要的工作环节,统筹各资源的协同运转才能避免技术性错误。) 四、减少生产要素闲置。 应避免使用人海战术,使人员职能重叠或是重复,减少固定资产的闲置,利用已有的资源,提高工作效率,提高固定资料的利用率。(如:作为技术小组,人员的技术要求高,解决问题的能力要强,各小组人员对自身技术岗位要求要过硬以随时处理相对应的异常问题,协调各部门有效资源并协同完成技术难题。) 五、减少应付。 把自己塑造成一个高效的人,做任何事情都需严格要求自己,目标明确。(如:作为技术小组组长,自身技术必须过硬,要求要更高一筹,从技术和管理上严格要求自己,以身作则,要具有工作的前瞻性,切身完成各项工作任务。) 六、避免自己成为一个低效的人。 应跳出自己固有的思想圈,勇于吸收新鲜事物,提升自己的能力,减少错误的工作,把工作一次性做成做好。(如:高效要求自己是作为小组负责人的首要要求,低效工作不仅造成资源浪费最终会带动小
消除工作中的“七种浪费”
消除工作中的“七种浪费” 在我们生产现场,我们常常会看见等待的浪费、搬运的浪费、丌良品的浪费、劢作浪费、库存浪费等,而在我们的管理工作中同样也会由于各种各样的因素造成工作效率无法提高。下面,小菲和您一同来分析我们管理工作中的七种浪费,参照我们自己的管理过程,思考我们的管理是否也出现了“七大浪费“。 【分享文章】 1.管理工作丌能“等” 在管理工作中,等待的浪费主要表现在以下几方面: 等待上级的指示,上级丌安排工作下级就坐等,上级丌指示下级就丌执行,上级丌询问下级就丌汇报,上级丌检查下级就拖着办。多干亊情多吃亏,出了问题怎么办?吩从指示没有错,再大责任可分担。很多工作是在多次检查和催办下才完成的,造成极大的浪费。 等待下级的汇报,任务虽已布置,但是没有检查、监督。丌主劢深入调查情况,掌握第一手资料,只是被劢地吩下级汇报,丌做核实就做决定戒者向上级汇报,出了问题,责任还可以往下级身上推。 等待对方的回复,我已不对方联系过,什么时候得到回复我无法决定,延误工作的责任应该由对方负责,我只能等。追究责任也丌怕,我某月某日把这份文件送给对方,这里让录得很清楚,对方丌回复我能怎么办?你还是和对方联系一下吧,以免耽误工作。 等待生产现场的联系,职能部门丌主劢去为现场提供服务,而是坐等现场的联系,有时还很丌耐烦,讣为多等一会有什么了丌起,却没有设身处地去为现场着想,严重地影响了生产现场问题的及时解决。 这些“等待”在工作中是大量存在的,主要是中层管理人员缺乏责任心和主劢精神,丌愿意承担责任。对于这种浪费,我们讣为,根据丌同企业的文化氛围,如果丌能用Y理论激劥员工去消除等待的浪费,就需要用X理论去加强管理,例如对于较重要的工作,可以用5W1H来迚行计划分解,然后迚行控制、检查和考核。实际上,X和Y理论都丌能从根本上解决问题,X+Y 相辅相成也许更好一些。 2.把无序变有序 “没有规矩,丌成方圆”,这句古语说明了秩序的重要性。缺乏明确的觃章、制度、流程,工作中容易产生混乱,这是众所周知的。但如果有令丌行、有章丌循,按个人意愿行亊造成的无序浪费,更是非常糟糕的亊。 职责丌清造成的无序,由于制度、管理等方面的原因,造成某项工作好像两个部门都管,却纠缠丌休,整天扯皮,使原来的有序反而发成无序,造成极大浪费。 工作流程复杂造成的无序,一个有效的管理者应该是一个觃范化的高手,能把复杂无序的工作标准化、觃范化、简单化,从而使普通员工可以完成原本无法完成的工作。有章丌循造成的无序,随心所欲,把公司的觃章制度当成他人的守则,没有自律,丌以身作则,丌按制度迚行管理考核,造成无章无序的管理,影响员工的积极性和创造性,影响部门的整体工作效率和质量。这种人为造成的无序危害更大。这些无序出现的频次多了,就会造成企业的管理混乱。管理者应该分析造成无序的原因,劤力抓住主要矛盾,思考在这种的无序状态中,如何通过有效的方法,使无序发为相对有序,从而整吅资源,収挥出最大的效率。这是中高层管理者应该注意和重点考虑的问题乊一。 3.协调丌力企业丧失凝聚力 所谓协调,就是指组细中的一切要素、工作戒活劢要和谐地配吅,以便于组细的整体目标能够顺利实现。有了良好的协调,就会出现1+1>2 的协同效应。因此法约尔把协调规为管理的一项基本职能。而如果在管理工作中协调丌力,就会造成工作停滞等方面的浪费。工作进程的协调丌力,由两个部门共同承担的工作出现问题,双方都丌主劢联系,还需要第
管理工作中的七大浪费
管理工作中的“七种浪费” 丰田生产方式中所归纳的"七种"浪费,主要发生在生产现场,但是产生这些浪费的深层次的原因是什么?如果仅仅关注现场存在的问题,而不解决被现象所掩盖的本质问题,无疑是舍本逐末,即使表面上轰轰烈烈,但实际效果也很有限。为了能使经营管理革新活动深入有效地开展下去,我们首次提出管理工作中的七种浪费这个概念,来引导大家共同参与这项工作。 七种浪费之一:等待的浪费 管理工作中的等待浪费主要有以下几种情况: 等待上级的指示。上级不安排工作就坐等,上级不指示就不执行,上级不询问就不汇报,上级不检查就拖着办。算盘珠子不拨不动,缺乏主动精神。你多干事多吃亏,出了问题怎么办?听从指示没有错,再大责任可分担。很多工作的完成,是在几次检查、催办下完成的,造成极大的浪费。 等待外部的回复。我已与你联系过了,静待回音,什么时候回复不是我能决定的,延误工作的责任应该由对方负责,我只能等。等待其它部门或其他人的联系。你不找我去协助,我就可以躲避,总有原因可以找,就说情况不清楚。对其它相关工作不关心,没兴趣,多一事不如少一事,等就等吧,没啥了不起。 等待下级的汇报。任务虽已布置,但是没有检查,没有监督。不主动去深入实际调查研究,掌握第一手资料,只是被动地听下级的汇报,没有核实,然后作决定或向上级汇报,瞒天过海没有可信度,出了问题,责任往下级身上一推。 等待生产现场的联系。较严重的等待是生产现场对于技术、品质、资材等部门服务、指导、指示、供应的等待,"三现主义"的缺乏是等待中的最致命原因之一,严重影响生产现场工作的及时解决。 上述情况,在工作中是大量存在的,这种缺乏工作责任心、主动性和工作积极性,满足现状、消极怠工的情况引发的浪费所造成的危害更大,危害企业的正常运行。
七大浪费案例
七大浪费案例 【篇一:七大浪费案例】 序言在精益生产中,我们把“客户愿意为之付钱的活动”,称之为有 价值的活动,反过来就是浪费,这样看来,在我们的工厂,举目望 去遍地都是浪费,这些浪费注定了我们的成本居高不下。精益生产 实际上就是一个持续消除浪费的过程,七大浪费就是一个很好的现 场改善工具,通过消除浪费帮助企业提高效率。 那么,什么是浪费?我们如何去识别浪费?我们又如何来消除浪费?智尊精益在多年的客户服务中积累了不少在企业中推动精益生产消 除浪费的经验,相信对企业管理者和同行们能有所帮助。 我们知道,工厂是根据客户的需求来生产产品的,因此我们定义“任 何不能给客户带来价值的活动都是浪费”,生产线上堆积如山的物料 和在制品,流水线上的作业员离线寻找物料,不合格产品,产品返 工等都是常见的浪费现象。 我们把企业中最典型的浪费归纳为七大浪费,用几个英文字母来总 结就是 timwoods: inventory---库存的浪费m---motion--- 动作的 浪费 w---waiting---等待的浪费 o---over production---过量生产的浪费 o---over process---重复处理的浪费 d---dfects---不良品的浪费transportation 搬运的浪费指流程中因两点间距离远而造成的搬运、走动等浪费包括人的浪费和机器的浪费。搬运本身是一种无附加价 值的动作,若分解开来又分为:放置,堆积,移动,整列等动作浪费。 我们在企业中经常看到这样的搬运动作:从机械化车间到操作工位 以上搬运需要我们用人或者机器来完成,它们带给企业怎样的浪费呢?显而易见,拿起、放下会造成取放过程中时间的浪费,在反复 搬运中会造成我们等待和在制品库存的浪费,堆积物料和在制品会 造成我们面积和空间的浪费 transportation 要消除搬运的浪费,我 们必须知道是什么原因导致搬运的发生:设计的兼容性:业务扩充 新增工序或设备,设备或物料变换不适合,前景不明未作整体规划。针对造成浪费的原因,我们可以采取相应的改善措施:合理化布局。a辅助生产线的终点应尽量接近供给对象的主生产线工序; b充分探讨供应各工序零部件的方法;c研究空卡板包装箱夹具的返回方法;d沿生产线设置大小适当的零部件暂放场所; e不要忘记在生产线中设置检查工序和修理工序; f确保设备的保养与修理所需空间; g
solidworks型材库说明
图片: 图片:
图片:
图片:
图片:
图片: 焊接型材汇总,使用程序自动生成需要的型材。文件版本2006以上按照需要的尺寸安装所需,无需占用大量空间,随用随装! 再次升级为5.0.5版本 增加SW菜单,方便调用 新版本链接: https://www.360docs.net/doc/cd10366707.html,/topic_1190897.html [ 此帖被zhmh_1982在2011-02-12 12:48重新编辑]
顶端Posted: 2010-08-18 15:13 | [楼主] 孤雁82 级别: 工程师 精华: 0 发帖: 640 威望: 6 点 金钱: 16 机械币 贡献值: 0 点 注册时间:2008-03- 20 最后登录:2011-05- 30 小中大引用推荐编辑全看复制 太好了!怎么以前没发现这个好东东,多谢楼主~~~~~~~~~ 2010 sp4.0 安装应用成功 ==================================================== ==================================================== = [ 此帖被孤雁82在2010-10-21 11:19重新编辑] 顶端Posted: 2010-10-21 08:57 | 1 楼孤雁82 级别: 工程 师 精华: 0 发帖: 640 威望: 6 点 金钱: 16 机械币 贡献值: 0 点 小中大引用推荐编辑全看复制 发现好多朋友都在问怎么使用,所以不才替楼主做了个使用说明,水平有限,供大家参考,请勿拍砖。 并再次感谢楼主分享 =========================华丽丽的分割线=================== ========================= 下载后解压缩并安装该工具,一键操作自动安装,SW2006以上均可使用, 经本人测试2010SP4.0使用正常。 以下是安装使用教程: 1、安装该程序 2、启动SW程序,打开——C:\Program Files\Weldment Profiles for Sol dWorks\Weldment Profiles.dll,(注:该路径为默认路径)在 SW菜单栏会自动出现一个焊接件菜单,如下图所示
工厂生产中的七大浪费
工厂生产中的七大浪费 精益生产的目的是彻底消除浪费,不断追求制造过程的合理性。从精益生产的起源中可以明显看出,精益生产是建立在基于大量制造中的浪费被有效地进行消除的前提下建立的。 浪费提高了制造过程中的成本,吞噬了企业的利润。想要有效的消除浪费的第一步,首先要能够发现浪费。如果每个人都能够很容易的发现问题,那么我们距解决问题仅剩一步之遥。 1.制造过剩的浪费 过量生产是大量制造方式用于对应不确定性的方法,由于各工序制造能力不同,而大量制造中设备又被要求不可以停止,因此,前工序的制造速度比后工序快,制造的速度比销售速度快,因此常常伴随着大量的库存发生。 在大量制造的系统中,在一个不确定的世界里,由于各种波动不断产生,过量生产可以缓冲或避免生产领域受到需求波动全面影响,不至于造成整个系统的混乱。 传统方法通过对库存的投入来补偿这种矛盾而不是去提高响应实际问题的能力。 整个制造过程中库存材料的成本异常巨大,尽管它难以量化。 2.等待的浪费 等待时间或排队时间是大批量生产产生的另一个问题。 加工批量太大是造成等待的原因之一。允许大批量生产和建立起排队供应的系统是对原始顺序中可能会出现的干扰担心。 频繁交换品种可以减小批量,但通常人们认为频繁的交换品种会造成模具交换时间过长,而这样会形成巨大的浪费,所以可以通过加大批量降低制造成本。 这和人们的思维方式有关而不是和技术系统有关。 3.搬运的浪费 运输作为消除地域误差的手段似乎在系统上创造着价值,但站在客户的角度上看,运输并没有给我们带来什么。 消费者关心的这会产生什么样的反应和会带来什么样的品质问题,而不是运输本身。 通过材料、搬运设备、间接劳力、和命令与控制系统来知道何时何地移动何物和怎样预防丢失和损坏,这些确实都需要成本。
精益生产中的七大浪费
精益生产中的七大浪费 一、库存浪费 ◆精益生产认为:“库存是万恶之源”,所有改善行动会直接或间接地和消除库存。 ①产生不必要的搬运、堆积、放置、防护处理、寻找等浪费 ②使先进先出的作业困难 ③损失利息及管理费用 ④物品的价值会减低,变成呆滞品 ⑤占用厂房空间、造成多余工场、仓库建设等 ⑥设备能力及人员需求的误判 ◆因库存造成无形损失,绝不亚于上述有形损失,精益生产者认为库存会隐藏问题,而“问题”在精益生产者被认为是宝藏,问题如果能不断地被发现解决,则利益便会不断地产生 1、没有管理的紧张感,阻碍改进: 2、库存量一多,因机械故障、不良产品所带来的不利后果不能马上显现出来,因而也不会产生对策。 3、由于有了充足的库存,出现问题时可以用库存先顶上,问题就可以慢慢解决甚至不用解决,最起码是被掩盖住了,不急迫了,不会被上级追究了,于是本部门的工作成绩就出来了。
二、过渡生产(制造过多或过早浪费) ◆TPS强调的是“适时生产”。 ◆多做能提高效率,提早做好能减少产能损失(不做白不做,机器还不是一样停着?) 1、提早用掉了材料费、人工费而已,并不能得到什么好处。 2、把“等待浪费”隐藏,使管理人员漠视等待的发生和存在。 3、积压在制品,使生产周期L/T变长无形的),而且会使现场工作空间变大,不知不觉中吞蚀我们的利润。 4、产生搬运、堆积浪费,先进先出变得困难。 三、品质缺陷(不良品浪费) ◆任何的不良品产生,皆造成材料、机器、人工等的浪费。 ◆及早发现不良品,容易确定不良来源,进而减少不良品的产生。 ◆关键是第一次要把事情做对,??“零缺陷” 四、运输(搬运浪费) ◆大部分人皆认同搬运是一种无效的动作,也有人认为搬运是必须的。 ◆用“输送带”的方式来克服,行吗? 1、取放浪费; 2、等待浪费;
SolidWorks高级培训手册(全套教程)
SolidWorks 高级培训手册目录基础知识第一课介绍基础知识第二课薄壁零件基础知识高级零件建模第一课复杂外形建模第一部分高级零件第二课复杂外形建模第二部分高级零件第三课曲面建模高级零件钣金钣金钣金高级装配建模第一课自顶向下的装配体建模高级装配第二课在装配环境下工作高级装配第三课装配体编辑高级装配第四课型芯和型腔高级装配工程图工程图工程图 1、培训手册: SolidWorks 基础知识第一课介绍SolidWorks 高级培训手册 2、基础知识 SolidWorks 高级培训手册基础知识第一课介绍在成功地学完这一课后,你将能够:描述一个基于特征的,参数化实体建模系统的主要特色区分草图特征和直接生成特征认识SolidWorks 用户界面的主要内容解释如何用不同的尺寸标注方法来表达不同的设计意图 3、基础知识第一课介绍SolidWorks 高级培训手册 4?基础知识 SolidWorks 高级培训手册基础知识第一课关于本课程本课程的目的是教授你如何使用SolidWorks 自动机械设计软件来创建零件和装配体的参数化模型,以及如何绘制这些零件和装配体的工程图。 SolidWorks 是一个强劲且功能丰富的应用软件,以致于本课程不可能覆盖此软件的每一个细节和方面。因此,本课程重点教授你成功应用 SolidWorks 所需的基本技能和概念。你应该把本培训手册当作系统文档和在线帮助的补充而不是替代品。一旦你对SolidWorks 的基本使用技能有了较好的基础,你就能参考在线帮助来得到关于不常用的命令选项的信息。 前提条件我们希望参加本课程学习的学生具有如下经验: 机械设计经验 使用WindowsTM 操作系统的经验 完成学习使用SolidWorks 软件自带的SolidWorks 教程手册课程设计原则本课程是按照基于培训目的的设计过程或任务的方法设计的,而不是集中于单独的特征和功能,这种基于任务的培训课程强调完成一项特定的任务所需遵循的过程和步骤。通过对应用实例的学习来演示这些步骤,你将会学到为完成一项设计任务所需的命令、选项和菜单。本书的使用方法我们希望能在有SolidWorks 使用经验的教员指导下,在教室中学习本培训手册。这不是一本自学指南。我们设计的例子是想让教员“生动地”演示给你,学生在自己的计算机前跟着学习。练习题使用练习题来应用和练习课程讲解/演示部分所学的内容。我们设计的练习题代表了典型的设计和建模情况,可以在课堂上完成。你应该注意到学生的学习速度是不同的,所以,我们设计的练习题比你希望能在课堂上完成的要多。这就使得即使学习最快的学生也不会没有练习可做。 在练习题中的图形及尺寸并不有意按照任何特定制图标准。实际上,有些尺寸的格式可能不会被企业接受。这样做的原因是这些练习题是用来鼓励你在建模时应用课程中学到的东西及使用并加强一定的技术。总之,练习题中的图形及尺寸是为这个目标服务的。 关于尺寸的一点说明基础知识?5 第一课介绍SolidWorks 高级培训手册关于本CD 本书的最后一页封装了一张CD ,它包括了本课程中用到的零件、装配体及工程图,其中有两个文件夹:教员文件夹和学生文件夹,教员文件夹包括了教员讲课时用到的文件,学生文件夹包括了学生做练习题时要用的文件。 Windows?2000 本教程所用的屏幕图片是SolidWorks 2001 在Windows?2000 中使用时制作的。如果你在不同版本的Windows 中运行SolidWorks ,菜单和窗口的外观可能有所不同,但这些不同并不影响软件的使用。
生产管理中的“七大浪费”定义与说明
生产管理中的“七大浪费”定义与说明 生产管理中的“七大浪费”,懂精益生产的人都知道,就是不良品,超量生产,库存,搬运,多余的工序,不必要的调动,等待。 一、库存浪费 ◆精益生产认为:“库存是万恶之源”,所有改善行动皆会与直接或间接地和消除库存有关①产生不必要的搬运、堆积、放置、防护处理、找寻等浪费②使先进先出的作业困难③损失利息及管理费用④物品的价值会减低,变成呆滞品⑤占用厂房空间、造成多余工场、仓库建设等⑥设备能力及人员需求的误判 ◆因库存造成无形损失,绝不亚于上述有形损失,精益生产者认为库存会隐藏问题,而“问题”在精益生产者被认为是宝藏,问题如果能不断地被发现解决,则利益便会不断地产生1、没有管理的紧张感,阻碍改进2、库存量一多,因机械故障、不良产品所带来的不利后果不能马上显现出来,因而也不会产生对策3、由于有了充足的库存,出现问题时可以用库存先顶上,问题就可以慢慢解决甚至不用解决,最起码是被掩盖住了,不急迫了,不会被上级追究了,于是乎本部门的工作成绩就出来了 二、过渡生产(制造过多或过早浪费) ◆TPS强调的是“适时生产” ◆多做能提高效率,提早做好能减少产能损失(不做白不做,机器还不是一样停着?)1、提早用掉了材料费、人工费而已,并不能得到什么好处2、把“等待浪费”隐藏,使管理人员漠视等待的发生和存在3、积压在制品,使生产周期L/T变长(无形的),而且会使现场工作空间变大,不知不觉吞蚀我们的利润4、产生搬运、堆积浪费,先进先出变得困难 三、品质缺陷(不良品浪费) ◆任何的不良品产生,皆会造成材料、机器、人工等的浪费 ◆及早发现不良品,容易确定不良来源,进而减少不良品的产生 ◆关键是第一次要把事情做对,“零缺陷” 四、运输(搬运浪费) ◆大部分人皆认同搬运是一种无效的动作,也有人认为搬运是必须的 ◆用“输送带”的方式来克服,行吗?1、取放浪费;2、等待浪费;3、在制品过多浪费;4、空间浪费◆搬运浪费又包含放置、堆积、移动、整理等动作的浪费 五、处理(加工浪费)◆定义:指的是与工程进度及加工精度无关的不必要的加工◆有一些加工程序是可以省略、替代、重组或合并◆很多时候会习惯并认为现在的做法较好 六、动作浪费12种动作浪费:◆两手空闲◆单手空闲◆不连贯停顿◆幅度太大◆左右手交换◆步行多◆转身角度大◆移动中变换状态◆不明技巧◆伸背动作◆弯腰动作◆重复不必要动作 七、等待浪费◆生产线的品种切换◆工作量少时,便无所事事◆时常缺料,设备闲置◆上工序延误,下游无事可做◆设备发生故障◆生产线工序不平衡◆有劳逸不均的现象◆制造通知或设计图未送达
精益生产之“七大浪费”简介及对策
精益生产之“七大浪费”简介及对策 ▲如何判断浪费 浪费的定义 - 花了时间、资源、空间,但未能让客户享有产品与服务上任何附加价值的人、事、物。 - 附加价值的工作:会让客户付钱购买的工作。 - 附带的工作:对产品附加要做的动作但无附加价值(例如:检验…) - 浪费:未创造任何附加价值的服务。 精益生产(Lean Manufacturing)之七大浪费简介 100810 生产制造管理中的成本控制,是生产管理的重要内容,在“生产成本五三模型”中,三种不可见成本中的关键内容就是七大浪费,这七大浪费首先是由丰田公司提出来,并且在制造管理中得以应用和改善的,现在作一详细介绍,希望能够对大家的生产管理有所帮助:一、库存浪费 ◆精益生产认为:“库存是万恶之源” ,所有改善行动皆会直接或间接地和消除库存有关。 ①产生不必要的搬运、堆积、放置、防护处理、找寻等浪费②使先进先出的作业困难 ③损失利息及管理费用④物品的价值会减低,变成呆滞品 ⑤占用厂房空间、造成多余工场、仓库建设等⑥设备能力及人员需求的误判 ◆因库存造成无形损失,绝不亚上述有形损失,精益生产者认为库存会隐藏问题,而“问题”在精益生产者被认为是宝藏,问题如果能不断地被发现解决,则利益便会不断地产生 1、没有管理的紧张感,阻碍改进: 2、库存量一多,因机械故障、不良产品所带来的不利后果不能马上显现出来,因而也不会产生对策。 3、由于有了充足的库存,出现问题时可以用库存先顶上,问题就可以慢慢解决甚至不用解决,最起码是被掩盖住了,不急迫了,不会被上级追究了,于是乎本部门的工作成绩就出来了。 二、过渡生产(制造过多或过早浪费) ◆TPS强调的是“适时生产”。 ◆多做能提高效率,提早做好能减少产能损失(不做白不做,机器还不是一样停着?) 1、提早用掉了材料费、人工费而已,并不能得到什么好处。 2、把“等待浪费”隐藏,使管理人员漠视等待的发生和存在。 3、积压在制品,使生产周期L/T变长无形的),而且会使现场工作空间变大,不知不觉中吞蚀我们的利润。 4、产生搬运、堆积浪费,先进先出变得困难。 三、品质缺陷(不良品浪费) ◆任何的不良品产生,皆造成材料、机器、人工等的浪费。