2018届高三英语——图表作文模板与范文
表示今昔对比类写作套语 (1)Quite a few changes have taken place in my school since you left China. Over the past twenty years or so, great changes have taken place in our life. (2)Things have begun to improve since schools were called on to reduce
learning load.
高三英语书面表达之高三英语书面表达之图表图表/图文作文
图表式作文是说明文的一种图表式作文是说明文的一种。。一般可分
三个层次来写三个层次来写::
?第一按照题目要求描述图表反映的总
情况情况,,即概括大意。
?第二对数字进行仔细的比较,抓住特点进行分析进行分析、、归纳并找出产生变化的
原因。
?第三可写读图表后的想法和评论,从而得出自己的结论。图表作文三个层次要求
1. 开头常用句型开头常用句型::自从……以来以来,,事情有了好转/改善改善。。
2. 对比常用句型:
(1)…used to…, but now…
过去常……,但是现在……
(2) …in the past, but now…
在过去……,但是现在……
(3) once…, but now…
曾经…….,但是现在……
(4) Things are different now.
情况已大不同了
(5) But now, everything has changed.
但是现在全变了
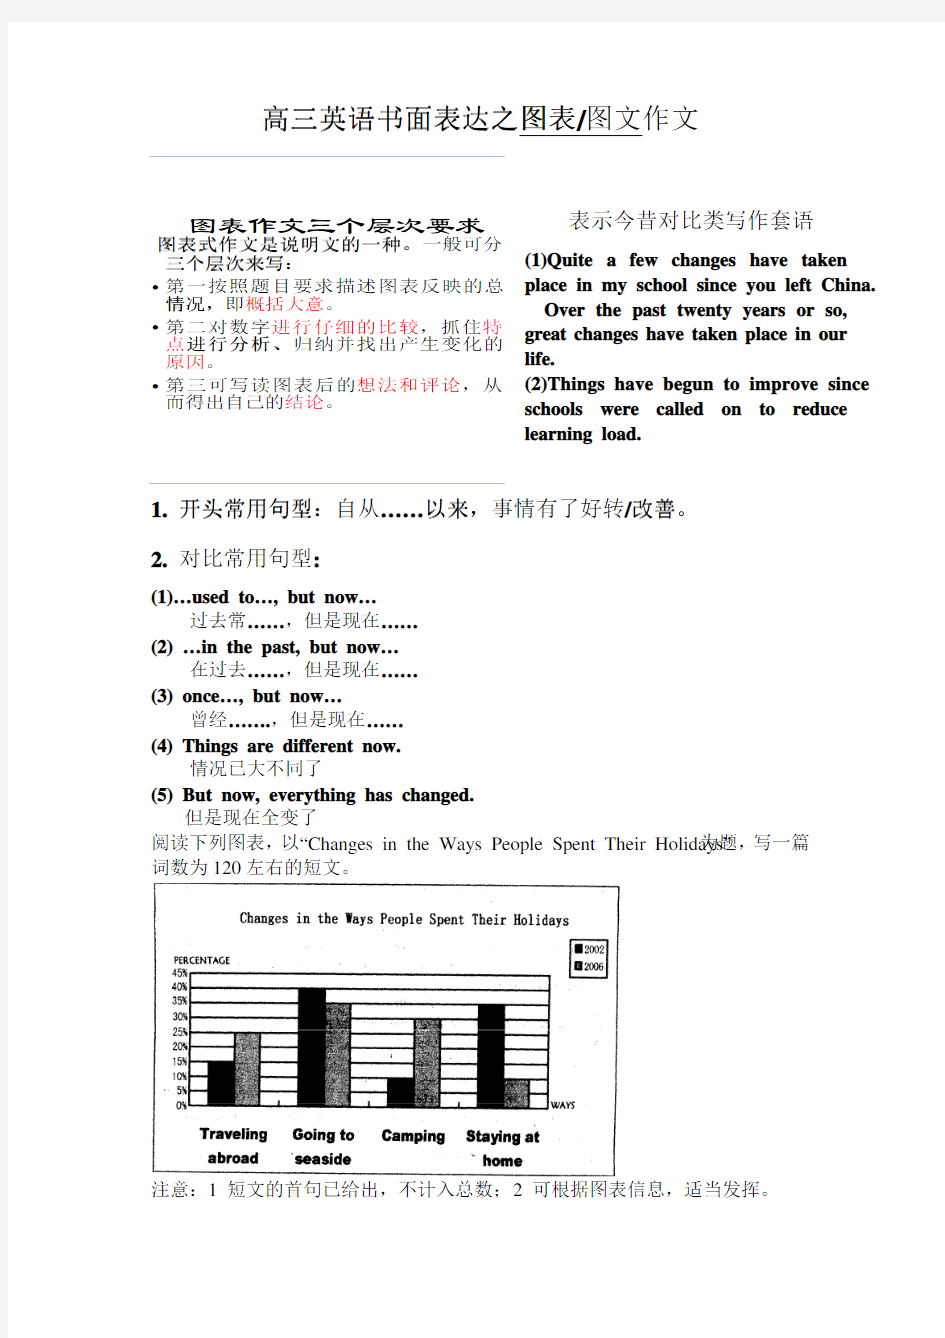
阅读下列图表,以“Changes in the Ways People Spent Their Holidays”为题,写一篇
词数为120左右的短文。
注意:1 短文的首句已给出,不计入总数;2 可根据图表信息,适当发挥。
Changes in the Ways People Spent Their Holidays
The ways people spent their holidays have changed greatly recently.
In 2002, 35% of people spent their holidays at home. The number dropped greatly to 10% in 2006. It seems tha t people have more time and more money to enjoy the outside world than before.
The graph shows that the number of people spending their holiday traveling abroad https://www.360docs.net/doc/c512679360.html,pared with 15% in 2002, t he rate in 2006 rose to 25 % . Because people now have much more money than before, they can afford to travel abroad , and the rate may continue to rise in the near future.
From the graph we can also see that the number of people going to the seaside remained nearly the same, while the number of people who go camping rose from 10 % in 2002 to 30 % in 2006. The reason may be that people become tired of the city life and want to be close to nature.
表示数据说明类写作套语
文章结构:
Part 1: General idea (conclusion/ tendency )
Part 2 Facts: (to support the idea)
Part 3 Reasons
Part 4 Solutions or personal opinion/suggestions (if needed)
开头常用套语:
The graph (chat , picture ,table )above shows that …
As is shown by the graph / in the chart, …
From the graph / chart above, we can see …
From the figures given in the table, it can be seen / noticed that…
数据说明常用套语:
The number of … nearly doubled
The number was 5 times as much as that of..
It rose from …
It decreased twice than that of 1906.
The total number was lowered by 10%.
Compared with 1997, it fell from 15 to 10%.
The number of … amount to/add up to/sum up to/reach … (数量总计) …increase (rise / fall / drop) from …to )
Compared with … …make up about …
原因说明常用套语:
There are several reasons for it.
A number of factors lead to it.
The change in.... largely results from the fact that...
Firstly/ First of all/ To begin with, .... Secondly, .... Besides/ In addition/ Furthermore/ Moreover,... Finally/ Last but not least/, ....
This is because …. That is why ….
The reason for …. is that….
结尾常用套语:
We can draw the conclusion that…
In my opinion/Personally, …
As far as I’m concerned, …
In short/ in brief/ in a word, …
It seems clear that …
It’s clear from the chart that…
We can know/learn that…
The results seem to suggest that…
1.最近,你校参加了某英文报纸正在开展的题为“中学生课堂注意力”的专栏讨论,并请你代表学校给该英文报纸投稿。下面的图表为你校的调查结果(图中数据为学生人数百分比)。请你根据所提供的信息做简要说明,并根据提示给出改善的建议。
改善注意力的建议:
教室通风、明亮
课堂积极参与课堂活动
课间适量活动或适当休息
Our school has made a survey about how long middle school students can fix their attention in class during each period. The result shows that only 40% of the students can draw their attention to the class, while the rest of them can not concentrate on the lesson.30% of the students think the problem is caused by all kinds of noises in the classroom; the other part of students consider the lack of sleep and tiredness as t he major causes.
Therefore, we advise that the classroom be bright and the air inside stay fresh. As for students,they should try their best to be active in class in order not to be disturbed by others. During the breaks, they can take some exercise or have a little rest in the classroom.
2. 高中学习任务繁重,因此同学们对于参加学校活动有着不同的看法,请“Taking Part in School Activities”为题,根据下表提示,并结合自己的见闻,用英语写一篇150词左右的短文(开头已写好,不计入总词数)。
现象与看法观点与理由
70%的同学对参加学校活动很感兴趣1.从课本上学习并不是唯一的任务,应该抓住每个
机会来获得实践知识
2.长时间学习之后,筋疲力尽,可以通过参加学校
活动来放松自己
3.…..
30%的同学不愿参加学校活动1.应该充分利用时间来学习
2.学校活动与他们未来的发展没关系
3.…..
我的看法…..(两点)
Taking Part in School Activities
The study burden tends to be heavier and heavier for high school students. So they hold different views about whether they should take part in school activities.
Seventy percent of the students are very interested in school activities\take a positive attitude towards school activities. The reasons are as follows. First of all, they think that \ hold the view that learning from textbooks is not their only task and that
they should take every chance to get some practical knowledge. Besides, they often feel worn out after long hours of study, so they can relax themselves by joining in school activities. What’s more,school activities can broaden their horizons, which is beneficial to their future development.
However, thirty percent of the students hold the different view. They look on taking part in school activities as a waste of time, which should be made full use of to improve their study. Also,school activities have little to do with their future development and careers. In addition, they feel they still have many opportunities after they become college students.
As far as I’m concerned, I prefer taking part in school activities. On one hand, we can learn a great deal from others in activities, such as getting along well with others. On the other hand, in order to make young people the owner of the society, we firmly believe that\ we are convinced that learning from textbooks is not enough.
:
?图表作文典型句式
图表作文典型句式:
?As the chart above shows,
?We can see from the graph that…
?From the table we can find out that…
?As can be seen from the chart …
?As is shown in the chart, the production for all products is
higher/ lower/ rising/ falling…
?As is described in the chart…
1. 请阅读下面文字及图表,并按照要求用英语写一篇150词左右的文章。
Since 2014, the goal of building a “nation of read ers” has been
includ ed in the annual Report on the Work of the Government. Just
ahead of World Book Day, the Chinese Acad emy of Press and
Publication has issued its findings in a survey of Chinese reading
habits. Chinese people read on average about eight books in the year
2015, a slight increase compared with that in the previous years.
However, thing
【写作内容】
1. 用约30个字单词概述上述文字及图表的主要内容。
2. 结合上述信息,简要分析可能导致青少年图书阅读量下降的原因。
3. 结合自身实际,就如何提高青少年的图书阅读量提几点建议(不少于两点)。
【写作要求】
1. 写作过程中不能直接引用原文语句。
2. 作文中不能出现真实姓名和学校名称。
3. 不必写标准。
【评分标准】内容完整,语言规范,语篇连贯,词数适当。
Despite the fact that the Chinese generally read more books compared with the previous years, the past year witnessed a significant decline in the number of books read by those under age 17, especially the middle school students.
Quite a few things give rise to the probl em.Due to the fierce competition, the load of study for mid dle school students gets heavier and heavier as their grade advances, leaving little time for reading. What's worse, electronic devices and various forms of entertainment have taken what little there is of their spare time.
To deal with the probl em, we ourselves should know the significance of reading for our growth and develop a good reading habit. For me, I will try to take part in various reading activities to enhance my enthusiasm in reading. Moreover, I will make plans for reading on the monthly basis. Only in this way can I read and enjoy more books.
2. 下图表为近几年中美两国电子商务发展比较及其将来几年的发展趋势。请根据图表信息,以“E-commerce, an ever-increasing trend in China”为题,为某英语报写一篇稿子,内容包括:
1、图表主要信息(用30个左右英语单词描述);
2、中国电子商务增长的原因(经济稳步增长,人民收入提高,人口大于美国,网上购物方便);
3、你的观点(可从保护和规范电子商务市场谈起)。
注意:
1、词数150左右,开头已经给出,但不计入词数;
2、作文中不得提及你所在的学校及本人姓名。
3、参考词汇:cybercrime网络犯罪;phishing网络钓鱼
E-Commerce Sales and Growth 2008-2016)
(China vs the USA)
E-commerce, an ever-increasing trend in China
As is apparently shown in the bar chart above, the e-commerce sales in China are growing rapidly, at a much higher speed than the USA. China’s e-commerce sales started with only 20 billion USD in 2008, and were about 60% of the US’s in 2011. However, it surpassed the US in 2013. It is expected to double that of the USA in the near future.
There are several factors contributing to the rapid growth in e-commerce in China.First and foremost, even though the world has experienced a serious economic decline, China has enjoyed a steady growth throughout, leading to people’s income increasing continuously. In addition, China has a much larger population than the US, possessing the largest number of netizens in the world. Last but not least, people find it more convenient to shop online, and are more willing to purchase online than ever before.
Just as an old saying goes, every coin has two sides, and E-commerce is no exception. For instance, cybercrime occurs frequently. What we should do is (to)regulate the e-shopping market and improve the quality of e-service, on top of which, we are supposed to join forces to fight against the cybercrime, such as phishing, cheating and so on so as to enjoy a healthier and more prosperous e-commerce market in China.
英语四级看图英语作文万能模板
1.看图英语作文万能模板 第一段:描述图画 1、As is vividly shown in the picture( 如果两个的话用pictures,也可以用drawing,同样的如果两个的话用drawings,如果是图表则用table,两个图表则用tables) above, 图画的内容。The picture( 如果两个的话用pictures,也可以用drawing,同样的如果两个的话用drawings,如果是图表则用table,两个图表则用tables) tells ( 注意,如果是前面的图画是复数,则用 tell) us that 这个图片的大致反映的意思。 2、Recent years people in 地名(比如中国、北京、美国等等)have witnessed the fact that 描述 图片里的现象,And it is very common/usual to see that in recent years. 第二段:解释,说明和分析图片 1、The implied meaning of the picture(注意,同上进行单复数的处理) should be taken into account seriously. First/To begin with, 揭示涵义/原因/结果1,Second/What’s more, 揭示涵义/原因/结果2。Last but not least/Finally, 揭示涵义/愿意/结果3(如果有的话)。And the social problem(如果是现象的话可以用phenomenon) has arisen the great concern/care of our whole society/world/all the people. 2、There may/might be three(也可以是两个) factors which contribute to/are responsible for/explain/can make clear the 图片解释的现象。First of all, 原因1。And then the second reason is that 原因2。The last reason,I think, is that原因3。 第三段:给出自己的看法和想法以及解决问题的办法。 1、In my view/point of view (或者说as for me),We should take some measures as follows to deal with the problems followed in the picture. First, we should 具体的措施1.And then we have to /must具体的措施2.Only in these ways,can we solve the problem of 具体的问题。 2、It is true that these unique/social points can/could together remind us that we should take some measures to solve it.采取的措施1和2. Only in this way can we实现的目标! 开始段:介绍现象的具体状况和普遍程度。 中间段:解释产生这种现象的原因或意义,并做出一定分析。 结尾段:提出建议或总结观点或表明态度。
大学英语四级考试图表作文
大学英语四级考试图表作文 1、图形种类及概述法: 饼图:pie chart 直方图或柱形图:bar chart / histogram 表格图:table 趋势曲线图:line chart / curve diagram 泛指一份数据图表:a data graph/chart/diagram/illustration/table 2、图表中的数据(Data )具体表达法 数据(Data )在某一个时间段固定不变:fixed in time 在一系列的时间段中转变:changes over time 3. 持续变化的data 在不同情况下: 增加:increase / raise / rise / go up 减少:shrink/decrease / drop / fall … 波动:fluctuate / undulate / wave 稳定:remain stable / stabilize / level off 4. 最常用的两种表达法: 动词+副词形式(Verb+Adverb form)形容词+名词形式(Adjective+Noun form ) 5. 图表常用动词:show 、describe 、illustrate 、can be seen from、clear 、apparent 、reveal 、represent 、demonstrate 6. 图表常用名词:figure 、statistic 、number 、percentage 、proportion 7、表示数据变化的单词或者词组 rapid/rapidly 迅速的,飞快的, dramatic/dramatically 戏剧
英语图表作文范例
图表作文写作指导 图表作文至少包含描述图表与解释原因两个部分,而当前的图表作文大多还有第三个段落。图表作文的规律性很强,不像图画式作文那样富于变化。 1.首段的写作 图表作文有表格(table)、柱形图(bar chart)、饼状图(pie chart)和折线图(diagram)之分,后三种都属于图表的范畴(chart)。不管是chart还是table,都需要进行描述,一般放在文章的第一部分,长度宜适中。描述数据我们要首先看看是几个变量(A),每个变量有几个数据(B),不妨以A*B表示。 如果只有一个变量,有三个数据,可以描述如下: From the chart we can see clearly that the average number of hours a student spends on Internet per week has increased from less than two hours in 1998 to nearly four hours in 2000, and then to 20 hours in 2004. 如果是最常见的是2*3的情形,可以描述如下: From the chart, we can see clearly that in a big city in China, state-owned houses declined from 75% in 1990 to 60% in 1995 and then to 20% in 2000, while private houses rose from 25% to 40% and then to 80% during the same period. 这里用了while引起从句来突显对比,是一种非常好的办法,如果用两句话来描述,也完全可以。 如果是1*n(n>3)的情形,将头与尾描述出来即可,比较好的方法就是在句中描述最后一个与第一个相比变化了多少。 碰到多变量、每个变量多数据的情形,大家应首先进行分类,分成上升、下降两类,或者上升、下降、不变三类,这样问题就迎刃而解了。 2.第二段的写作 第二段是解释原因的段落。我们谈谈两个问题。 首先是过渡句这个问题。这里不大可能放在第一段,因为第一段不可能像某些命题作文那样简洁(如只有一句)——例如提纲式作文中的批驳类文章中除第二段首句批驳之外还有首段末句批驳,效果很强烈。 其次就是此段的主题句(topic sentence)的问题。此句或主观或客观,并无拘束,只要上下文风格统一即可。 主观:We believe that three reasons can account for this phenomenon. I believe that three reasons can account for this phenomenon. In my mind, the reasons why the overseas students are on the rise are as follows. 主观之变体(使用插入语,突显主语):Three reasons, we believe, can account for this phenomenon. Three reasons, I believe, can account for this phenomenon. Three reasons, I firmly believe, can account for this phenomenon. 注意:插入语的使用属于看似平淡却极富功力的技巧,可以达到很好的效果。
2020年大学英语四级图表作文范文话题:可持续发展
2020年大学英语四级图表作文范文话题:可持续发展Directions: How can we meet the needs of today without diminishing the capacity of future generations to meet theirs? Sustainable development implies a broad view of human welfare, a long term perspective about social development. Write an essay which should cover: 1) describing the set of drawings below, 2) stating its main idea, and 3) giving your comment. 范文1: The images above are both meaningful and instructive: this man's hard work is not only for his own benefit, but also for the benefit of future generations. The pictures serve to remind us that the existence of our current happiness and valuable national heritage is due to the struggles of our predecessors. We, in turn, should also work hard in order to guarantee the comfort and safety of generations to come. Sustainable development has become a topic of heated debate in recent years. While it is justifiable to satisfy current demands, we cannot neglect the needs of our descendants in the process. Our children also depend on Earth's natural resources and we should not deprive them of such necessities.
英语写作万能模板
英语写作万能模板 一. 对比观点题型 (1)要求论述两个对立的观点并给出自己的看法。 1. 有一些人认为...... 2. 另一些人认为...... 3. 我的看法...... The topic of ①-----------------(主题)is becoming more and more popular recently. There are two sides of opinions about it. Some people say A is their favorite. They hold their view for the reason of ②-----------------(支持A的理由一)What is more,③-------------理由二). Moreover,④---------------(理由三). While others think that B is a better choice in the following three reasons. Firstly,-----------------(支持B的理由一). Secondly (besides),⑥------------------(理由二). Thirdly (finally),⑦------------------(理由三). From my point of view,I think ⑧----------------(我的观点). The reason is that ⑨--------------------(原因). As a matter of fact, there are some other reasons to explain my choice. For me, the former is surely a wise choice . (2)给出一个观点,要求考生反对这一观点 Some people believe that ①----------------(观点一). For example,they think ②-----------------(举例说明).And it will bring them ③---------------(为他们带来的好处). In my opinion, I never think this reason can be the point. For one thing,④-------------(我反对该看法的理由一). For another thing,⑤---------(反对的理由之二). Form all what I have said,I agree to the thought that ⑥-----(我对文章所讨论主题的看法).
英语四级写作万能:图表型作文精编版
英语四级写作万能:图表型作文精编版 MQS system office room 【MQS16H-TTMS2A-MQSS8Q8-MQSH16898】
英语四级写作万能模板:图表型作文 图表型作文 此类作文要求考生从提示性文字或图表、图画入手,解释提示性文字、图表、图画反映出的问题,提出问题的危害性或解决这一问题的紧迫性;然后对问题展开分析,提出解决问题的方案或应对措施;最后一段要求考生表明自己的态度、做法等。 a.影响分析型关键句式 The chart / graph/ table/ picture describes that the figure declines/ falls smoothly/ markedly. It indicates that…图表显示数字下降平缓,这表明…. There may be a combination of factors which contribute to / are responsible for …可能是好几个因素造成的结果。 There may be several possible reasons to this phenomenon, which will be demonstrated as follows. 可能有几个原因导致了我们下面所要阐述的现象。 The significant effects of this phenomenon are undeniable, which can be concluded as the following aspects.这一现象的重大影响是不可忽略的,可大致归结为以下几个方面 On one hand, …; On the other hand,…一方面,…;另一方面,… 现象阐释类作文框架 As is shown in the graph above, we can see clearly that great changes have taken place in … from…to… The first … years saw… The last … years witnessed … What are the reasons for the? On my standpoint, there are several as follows. First of all, (______). What is more, (______).Last but not the least,(______). The significant effects of this phenomenon are undeniable, which can be concluded as the following aspects. On one hand, …; On the other hand,… 76 words b.问题解决型关键句式 It is important that effective actions should be taken to prevent the situation. 采取有效措施防止这种情况的发生很重要。
英语作文模板图表作文
图表分析作文1 As is clearly shown in the table/ figure/ graph / chart, 图表总体描述between 年代and 年代. Especially, 突出的数据变化. There are three reasons for 具体表示急剧上升、下降或特殊现象的词. To begin with, 原因一. In addition / Moreover, 原因二. For example, 具体例证. Last but no least, 原因三. In short,总结上文. As far as I am concerned, / For my part, / As for me,作者自己的观点. On the one hand, 理由一. On the other hand, 理由二. In brief,总结上文. 图表分析作文2 The table / figure / graph / chart shows that 图表总述from 年代to年代. It is self-evident that 突出的数据变化. Three possible reasons contribute to 具体表示急剧上升、下降或特殊现象的词或代词代替上文内容. One reason is that原因一. Another reason is that原因二. For instance,举例证. What’s more原因三. As a result, 重述上文之趋势. However, in my opinion 作者观点. For one thing,理由一. For another, 理由二. To sum up,总结上文. 图表分析作文3 It can be seen from the table / figure / graph / chart that图表总述between年代and年代. Especially,突出的数据变化. Why are there such great changes during 图表涉及的年头数years? There are mainly two reasons explaining具体表示急剧上升、下降或特殊现象的词或代词代替上文内容. First,原因一. In the old days,比较法说明过去的情况. But now,说明现在的情况. Second,原因二. As a result,总结上文. In my viewpoint,作者自己的观点. On the one hand,论点一. On the other hand,论点二. 图表分析作文4 As the table / figure / graph / chart shows,图表总述in the past years年代. Obviously,突出的数据变化. Why are there such sharp contrasts during 图表涉及的年头years? Two main factors contribute to具体表示急剧上升、下降或特殊现象的词或代词代替上文内容. First of all,原因一. In the past,比较法说明过去的情况. But now 说明现在的情况. Moreover,原因二. Therefore,总结上文. As I see it,作者自己的观点. For one thing,论点一. For another,论点二. 图表作文补充句型 ?As is shown in the graph… 如图所示… ?The graph shows that… 图表显示… ?As can be seen from the table,… 从表格中可以看出… ?From the chart, we know that… 从这张表中,我们可知… ?All these data clearly prove the fact that… 所有这些数据明显证明这一事实,即… ?The increase of …. In the city has reached to 20%. ….在这个城市的增长已达到20%. ?In 1985, the number remained the same. 1985年,这个数字保持不变. ?There was a gradual decline in 1989. 1989年,出现了逐渐下降的情况.
2014年6月英语四级图表作文范文
2014年6月英语四级图表作文范文:文明风尚 Directions: Understanding is a drop of golden sun, is wellspring of life, and is a bridge between man and the soul of man. Understanding is tolerance, is a kind of se lf restraint. The world needs understanding. Write an essay which should cover: 1) describing the drawing below, 2) stating its main idea, and 3) giving your comment 范文1: The human being differs from the wild beast in that the latter is liable to have a hostile view of others and interact in an unreasonable and aggressive manner. Primitive humans might have acted in such fashion, but civilized humans should cultivate more appropriate behaviors. In the drawing above, a man carrying a large load accidentally steps on a woman's foot. Given that he gracefully apologizes, the woman both accepts his apology and assures him not to worry. The man and woman depicted interact with each other in a courteous and compassionate manner. The woman understands the man did not intentionally step on her foot, and therefore whether or not she is in pain, she does not attack or blame him. Because she is able to view the situation from his perspective, conflict is diverted. Mutual understanding such as this is a fundamental aspect of civilized society. Some people tend to think the worst of others and become angry over even the smallest of matters, regardless of how their own actions are disturbing in turn. Such intolerance only leads to more conflict. Disrespecting or mistreating people not only inflicts pain upon others, but can also harm one's own conscience and attitude. Having compassion for others is an important facet of social intercourse. Once one strives to understand the experience and perspective of another, one can avoid much trouble and conflict, thus making life more peaceful and just for all. 译文: 人类和野兽的区别就在于后者倾向于相互仇视,交往时不讲道理且好斗。原始人也许会如此行事,但文明人应该养成更得体的举止。 上图中,一个手里捧着很多东西的先生无意中踩了旁边女士的脚。在他有礼貌地道歉后,这位女士不仅接受了他的道歉,还让他不必在意。 上图中的先生和女士诠释了在与人交往时应有的礼貌和富有同情心的态度。这位女士知道他并不是有意要踩她的脚,所以无论疼不疼,她都不会攻击或是埋怨这位先生。因为她能设身处地地看待这件事情,一场冲突就避免了。像这样的相互理解是构成文明社会的基本方面。 一些人往往把别人想得特别坏,为点鸡毛蒜皮的事就大发雷霆,而全然不顾他们自己的行为是多么让别人讨厌。这种偏狭只会导致更多的冲突,对人无礼或粗暴不仅会给别人带来不愉快,而且会损害自己的道德水准和仪态。宽厚是社交中重要的一面,一旦一个人努力去理解别人的做法和看法,他就会避免许多麻烦和冲突,而这会让所有人的生活都变得更美好。
作文范文之英语图表作文万能模板
作文范文之英语图表作文万能模板
英语图表作文万能模板 【篇一:2016年英语六级图表作文万能模板】 2016年英语六级图表作文万能模板 近年来,图表作文在英语四六级考试的作文题出现越来越频繁,以下gkstk小编为大家提供2016年英语六级考试图表作文的万能模板,希望能帮助到大家! 在写看图作文时,注意以下几点: 审题时,除了要把握好图表的表层信息外, 还要分析图标的深层含义,如原因、根源、可能的发展趋势等。图表中所提供的说明文字往往是问题的切入点,一定要仔细分析。 描述数据时要抓住重点,为中心服务,不必面面俱到,切忌毫无目的地罗列图表中的数据。如果数据较多,抓住图表中的极端点(如最大或最小、最多或最少,最好或最差)和基本相同进行描述。 主题句应明确,最好放在文章的开头,这样会使重点突出,主题明了。 常见模板 第一段:总体描述图表,指明时间段,指出突出变化或不同 常用句型或短语: as is clearly shown in the char/ table/graph, ___________ according to the figures given in the table/chart/graph, ____________ it can be seen from the table/chart/graph, _____________________. the figures in the table/chart reflect that ________________. especially, ________________(指出突出变化)第二段:(分析原因) there are several factors leading to
英语四级图表作文讲解及参考范文
英语四级图表作文讲解及参考范文 图表作文也是四(六)级考试中常见,而且被认为是一种较难的作文形式。图表作文就是把非文字信息(通常为各种图表表示的数字信息等)转换成文字信息的一种作文。它要求我们用文字来描述非文字性的图表或对图表显示的关系作解释说明。 第一节图表作文的出题形式和写作要领 一、图表作文常见出题形式 图表作文一般在题目中给出作文的标题和一个或几个统计表格、圆形图、曲线图或条形图,有时还用英文或中文提纲的形式给出提示,要求我们: 1)用文字描述图表,客观解释图表中所传递的信息,并找出某种规律或趋势; 2)就图表中所反映的某种趋势或问题分析其原因或后果。 图表作文着重说明事实,常常是通过对图表中所反映的具体数据的说明、分析、比较,对某种事物或现象的事实或变化情况等加以说明,并提出结论或看法。因此,图表作文常常采用议论文体的写作方法。 写好图表作文,关键在于能否读懂图表中所提供的信息,把握各信息间的联系,用准确流畅的语言把这一信息表达出来,并就这一信息发表自己的看法。 二、图表作文的写作步骤 写图表作文时,要注意遵循以下步骤: 1)认真分析图表的含义,弄清图表中所含的信息及不同信息间的关系; 2)确定文章的主题思想,构思出文章的基本框架,筛选出能说明图表主题思想的典型数据; 3)编列文章的提纲; 4)根据文章的提纲,将各段的提纲内容扩展成段落,然后将各个段落组成文章,注意段与段之间的衔接与过渡; 5)检查与修改。
三、图表作文的篇章结构 写图表作文时,常采用三段式的陈述方式。文章的第一段往往分析图表中的数据变化反映什么问题或趋势,概述图表所揭示的信息。第二段分析造成这一问题或趋势的原因。第三段则展望未来的情况或提出解决问题的办法或建议。这一结构可以简单地表述为: 第一段:概述图表反映的主题思想(总趋势+极端值+特点,时态) 第二段:分析产生的原因 第三段:展望未来或提出方法或建议 模板一 ①总的趋势②图表具体描述③剖析图表所揭示的含义 ④理由一⑤理由二⑥理由三⑦理由四⑧总结⑨前景预测 As can be seen from the table, the past decade has witnessed dramatic changes in①______. While ②_______. It is obvious from the table that③_________. What contributed to these changes? I think the reasons are as follows. To start with, ④______. Secondly, ⑤______ . What’s more, ⑥ _______. Last but not lease, ⑦________. In conclusion, ⑧_________. Moreover, ⑨ ________. 模板二 ①描述图表②分三方面解释原因③下结论 1) During the period from _______to _______, ________rose from ________to _______, while _______ decreased from _______ to _______. 2) We believe that three reasons can account for this phenomenon. First,____. Second, ____. Third, _____. 3) ___.We are happy to see that things are becoming better and better nowadays. We can imagine that ___. 模板三 ①描述图表②解释图表③补充解释 1) During the period between _______ and ________, ________ declined abruptly from _______ to ________, while ________ increased sharply from ________ to _______. 2) Several reasons can account for this phenomenon. Compared with _________ is much cheaper and more convenient__________ . Apart from that, _________. 3) However, there are still a number of people who _________, generally for two reasons. On the
英语图表作文范文
1. The charts below show the percentage of their food budget the average family spent on restaurant meals in different years. The graph shows the number of meals eaten in fast food restaurants and sit-down restaurants. You should write at least 150 words. Give reasons for your answer and include any relevant examples from your own knowledge or experience.
Over the past 30 years, the average family has dramatically increased the number of meals that they eat at restaurants. The percentage of the family's food budget spent on restaurant meals steadily climbed. Just 10 percent of the food budget was spent on restaurant meals in 1970, and 15 percent in 1980. That percentage more than doubled in 1990, to 35 percent, and rose again in 2000 to 50 percent. Where families eat their restaurant meals also changed during that 30-year period. In 1970, families ate the same number of meals at fast food and sit-down restaurants. In 1980, families ate slightly more frequently at sit-down restaurants. However, since 1990, fast food restaurants serve more meals to the families than do the sit-down restaurants. Most of the restaurant meals from 2000 were eaten at fast food restaurants. If this pattern continues, eventually the number of meals that families eat at fast food restaurants could double the number of meals they eat at sit-down restaurants. (164 words) 2. The table below shows the sales at a small restaurant in a downtown business district. Summarize the information by selecting and reporting the main features, and make comparisons where relevant. You should write at least 150 words. Give reasons for your answer and include any relevant examples from your own knowledge or experience.
高考英语作文万能模板之图表作文框架
高考英语作文万能模板之图表作文框架 As is shown by the figure/percentage in the table(graph/picture/pie/chart) has been on rise/ decrease (increases/drops/decreases),有表格或图像可以看出。。。significantly/dramatically/steadily rising/decreasing from______ in _______ to ______ in _____. From the sharp/marked decline/ rise in the chart, it goes without saying that _毫无疑问的看出_______. There are at least two good reasons accounting for __这里至少有两个原因可以对_ X X 作出解释__. On the one hand, _一方面_____. On the other hand, ______ is due to the fact that ________. 另一方面---的原因是。。。In addition, 而且_______ is responsible for _______. Maybe there are some other reasons to show _也许有其他原因要展示_______. But it is generally believed that the above mentioned reasons are commonly convincing. As far as I am concerned, I hold the point of view that _______. I am sure my opinion is both sound and well-grounded.
英语图表作文范文
How People Spent Their Holidays As can be seen from the table, the past decade have witnessed dramatic changes in the way people spent their holiday between 1990 and 2000.In 1990, 63% of people spent their holidays at home, while the figure dropped considerably to 24% in 2000. It is obvious from the table that people tended to be more and more mobile, and they wanted to get entertainment in the outside world. What contributed to these changes? I think the reasons are as follows. To start with, with the rapid development of economy, people earn by far more money than they used to. Thus, people are able to afford traveling expenses. Secondly, people think it important to get well-informed about the outside world in this new era when everything is on the move. Traveling, of course, is a sure way to achieve this goal. What's more, in this competitive society, people are usually under great stress. However, it is not difficult to find traveling an effective way to relieve people's stress and get relaxation. Last but not least, by traveling outside, people are close to nature, which is not only beneficial to both their health and peace of mind. In conclusion, people prefer to go traveling rather than stay at home during holidays for a combination of reasons. Moreover, it seems that this trend will last in the foreseeable future. 人口增长对野生动物的影响(99年真题) [2.图画/图表描述段] From these graphs, we can draw a conclusion that, with the gro wth of human population, the number of species has decreased rapidly in America, and so me species have even vanished from our planet. [6.原因列军段]Why does this phenomenon appear? There are several possible reasons for this. Above all, as the human population grows rapidly, a growing number of people came to live where some wild species have been living. Then these species have to mov