Comparison of MOS evaluation characteristics for Chinese, Japanese, and English in IP telephony
Comparison of MOS Evaluation Characteristics for Chinese, Japanese, and English in IP Telephony
Zhenyu CAI, Nobuhiko KITAWAKI, Takeshi YAMADA Shoji MAKINO
Graduate School of Systems and Information Engineering
University of Tsukuba
Tsukuba, Japan Center for Tsukuba Advanced Research Alliance
University of Tsukuba
Tsukuba, Japan
Abstract—Communication quality in IP te le phony is rate d in te rms of the Me an Opinion Score (MOS), which is an Absolute Cat e gory Rating (ACR) scal e. Th e r e is a probl e m wh e n comparing subje ctive ly e valuate d MOSs in that the e valuation re sults are strongly affe cte d by diffe re nce s in language, the instruction words used for the evaluation, and the nationality of the evaluator. To solve these problems, ITU-T SG12 has started to inv e stigat e th e cultural and languag e d e p e nd e nci e s of subjective quality evaluations undertaken with the MOS method for speech/video/multimedia. In this paper, we present the results of a comparison of the MOS e valuation characte ristics for Chinese, Japanese, and English.
Keywords: Quality of Experience (QoE), Mean Opinion Score (MOS), Language Dependency, Nationality Dependency, ITU-T Study Group 12
I.I NTRODUCTION
Communication services and networks are designed and managed based on the customer’s Quality of Experience (QoE), which measures the level of satisfaction using standard measurement methodologies recommended by the International Telecommunication Union-Telecommunication Sector (ITU-T). QoE is expressed as an average value of opinion scores, namely, the Mean Opinion Score (MOS), obtained using an opinion assessment method with 5-stage absolute qualities [1]. But, the absolute MOS value can vary from country to country because of differences in the nationality, language, and technical background of the evaluators. Therefore, to compare the absolute MOS values of different countries, the MOS characteristics for each country should be investigated in terms of differences in language, instruction words, and nationality. In fact, it was pointed out at the ITU-T SG12 convention 2005-2007 that the subjective evaluation of MOS may be affected by nationality, and therefore the dependencies of language, culture, and nationality should be investigated in relation to sound, image and multimedia QoE evaluation [2]
This paper describes the effect of language, instructional index, and nationality on the opinion assessment method by comparing the MOS characteristics of Chinese, J apanese, and English.
II.PROBLEM OF OPINION SCORE COMPARISON
The essential factors affecting Internet Protocol (IP) telephony are loudness, coding distortion, and packet loss distortion. The volume can be controlled in a digital network, but digital signal distortions should be measured using an opinion assessment method.
The opinion assessment method is specified by ITU-T Recommendation P.800. Five absolute quality assessment categories from excellent to bad are used in the opinion rating test. Then the MOS can be obtained from the average value of all the opinion scores. However, the opinion assessment method may be influenced by assessment conditions such as spoken language, the translation of the instructional index, and the nationality of the evaluator. Therefore, for an international comparison of absolute MOSs, we must pay careful attention to the influence of nationality.
III.O PINION ASSESSMENT EXPERIMENT This section compares the MOS assessment characteristics of Chinese, Japanese, and English under the same experimental conditions. Section III.A provides a detailed description of the
978-1-4244-7820-0/10/$26.00?2010IEEE IUCS2010
conditions of the opinion assessment experiment. Section III.B compares Chinese and Japanese MOSs. Section III.C compares those of J apanese and English, and describes the relationship between those absolute MOSs. Section III.D compares subjective and objective MOSs for Chinese obtained for wideband coding by using the objective quality assessment method “Wideband Perceptual Evaluation of Speech Quality (PESQ) [3] [4],” and the relative correlations in the equation are derived from the experimental results. Finally, section III.E shows the difference and influence of absolute MOSs in different areas of China.
A.Experimental conditions
The opinion assessment experiment was carried out according to ITU-T Recommendation P.800. Table I lists the experimental conditions used for Chinese, and Table II lists the same conditions used for Japanese.
TABLE I. ?E XPERIMENT AL CONDITIONS (C HINESE) Speech sample 2 females and 2 males
Subjects 25 (Chinese)
Experimental environment Listen with headphones in soundproof room Test method 5-point ACR method (ITU-T P.800)
Sampling 16 kHz
Coding conditions(bit rate) G.722(64 56 48)kbps, G.722.1(32 24)kbps,
G.722.2(6.6 12.6 16 20 24)kbps
Packet loss 0, 1, 3, 5, 10%
TABLE II. ?E XPERIMENT AL CONDITIONS (J APANESE) Speech sample 2 females and 2 males
Subjects 32 (Japanese)
Experimental environment Listen with headphones in soundproof room
Test method 5-point ACR method (ITU-T P.800)
Sampling 16 kHz
Coding conditions(bit rate) G.722(64 56 48)kbps, G.722.1(32 24)kbps, G.722.2(16 24)kbps
Packet loss 0, 1, 5, 10%
We have already reported the MOS results of the opinion assessment experiment for J apanese in Ref. [5] for which the experimental conditions are given in Table II. Table III gives the instructional index in Chinese, J apanese, and English corresponding to the 5-stage absolute quality assessment. However, Recommendation P.800 only includes an English instructional index. The index must be translated into other languages before use. The translation of the words may affect the absolute MOS. “?????”
in Japanese may be the same as or slightly different from “excellent” in English. It is also said that J apanese has a tendency to rate “?????” strictly. On the other hand, the Japanese listening quality scale shown in Table III has been used for a long time. The instructional index for Chinese is not yet fully established.
TABLE III. ?L ISTENING QUALITY SCALE
Scor
e Chin
e s
e Japan
e s
e English
5 ????????Excellent
4 ????Good
3 ??????Fair
2 ???Poor
1 ????????Bad
https://www.360docs.net/doc/c717941741.html,parison of Chinese and Japanese MOS
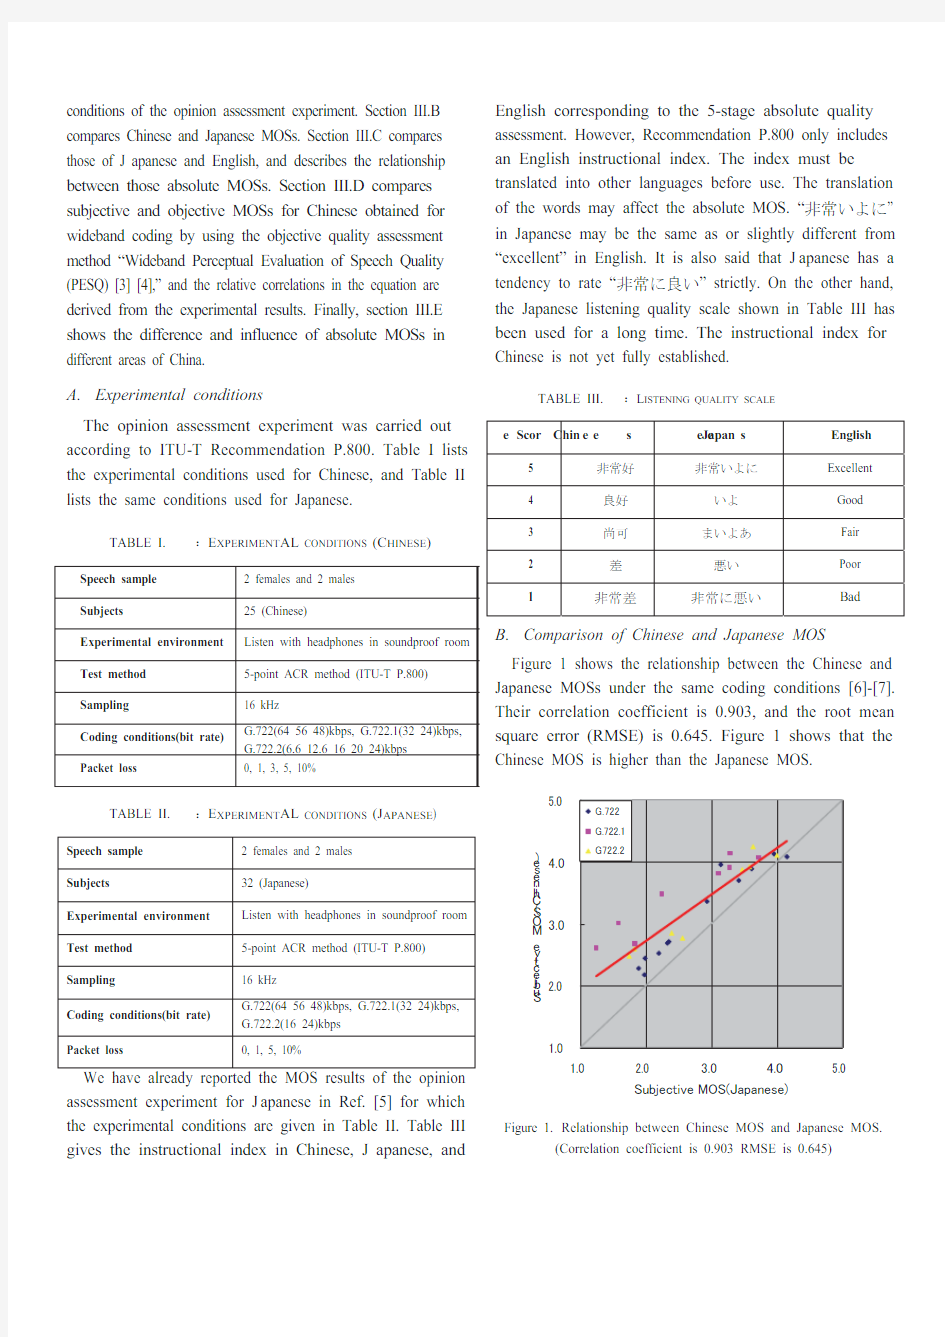
Figure 1 shows the relationship between the Chinese and Japanese MOSs under the same coding conditions [6]-[7]. Their correlation coefficient is 0.903, and the root mean square error (RMSE) is 0.645. Figure 1 shows that the Chinese MOS is higher than the Japanese MOS.
Figure 1. Relationship between Chinese MOS and Japanese MOS.
(Correlation coefficient is 0.903 RMSE is 0.645)
Further research is necessary to determine whether the difference depends on the instructional index or nationality. The relationship between the Chinese MOS and the Japanese MOS is derived in Equation (1). MOS ?Chinese ?˙0.7527×MOS ?Japanese ?ˇ1.219 (1) Figure 2 shows the Chinese MOS converted by Equation (1). The RMSE after conversion is 0.435, which is smaller than before.
Figure 2. Relationship between Chinese MOS converted by
Equation(1)and J apanese MOS.
(Correlation coefficient is 0.903 RMSE is 0.435)
C. Comparison of MOS between Japanese and English
The relationship between the English MOS and the apanese MOS is described in TTC standard J .201.01 conforming to the J apanese Domestic Standard [8]. Under the same coding conditions, most English MOSs are higher than J apanese MOSs. Their relationship is expressed by Equation (2).
MOS(Japanese)˙ 0.8681×MOS(Eng lish)ˇ0.0271 (2)
D. Comparison of subjective and objective MOSs in Chinese
Figure 3 shows the relationship between subjective and objective MOSs in Chinese. The Chinese objective MOS is calculated from Wideband PESQ. In Figure 3, the horizontal axis shows the subjective MOS and the vertical axis shows the objective MOS. The correlation coefficient is 0.95 and the RMSE is 0.75. It can be seen that the RMSE is large. This is because the wideband PESQ is based on
the English MOS. Therefore, we propose the following reflection Equation (3) for Chinese.
MOS(subjective)˙1.3843×MOS(objective)ˉ
0.2819 (3)
Figure 3. Relationship betweetn subjective MOS and objective MOS.
(Correlation coefficient is 0.95 RMSE is 0.75)
Figure 4 shows the Chinese objective MOS reflected by
proposed Equation (3).
Figure 4. Relationship between subjective MOS and objective MOS
converted by Equation(3)
(Correlation coefficient is 0.95 RMSE is 0.24)
The RMSE of the Chinese objective MOS and subjective MOS after conversion is 0.24, which is smaller than before.
E. Difference between Chinese MOSs south and north of HuaiHe River
T he Han ethnic group accounts for 90.56% of the
population of China, and Chinese is the first language.
Under the experimental conditions shown in Section III.A, the Chinese subjects consisted of 14 people from the north region of the HuaiHe River (ex.Beijing), and 11 people from the south region of the HuaiHe River (ex.Shanghai). Figure 5 compares MOSs in terms of this south and north HuaiHe River division. There was no significant difference between them although the South MOS was very slightly lower than the North MOS.
Figure 5. Relationship between North of China MOS and South of China MOS.
(Correlation coefficient is 0.95 RMSE is 0.75) IV. A NALYSIS O F NATIONALITY
In section III, the Chinese MOS tended to be higher than
the Japanese MOS. To investigate the reason for this, this section analyzes Chinese and J apanese voting under
identical experimental conditions. Table IV shows the
frequency with which subjects voted in each category.
TABLE IV. ? FREQUENCY OF VOTING
Quality of speech (Scor e ) Chin e s e Japanese Excellent ?5? 16% 7% Good ?4?
26% 19%
Fair ?3? 29% 28% Poor ?2? 22% 35%
Bad ?1? 7% 11%
It can be seen from Table IV that the frequency of voting
“bad” is low for Chinese, while the frequency of voting
“excellent” is low for J apanese. The latter result has also been noted when comparing J apanese with English. The reason is believed to be based on national character (namely, nationality). The instructional index must be properly translated taking national characteristics into consideration.
V. C ONCLUSION
This paper compared the MOS characteristics of Chinese, J apanese and English. It should be noted that J apanese is stricter regarding quality assessment than Chinese, and conversion equations were introduced comparison of the absolute MOSs in Chinese, Japanese, and English.
At the same time, a Chinese mapping function from Wideband PESQ to objectively estimated MOS was proposed. Finally, when comparing the absolute MOSs of different counties, it is necessary to take nationality into account.
R EFERENCES
[1] ITU-T Recommendation P.800, “Methods for subjective
determination of transmission quality,” Aug. 1996.
[2] ITU-T, “Report of the Meeting of Study Group 12,” TD-R17, Oct.
2007. [3] ITU-T Recommendation P.862, “Perceptual evaluation of speech
quality (PESQ): An objective method for end to end speech quality assessment of narrow-band telephone networks and speech,” Feb. 2001.
[4] ITU-T Recommendation P.862.2, “Wideband extension to
Recommendation P.862 for the assessment of Wideband telephone networks and speech codec,” Nov. 2005.
[5] N. Kitawaki, K. Nagai, T. Yamada, “Objective quality assessment
of wideband speech coding,” IEICE Trans. Comm., Vol. E88-B, No. 3, pp. 1111-1118, Mar. 2005.
[6] Zhenyu CAI, N. Kitawaki, T. Yamada, “Comparision of MOS
evaluation characteristics between Chinese and J apanese, “2009
IEICE General Conference., B-11-12, March 2009 [in Japanese]. [7] Zhenyu CAI, N. Kitawaki, T. Yamada, “Comparision of MOS
evaluation characteristics by Chinese, J apanese and English in
Telephony, “IEICE Technical Committee on Communication
Quality,IEICE Technical Report CQ2009-28, pp. 17-20,September 2009 [in Japanese].
[8] TTC J J 201.01, “A Method for Speech Quality Assessment of IP
Telephony,” 4th Version, March 2007.