Studying the fine microstructure of the passive film on nanocrystalline 304 stainless steel by EIS
ORIGINAL PAPER
Studying the fine microstructure of the passive film on nanocrystalline304stainless steel by EIS,XPS, and AFM
Z.J.Zheng&Y.Gao&Y.Gui&M.Zhu
Received:29October2013/Revised:5March2014/Accepted:26March2014
#Springer-Verlag Berlin Heidelberg2014
Abstract The fine microstructure of the passive films on nanocrystalline(NC)and coarse crystalline(CC)304stainless steels(SSs)in0.5M H2SO4were investigated by electro-chemical impedance spectroscopy(EIS),X-ray photoelectron spectroscopy(XPS),and atomic force microscopy(AFM). The results indicate that the passive film on both CC and NC SSs exhibits a two-layer microstructure consisting of a compact inner layer and a porous outer layer.Some hydrated compounds(HC)were present in the porous outer layer of NC SS but not CC SS in0.5M H2SO4solution.The pores in the outer layer of the NC SS were observed to be in the nanoscale by AFM.HC filling of the pores in the passive film on NC SS may occur due to capillary forces endowed by the nanosize pores.XPS analysis of the passive films on both CC and NC SSs,however,does not show such a composition difference which is attributed to dehydration occurring in the XPS vac-uum chamber.Both the inner and outer layers of the NC SS were determined by EIS analysis to be more compact and protective than the corresponding films on CC SS as evi-denced by the lower Q value,higher n,and much higher R value in the corresponding layer.
Keywords Stainless steel.EIS.Passive film.Microstructure Introduction
It is well known that the superior corrosion resistance of stainless steel(SS)arises largely from the dense passive film formed on its surface.A number of studies of the chemical composition,microstructure,and properties of the passive film formed on SS or Fe–Cr alloys have been reported in recent decades[1–7].The results are in good agreement that the passive film formed on SS exhibits a duplex structure consisting of an inner chromium-rich oxide layer in contact with the metallic substrate,and an outer layer of iron-rich oxide and hydroxide at the film–electrolyte interface,with a total film thickness of a few nanometers[1,3,4,7].However, further studies on the fine microstructure,especially the com-pactness and pore size of each layer of the passive film on SS, are relatively limited probably due to the difficulty of analyz-ing and characterizing the two layers separately since they are very thin.
The compactness of the passive film on alloys can be estimated by potentiostatic polarization testing[8–10].In potentiostatic polarization measurements,the current is mea-sured at a fixed potential after cathodic reduction and its dependence on time during film formation can be expressed by the formula[11]:
I?10?Atk log t
eTe1T
where I represents current density,t represents the time,A is a constant,and k is the slope of the double-log plot for potentiostatic polarization.In the literature[12,13],k=?1 indicates a high-field-controlled migration mechanism for oxide film growth,while k=?0.5suggests diffusion-limited film growth.Other works[8–10]suggest that k=?1usually relates to the formation of a highly compact and protective passive film,while k=?0.5relates to porous film formation as a result of dissolution and precipitation processes.
This Z.J.Zheng
:Y.Gao:Y.Gui:M.Zhu
School of Materials Science and Engineering,South China
University of Technology,Guangzhou510641,
People’s Republic of China
Z.J.Zheng
School of Mechanical and Automotive Engineering,South China
University of Technology,Guangzhou510641,
People’s Republic of China
Y.Gao(*)
:M.Zhu
Key Laboratory of Advanced Energy Storage Materials
of Guangdong Province,Guangzhou,China
e-mail:meygao@https://www.360docs.net/doc/ed7012987.html,
J Solid State Electrochem
DOI10.1007/s10008-014-2472-5
method,however,is insufficiently comprehensive because it can only evaluate the compactness of the whole passive film as a global layer and does not account for the compactness of the specific layer in the passive film with a duplex or multi-layer microstructure.
The compactness of each sublayer as well as the whole film can be characterized by the capacitance value of the counter-part.The relationship between compactness and capacitance of a film can be derived from the relation[14]:
C?ε0εA
d
e2T
where C is the capacitance of the film,ε0is the permittivity of free space,εis the dielectric constant of the film,A is the area of the parallel plate capacitor,and d is the film thickness.From Eq.(2),it can be seen that the value of C increases with increasing A under the same values of other parameters. Higher A implies a more porous film;therefore,a higher capacitance corresponds to a poor compactness of the film and vice versa.This model has been confirmed experimentally in the literature[15].Electrochemical impedance spectrosco-py(EIS)has been widely used to characterize the impedance behavior of a film by proposing an equivalent electrical circuit (EEC)for an electrochemical system[16–18].The capaci-tance change of each layer in the film,which is highly affected by changes to the dopant concentration in the film[19],can be readily determined by fitting EEC.It is therefore possible that the compactness of each specific layer in the film be estimated through capacitance measurements of those layers by EIS.
Nanocrystallization has previously been shown to have an important impact on the microstructure and compactness of passive films on SSs[20–23].We have found that the com-pactness of the passive film on304SS was improved after nanocrystallization by equal-channel angular pressing (ECAP)based on potentiostatic polarization tests[23].Similar results were also observed by Wang[10,24]when investigat-ing the effect of nanocrystallization on the corrosion behavior of309SS.The studies on the compactness of the film on nanocrystalline(NC)SS in the reported literatures[10,23,24] have been devoted to the characterization of the whole film rather than the separate layers within the passive film.Thus,it is still not clear whether the compactness improvement of the whole film on NC SS comes from the inner,outer,or both layers.The present paper,therefore,is aimed at investigating the compactness of each sublayer in the passive film with duplex microstructure on both coarse crystalline(CC)and NC 304SSs through capacitance measurements of each layer and then further proposing the fine microstructure of the passive film on both CC and NC SSs,which has not been described to date.In addition,X-ray photoelectron spectroscopy(XPS)and atomic force microscopy(AFM)were used to analyze and characterize the composition and topography of the passive film which have helped to reveal the microstructure of the passive film on both CC and NC SSs.
Experimental
The material used in this study was commercial304SS with chemical composition in Table1.The bulk NC304SS was obtained by a new conceptual metal forming process—equal-channel angular pressing(ECAP).The detailed ECAP setup and processes are described in our previous literature[23]. The two specimens used in the present study included zero-pass(as received)and eight-pass(by ECAP)304SSs.The as-received sample(zero pass)was the CC304SS,with grain size of about50μm and a large number of annealed twins. The eight-pass sample was the NC304SS,with grain size of about80–120nm and high dislocation density inside some grains[23].The as-received and eight-pass304SS samples were not sensitized because the alloying elements were dis-tributed uniformly according to scanning electron microscope (SEM)observation of the microstructure along with X-ray mapping of nickel,chromium,and carbon(SEM images are not given here).
All electrochemical tests including the potentiodynamic polarization test and EIS test were carried out at room tem-perature(25°C)in0.5M H2SO4solution using an Autolab PGSTAT30advanced potentiostat(Metrohm AUTOLAB B.V,Utrecht,Netherlands).A traditional three-electrode sys-tem was used with a saturated calomel electrode(SCE)as the reference electrode and Pt as the counter electrode.Both potentiodynamic polarization and EIS tests were performed three times in order to confirm the reproducibility of the tests. The value of each electrochemical parameter in the following text is the average result of three experiments.All samples were cut with an electric discharging machine perpendicularly to the pressing direction of ECAPed billets.The samples were mounted with epoxy with an area of1cm2left exposed.Prior to each experiment,the exposed surface of the samples was ground consecutively with600-and1,200-grit SiC papers, and further polished with alumina polishing powder down to 1μm.Before electrochemical tests,all the samples were cathodically reduced at?1.0V vs.SCE for3min,which is sufficient to remove the passive film formed in air[23].
The potentiodynamic polarization tests were implemented at a scan rate of0.5mV/s to measure the open-circuit potential (OCP or E corr),corrosion current density(I corr)at OCP,and the steady-state passive current density(I p)of the samples.
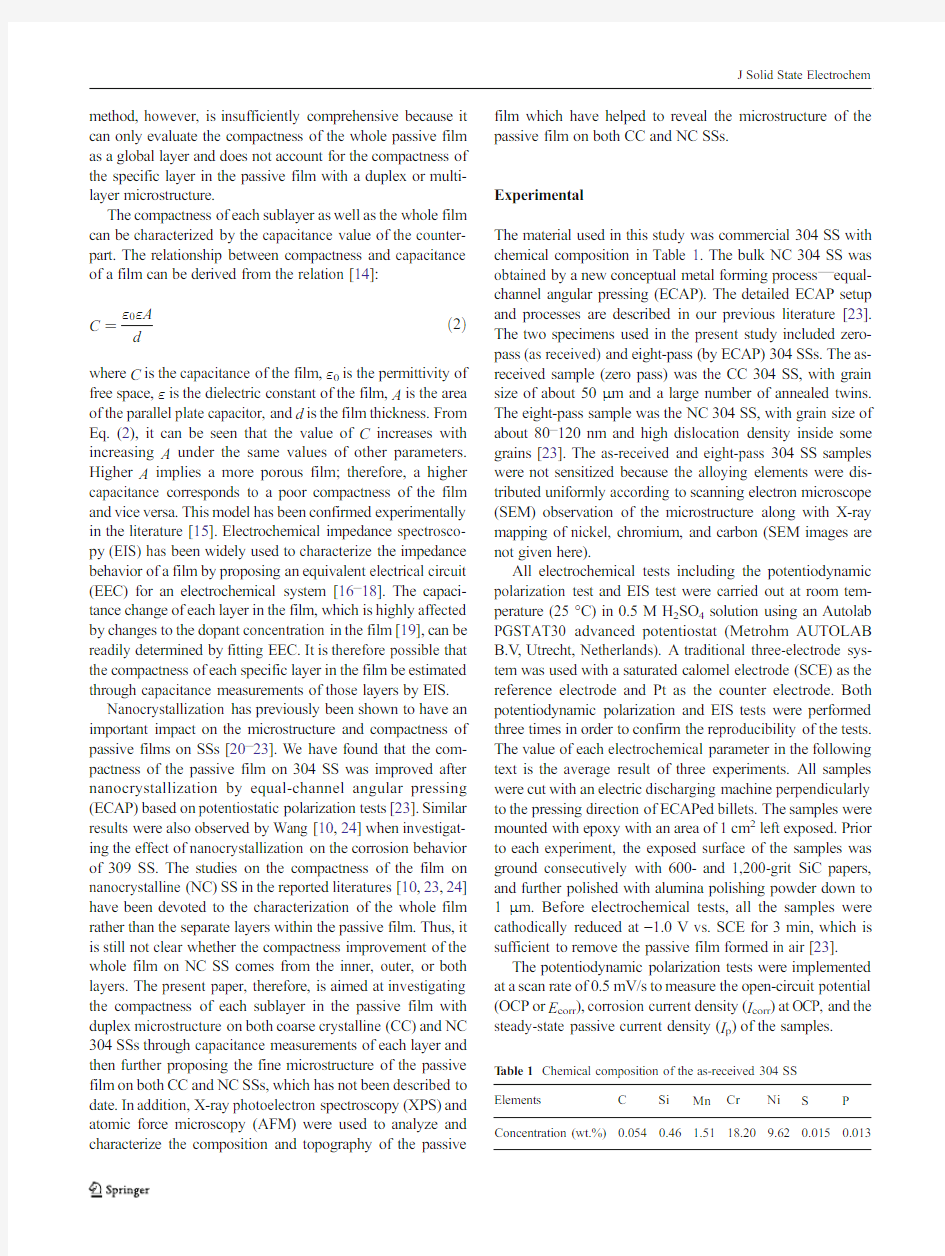
T able1Chemical composition of the as-received304SS
Elements C Si Mn Cr Ni S P Concentration(wt.%)0.0540.46 1.5118.209.620.0150.013
J Solid State Electrochem
EIS tests were performed to compare the impedance be-havior of both CC and NC samples over the frequency range from100kHz to10mHz with an amplitude signal of10mV (peak to zero)at the respective OCP.The frequency spectra were analyzed in the complex plane using the software for complex nonlinear least squares fitting developed by Boukamp[25].A delay time of30min was set before EIS measurement to allow the passive film to form stably in the solution.In order to confirm the stability of the passive film formed in30min(0.5h)of immersion in0.5M H2SO4,EIS tests were also performed on samples with24and48h of immersion.The phase angles in the Bode-phase plots were found to have no obvious shift between0.5,24,and48h of immersion,which indicates that the passive film formed in 30min of immersion is sufficiently stable.
Samples for XPS and AFM were immersed in0.5M H2SO4solution at room temperature for30min to obtain a stable passive film and then rinsed with distilled water,dried,
and stored in a desiccator until use.XPS measurements were performed using an ESCALAB250instrument(Thermo-VG Scientific,East Grinstead,England).The thickness of the passive film was determined using a raster1keV Ar+ion beam at a rate of2.04nm/min,which was calibrated by measuring the sputtering depth per minute in a standard spec-imen(SiO2).After a background subtraction and processing with XPSPEAK41software,the XPS signals were separated into the contributions from different species.The evaluation of the spectra was performed using the parameters of standard peaks.AFM was performed using a Multimode SPM3a with silicon nitride AFM probe(V eeco Metrology Group,Santa Barbara,CA,USA).AFM topography images were realized in tapping mode at room temperature(25°C).NanoScope?software was used for imaging function.
Results and discussion
Potentiodynamic polarization curves
Figure1illustrates the potentiodynamic polarization curves of the CC and NC304SSs in0.5M H2SO4solution.E corr and I corr obtained from the polarization curves are given in Table2. The value of I corr was determined by extrapolating the cathode Tafel slope back to the corresponding value of E corr.
The anodic polarization fraction in the potentiodynamic polarization curves in Fig.1displays an obvious passive region for both NC and CC SSs in0.5M H2SO4solution before overpassivation.The I P value of NC is significantly lower than that of CC as shown in Table2,indicating that nanocrystallization decreases the dissolution rate of the pas-sive film in0.5M H2SO4solution(i.e.,the passive film on NC 304SS displays higher electrochemical stability).In addition, the NC sample has more positive E corr and lower I corr than CC SS,indicating that the stability of the passive film,and sub-sequently the corrosion resistance of304SS in0.5M H2SO4 solution,is increased after nanocrystallization by ECAP.
EIS analysis
Since simple inspection of the electrochemical impedance data does not necessarily reveal whether or not the data are valid or have been distorted by some experimental artifacts, the Kramers–Kroning(K–K)relationships were applied to check the validity of experimental results.Any system that satisfies the a priori conditions of linearity,stability,and causality must satisfy the K–K relationships[26,27].The K–K technique transforms the real component into the imaginary component and vice versa,so that the trans-formed quantities may be compared directly with their corresponding experimental values for the same parame-ters.As can be seen from Fig.2,the excellent agreement between the experimental and transformed impedance data for both real and imaginary components show that the system under investigation complies with the linearity, stability,and causality constraints of linear system theory and thereby validates the EIS data.
Figure3shows the Nyquist plots(a),Bode-log[Z]plots (c),and Bode-phase plots(d)of EIS at OCP in0.5M H2SO4 solution for both CC and NC samples,while(b)is the en-largement of the black block area in(a).The Nyquist plot
of Fig.1Potentiodynamic polarization curves with a scan rate of0.5mV/s of the CC and NC304SSs in0.5M H2SO4
T able2Corrosion parameters in0.5M H2SO4of both CC and NC304 SSs
Sample E corr.(V vs.SCE)I corr.(μA cm?2)I p(μA cm?2) CC?0.193080
NC0.11 1.2516
J Solid State Electrochem
CC SS appears to show an entire depressed capacitive semi-circle over the whole frequency region examined.This is in contrast to the NC SS,where some partial capacitive semicir-cles with much larger diameter in the whole frequency domain are included.In the Bode diagrams of log [Z ]vs.log f ,the total impedance of the matrix/film/solution system for NC SS is larger than that of CC SS and the linear segment slopes of both samples are about ?0.85.In the Bode-phase plots vs.log f ,the phase angles are always smaller than 90°.For CC SS,the EIS spectra exhibit two obvious phase angle peaks in the Bode-phase plot (indicated by the two arrows in Fig.3d ),suggesting that two time constants may be estimated.In the case of NC SS,the Bode-phase plots in the low-frequency region (below 1Hz)display inflection character,and there is a wide-phase angle peak at frequencies from 10to 10,000Hz with less-phase angle fluctuation,suggesting that there are interactions of at least two time constants.If the data collected in the frequency region from 10to 10,000Hz is deemed to be very overlapping,arising from the slight asymme-try in this region,there may be three time constants for the NC sample.
In accordance with this analysis,two equivalent circuits related to the microstructure of the passive films on SSs are introduced in Fig.4,where Fig.4a presents EEC 1with two time constants and Fig.4b presents EEC 2with three time constants.EEC 1is used to model the experimental results of CC 304SS,and Fig.4c shows the comparison of
experimental
Fig.2K –K transforms of the real and imaginary components of the EIS data for CC (a )and NC (b )
SS Fig.3a Nyquist plots,c Bode-log [Z ]plots,and d Bode-phase plots of impedance spectra of the CC and NC 304SSs.b The enlargement of the black block area in a
J Solid State Electrochem
and modeled EIS spectra obtained for CC SS.A good fit is achieved between our experimental results and EEC 1for CC SS,so the EEC 1with two time constants is validated for the CC sample.In contrast,a Bode plot analysis of whether two or three time constants are more suitable for NC SS was incon-clusive.Hence,both EEC 1and EEC 2were applied to model the experimental results of NC SS and these results are shown in Fig.4d,e .A better fit was obtained when using EEC 2;therefore,the EEC 2model with three time constants is vali-dated for the NC sample.
The fit quality of the theoretical EEC to the experimental results can also be described by Chi-squared (χ2)which is automatically given in the fitting results.Low χ2values confirm good compatibility between experimental and theo-retical EEC results [25].The value of χ2by using EEC 2for the NC sample is about 7.903×10?4,which is signifi-cantly lower than the χ2of 5.561×10?3obtained by using EEC 1,suggesting that EEC 2with three time constants is a
better model for NC SS.The χ2value obtained by using EEC 1for CC SS was about 3.689×10?4.Additionally,capacitance –time measurements in 0.5M H 2SO 4also con-firmed the existence of three time constants for NC SS and only two time constants for CC SS (capacitance vs.time plots are not given here).From the fitting of these results,a two-layer microstructure of the passive film (inner and outer layers)is deduced for CC SS,and a three-layer microstructure (inner,outer,and third layers)is deduced for NC SS at the moment.
EECs resembling the EEC 1and EEC 2in Fig.4have been proposed previously for unsealed [28]and sealed [29]anodic oxide films on aluminum alloy.In both circuits,R e represents the electrolyte resistance,and R 1,R 2,and R 3represent the charge transfer or ionic flux resistance through the inner,outer,and third layers,respectively.Some constant phase elements (CPE)are present in the system,and CPE 1,CPE 2,and CPE 3represent constant phase element of the inner,outer,and
third
Fig.4a The proposed EEC 1with two time constants.b The proposed EEC 2with three time constants.c The experimental and fitted impedance spectra in Bode-phase format for CC SS using EEC 1.d The experimental and fitted impedance spectra in Bode-phase format for NC SS using EEC 1.e The experimental and fitted impedance spectra in Bode-phase format for NC SS using EEC 2
J Solid State Electrochem
layers,respectively.A constant phase element is an equivalent electrical circuit component imitating the behavior of an im-perfect capacitor,and its impedance may be defined by the equation [30]:Z CPE ?Q j ωeTn ?
?1
e3T
where Q is the capacitance parameter with units of Ω?1cm ?2s n ,ωis an angular frequency in rad s ?1,and the factor n is the parameter which characterizes deviation of the system from ideal capacitive behavior.When n =1,the CPE describes an ideal capacitor (corresponding to an ideal flat electrode)and Q is equal to the capacitance C .When n =0.5,the CPE represents a Warburg impedance related to the ionic flux across the film (corresponding to porous electrodes)[30].
Table 3gives the values of impedance parameters includ-ing R e ,R 1,R 2,R 3,Q 1,Q 2,and Q 3and n 1,n 2,and n 3from EEC 1fitting of CC SS and EEC 2fitting of NC SS.These values were obtained by fitting the experimental and simulat-ed data using ZSimpWin “Equivalent Circuit ”software.For the inner layer,closest to the SS matrix,the value of Q 1for NC SS is lower than that of CC SS.For the outer layer,however,the Q 2value of NC SS is significantly lower than that of CC SS.In addition,Q 2is much higher than Q 1for both samples.For both CC and NC samples,the composition as well as the thickness of the passive film formed in 0.5M H 2SO 4solution are roughly identical by the following XPS analysis,which implies similar dielectric constants (ε)in the same corrosive https://www.360docs.net/doc/ed7012987.html,ing Eq.(2),the following conclusions can be drawn:(1)the inner layer of NC SS is more compact than that of CC SS due to its lower Q 1value.(2)The outer layer in the passive film on NC SS is far more compact than that on
CC SS due to the much lower Q 2value.(3)The inner layer is denser than the outer layer for both samples.The exponent n in Table 3ranges between 0.70and 0.93,and the NC SS has higher n 1and n 2than the corresponding CC SS,which also indicates that both the inner and outer layers of NC SS are more compact than in the case of CC SS.Table 3shows that R e is approximately 2.0Ωcm 2in both samples.This corre-sponds to the first intersection of the capacitive semicircle with the real axis in the high-frequency region of the Nyquist plot.R 1and R 2are related to the charge transfer resistance through the inner layer and the outer layer,respectively.Both the R 1and R 2values of the NC sample are much higher than the corresponding CC SS values,indicating that the charge transfer resistance in both the inner and outer layers of the passive film on the 304SS is increased greatly by nanocrystallization.Furthermore,the R 3value of NC sample reaches a significantly higher level,which may be related to the character of the additional filling layer (see “Discussion ”section vide infra).These phe-nomena indicate that the redox processes occur with more difficulty in the film on NC SS,implying that the film is more compact and electrochemically more stable,which is in accordance with the Q values of both samples.A proposed two-layer microstructure of the passive film on CC SS is schematically shown in Fig.5a ,which consists of a relatively dense inner barrier layer (marked as layer A)and a porous outer layer (marked as layer B).A three-layer microstructure for NC SS is shown in Fig.5b with the internal two layers similar to the microstructure of CC SS,but rela-tively more compact,and an additional third layer being represented as a dashed rectangular,the nature of which will be discussed
below.
a
Matrix
Layer A
Layer B 2CPE 2)
b Third layer
CPE 3)
Layer A Layer B Matrix
Fig.5Schematic diagrams of the passive film microstructure based on EEC analysis.a A two-layer model with a compact inner layer and a porous outer layer on CC SS.b A three-layer model with duplex microstructure similar to that on CC SS and the third layer adsorbed on layer B for NC SS
T able 3Impedance parameters from EEC fitting for both CC and NC 304SSs Samples
R e (Ωcm 2)
R 1(Ωcm 2)R 2(Ωcm 2)R 3(Ωcm 2)Q 1×10⁶
(Ω?1cm ?2s n )n 1Q 2×10⁶
(Ω?1cm ?2s n )n 2Q 3×10⁶
(Ω?1cm ?2s n )n 3
CC 2.0980552–
4.60.857
5.60.70–NC 2.08
10,540
3,998
35,000
3.3
0.93
35.9
0.80
1.8
0.91
J Solid State Electrochem
XPS analysis
The impedance behavior of the passive film on the surface of SS in a given corrosive solution is related to the composition, microstructure,and compactness of the passive film.In this section,XPS analysis has been carried out to characterize the composition and microstructure of the passive film formed in 0.5M H2SO4solution at OCP in order to better understand the impedance properties of CC and NC304SS.Evaluation of the spectra was performed using the parameters of standard peaks. According to the peak strength in high-resolution XPS signals of Cr2p3/2and Fe2p3/2,the main component in the passive film was Cr3+in Cr2O3at576.4eV,Fe3+in Fe2O3at710.6eV, and Fe2+in FeO at708.5eV,respectively.Figure6shows the atomic percentages of all the elements in the passive film formed in0.5M H2SO4solution at OCP for both CC and NC304SS.
Figure6shows that the elemental content variation of both CC and NC SS is generally very similar with increasing sputter depth.For both samples,the passive film consists of two regions including the outer region(OR)and inner region (IR).Each OR is mainly composed of(CrO,FeO)(OH)and (Cr,Fe)3+oxide,while the main component of each IR is composed of(Cr,Fe)2O3oxide.The thickness of the total film including OR and IR for both samples is about7nm when the boundary between the passive film and substrate is estimated to be where the oxygen content is around5%(at%),due to the fact that the oxygen level in SS keeps stable and low when the oxygen content is lower than5%.The above XPS results reveal that the passive films formed on both CC and NC304 SSs in0.5M H2SO4solution have similar composition and microstructure.It is worth mentioning that the“layers”defined in the EIS analysis(Fig.5)may not correspond exactly to the“regions”defined in the XPS analysis (Fig.6)as the factors influencing the impedance behavior of the passive film include not only the elemental compo-sition but also the microstructure.
Discussion
Comparison of Figs.5and6demonstrates that the film microstructure deduced from EEC analysis is in good agree-ment with that from XPS analysis of CC SS in0.5M H2SO4 solution.Thus,a two-layer model is reasonable for the
passive
a
Layer
B
Layer
A
Matrix
b
Layer
Layer
Matrix
Fig.7Schematic diagrams of
passive film microstructure based
on the comprehensive analysis of
EEC and XPS analyses of both
CC and NC304
SSs.a A two-
layer model with a compact inner
layer and a porous outer layer for
CC SS.b A two-layer model
similar to that given for CC SS
but with HC filling into the
porous outer layer on NC SS
Fig.6Atomic percentages as a function of sputter depth for the passive
films on a CC304SS and b NC304SS in0.5M H2SO4.Dashed lines
denote the interfaces between OR,IR,and matrix,respectively
J Solid State Electrochem
film on CC 304SS,with a relatively dense inner layer A and porous outer layer B,as is shown in Fig.7a .For NC 304SS,a three-layer model of passive film (Fig.5b )is deduced from the EEC due to the three time constants;however,a two-layer microstructure (Fig.6)is inferred from the XPS analysis,suggesting that the third layer in the EEC model could be a filling layer which fills the pores of outer layer B and does not constitute a separate layer on top of layer B.According to published results [31],this filling layer consists of some hydrated compounds (HC)which may,however,lose water and become dry in the vacuum XPS chamber.In view of this
fact,it is understandable that although an additional filling layer is present in the film on NC 304SS,the composition analysis by XPS does not show this change compared to CC sample.Thus,the microstructure of the passive film on NC 304SS actually to be a two-layer model similar to that on CC SS,but with some additional hydrated compounds which fill into the pores of the outer porous layer B,as schematically shown in Fig.7b .
One explanation as to why the HC fillings are present only in the pores of the passive film on NC SS and not on CC SS may be due to capillary wicking of the pores
0.8(μm)0.6
0.4
0.2
0.80.6
0.20
(μm)0.4
d
0.8(μm)0.6
0.4
0.2
(μm)
(μm)
f
(μm)
e
a
(μm)(μm)
1.0
(μm)
02.0
(μm)b
15.4nm
7.7nm
0.0nm
Fig.8AFM images of the
outmost film on both CC and NC SSs in 0.5M H 2SO 4.a Two-dimensional image of CC SS,b two-dimensional image of NC SS,c enlargement of the dashed block area in a.d Enlargement of the dashed block area in b.e Three-dimensional image of CC SS corresponding to a ;f three-dimensional image of NC SS corresponding to b
J Solid State Electrochem
in the outer porous layer B.The capillary action strongly depends on the value of capillary pressure P,exerted by water on the pores[32,33].The larger the value of P is, the higher the probability that water(or HC)is absorbed into and kept in the pores by capillary suction.P can be calculated using the following equation[34]:
P?2σcosθ
r
e4T
whereσis the solution surface tension in air,θis the contact angle,and r is the equivalent pore radius.For both NC and CC 304SSs,the value ofσis constant in the same solution. According to previous studies by Ahn[35]and Kim[36], the surface of nanostructured metals results in the decreasing of contact angleθ;for example,on a coarse-grain-structured surface(θ=49.3°)and on the analogous nanostructured sur-face(θ=2.1°)[35].Even so,the contribution of cosθto the value of P in Eq.(4)is not significant because the variation in cosθis relatively small whenθis between2.1°and49.3°(cos 2.1°=0.9993,cos49.3°=0.6521).Thus,it is requisite that there is a rather small r for NC304SS in order to obtain a large enough P to promote capillary suction.Tas[32]and Ahn [35]have indicated that only surfaces with nanometer or micro/nanometer pore structure were able to absorb water by changing the surface wettability,while our EIS analysis has revealed that the porous layer B on of NC SS is more compact than that on CC SS.
In order to confirm that average pore diameter of the outmost layer B on the two SS samples are different,AFM was applied to inspect the surface topographies in the range of 0–2μm.Figure8a and b are two-dimensional AFM images. Figure8c and d are the enlargements of the dashed block area in Fig.8a and b,respectively.Figure8e and f are three-dimensional AFM images of both samples,respectively.
From Fig.8a,c,and e,a rough and porous surface is observed for CC304SS;however,a different surface mor-phology was formed on NC SS with better compactness characterized by smaller pore size(Fig.8b,d,and f).For CC SS,the pores are extensively interconnected and the length of the interconnected pores can reach1,000nm(marked as red dashed line areas in Fig.8a,c).However,the pores on NC SS are isolated,and the pore sizes are in the range from10to 100nm(marked by red and white arrows in Fig.8b,d).It is clear that a larger number of tiny pores with diameters in the range of10to50nm are present in NC SS(marked by white arrows in Fig.8d),which contributes to the absorption of HC by capillary wicking.The outer layer on CC SS,however, exhibits pores size in the micrometer scale.The conclusions derived from AFM observations concerning the pore size and compactness of the outmost films on both CC and NC SSs suggest a reason why the HC fillings are present only in the pores of the outer layer on NC304SS and not in the pores on CC SS.
Based on the above comprehensive analysis,a clear under-standing of the microstructure and electrochemical properties of the passive film on both NC and CC SSs has been attained. First,the inner dense layer A of the NC304SS is more compact and more protective than that on CC304SS,which is supported by the lower Q1and much higher R1of the NC sample.Second,the outer porous layer B on the NC304SS is also more compact and more protective than the counterpart on the CC304SS,supported by its lower Q2and much higher R2values.The better film compactness of the NC sample is characterized by the smaller pore size and lower porosity of the outer layer.Third,the pores of the outer layer B on NC304 SS are filled by HC,which further enhances the compactness of this layer and subsequently improves the electrochemical stability and corrosion resistance of the passive film.The extremely high R3value of the filling layer on NC304SS strongly supports this view.
Conclusions
The electrochemical behavior and passive film microstructure of the NC and CC304SSs in0.5M H2SO4solution have been explored using potentiodynamic polarization curves,EIS measurement,XPS analysis,and AFM observation.The NC SS sample is found to distinguish itself from the CC,one in better electrochemical stability by the more positive E corr, lower I corr,and I p values from potentiodynamic polarization curves,and by the larger R1,R2,and R3values from EIS tests.
A two-layer model of the passive film has been established for both NC and CC samples,which consist of a compact inner layer and a porous outer layer,with a total film thickness being about7nm.For the NC sample,however,there exists some HC absorption which fills the nanometer-scale pores of its porous outer layer due to capillary suction endowed by nano-meter size pores.Meanwhile,both the inner layer and outer layer of the NC SS are found to be more compact and more protective than the corresponding layers on CC SS,verified by their lower Q values and much higher R values in the NC SS case.The fact that the pores of the outer layer on NC SS are filled by HC contributes further to the compactness of the layer,and consequently its better electrochemical stability and corrosion resistance in0.5M H2SO4solution. Acknowledgments The authors would like to thank Dr.Miao XR for the assistance in AFM experiment.This work was financially supported by the National Natural Science Foundation of China(NSFC)under Grant No.50871041,the Fundamental Research Funds for the Central Universities under Grant No.20112M0064,and the Key Laboratory of Clean Energy Materials of Guangdong Higher Education Institute under Grant No.KLB11003.
J Solid State Electrochem
References
1.Kruger J(1989)Corros Sci29(2–3):149–162
2.Hakiki NE,Boudin S,Rondot B,Belo MDC(1995)Corros Sci
37(11):1809–1822
3.Ferreira MGS,Hakiki NE,Goodlet G,Faty S,Simos AMP,Belo
MDC(2001)Electrochim Acta46(24–25):3767–3776
4.Olsson COA,Landolt D(2003)Electrochim Acta48(9):1093–1104
5.Sudesh TL,Wijesinghe L,Blackwood DJ(2007)Corros Sci50(1):
23–34
6.Freire L,Carmezim MJ,Ferreira MGS,Montemor MF(2010)
Electrochim Acta55(21):6174–6181
7.Hakiki NE(2011)Corros Sci53(9):2688–2699
8.Galvele JR,Torresi RM,Carranza RM(1990)Corros Sci31:563–571
https://www.360docs.net/doc/ed7012987.html,katos-V arsanyi M,Falkenberg F,Olefjord I(1998)Electrochim
Acta43(1–2):187–197
10.Ye W,Li Y,Wang FH(2006)Electrochim Acta51(21):4426–4432
https://www.360docs.net/doc/ed7012987.html,katos-Varsanyi M,Wegrelius L,Olefjord I(1997)J Oral
Maxillofac Implants12(3):387–398
12.Lohrengel MM(1993)Mater Sci Eng R11(6):243–294
13.Gebert A,Wolff U,John A,Eckert J,Schultz L(2001)Mater Sci Eng
A229:125–135
14.Hinderliter BR,Croll SG,Tallman DE,Su Q,Bierwagen GP(2006)
Electrochim Acta51:4504–4515
15.Pan J,Thierry D,Leygraf C(1996)Electrochim Acta41(7–8):
1143–1153
16.Mansfeld F(1990)Electrochim Acta35(10):1533–1544
17.Wallinder D,Pan J,Leygraf C,Delblanc-Bauer A(1998)Corros Sci
41(2):275–289
18.Martini EMA,Muller IL(2000)Corros Sci42(3):443–45419.Sikora E,Sidora J,Macdonald DD(1996)Electrochim Acta41(6):
783–789
20.Wang XY,Li DY(2002)Electrochim Acta47(24):3939–3947
21.Wang ZB,Tao NR,Tong WP,Lu J,Lu K(2003)Acta Mater51(14):
4319–4329
22.Balusamy T,Kumar S,Sankara Narayanan TSN(2010)Corros Sci
52(11):3826–3834
23.Zheng ZJ,Gao Y,Gui Y,Zhu M(2012)Corros Sci54:60–67W
24.Ye W,Li Y,Wang FH(2009)Electrochim Acta54:1339–1349
25.Boukamp BA(1989)Equivalent circuit(internal report CT89/214/
128).University of Twente,Enschede,Netherlands
26.MacDonald DD,McKubre MCH,Urquidi-MacDonald M(1988)
Corrosion44:2–7
27.Ismail KM,Jayaraman A,Wood TK,Earthman JC(1999)
Electrochim Acta44:4685–4692
28.Mansfeld F(1993)Analysis and interpretation of EIS data for metals
and alloys,Chapter4,Technical Report26,Solartron-Schlumberger 29.Baltat-Bazia A,Celati N,Keddam M,Takenouti H,Wiart R(1992)
Mater Sci Forum111–112:359–368
30.Rammelt U,Reinhard G(1990)Electrochim Acta35:1045–1049
31.Pan J,Thierry D,Leygraf C,Biomed J(1996)Mater Res30(3):
393–402
32.Tas NR,Mela P,Kramer T,Berenschot JW,Van Den Berg A(2003)
Nano Lett3(11):1537–1540
33.Tas NR,Haneveld J,Jansen HV,Elwenspoek M,Van Den Berg A
(2004)Appl Phys Lett85:3274–3276
34.Neirinck B,van Deursen J,Van Der Biest O,Vleugels J(2010)J Am
Ceram Soc93(9):2515–2518
35.Ahn HS,Park G,Kim JM,Kim J,Kim MH(2012)Exp Thermal
Fluid Sci42:187–195
36.Kim HD,Kim MH(2007)Appl Phys Lett91(1):014104-1-3
J Solid State Electrochem