MacAdam ellipses

15
PROTOCOL
FALL
2010
BY
MIKE WOOD
MacAdam ellipses
Due to the increasing use of solid state lighting devices, utilizing MacAdam ellipses to define the color point specification of lamps is becoming more prevalent
I’VE TALKED ABOUT MACADAM ELLIPSES in these articles more than once, and given brief descriptions about what they are and their relevance to our industry. However it’s still a topic that’s not as well or widely understood as it should be, so I believe it bears a longer exposition. MacAdam ellipses have long been used to define the color point specification of lamps, and that use is becoming even more prevalent as we move to using solid state lighting devices where the necessary evil of binning becomes an essential concept.
MacAdam ellipses provide a guideline as to how accurate the average person’s color vision is, and how good they are at distinguishing between similar colors. MacAdam ellipses, like just about all photometric topics, are not absolute measurements based on some definable physical property such as weight, length or time; instead, they are derived from statistical measurements of the vision properties of samples of the population. There are no absolutes in vision science—just comparative statistics. All we can measure is how the value of a particular parameter compares to what the average person sees.
Clearly our color vision has limits; we know that there are colors that are so close together that we cannot distinguish between them. We also know from personal experience that our ability to discriminate between colors varies depending on how good the lighting is, how saturated the colors are, and, to some extent, which particular hue we are talking about. Note that I’m not talking about color blindness here, except that we are all color-blind to some extent, but rather about the limitations of the so called normal observer.MacAdam ellipses are a relatively recent concept. David MacAdam was a color scientist working with Kodak’s research laboratory who, in the forties, conducted a series of tests to
establish the ability of test subjects to discriminate between colors. He set up experiments where the subject had to match one color against another by adjusting something very similar to the RGB or CMY controls of an automated light, and then measured how good a job they did. By getting them to attempt matching from different directions—for example, match a yellow starting with red or match the same yellow starting with green—he was able to establish zones around the target color where the user saw a range of hues as identical. He asked each subject to do this for 25 different
colors across a range of hues and saturations. These zones, when plotted on the 1931 CIE xy chromaticity color space, appear approximately as ellipses. After carrying out a number of these tests, MacAdam established that there was statistically significant similarity between the results from different subjects, and he was able to formulate an average set of the ellipses that now bear his name. Note: MacAdam didn’t actually use that many subjects in his tests, so his original data is arguably statistically weak. However subsequent repeats of the experiment by other researchers have
confirmed the data, and it is now widely accepted, or at least widely used!
Figure 1 shows the standard set of 25 MacAdam ellipses. Each ellipse contains colors that cannot be differentiated by the average observer when they are at the same luminance. MacAdam estimated that someone with normal trichromatic color vision can distinguish about seventeen thousand unique colors at each level of luminance, or about three million perceivable colors overall. (Which means that correctly scaled 8 bit RGB color control plus an intensity
channel should be more than enough to define every possible static color, even if it isn’t enough to produce glitchless cross fades!)
Figure 1 – 1-step MacAdam Ellipses plotted on the
1931 CIE color space
0.0
0.1
0.2
0.3
0.4
0.5
0.6
0.7
0.4254 0.4044
Target - MacAdam Ellipse Size -
1
F A L L 2010
16
FALL 2010
Out of the Wood | MacAdam ellipses
The original ellipses in Figure 1 are very small so you don’t usually see them published this way. They are often called 1-step ellipses where the 1-step means that they encompass 1-step of color discrimination around the center point. (Another way of defining a 1-step MacAdam ellipse is that it is the region on a chromaticity diagram that contains all the colors that are indistinguishable to the average human eye from the color at the center of the ellipse.) Instead, most of the time you’ll see MacAdam ellipses scaled up to a larger size, perhaps 7x or 10x the original. Figure 2 shows the same ellipses but now scaled up to 7-step ellipses. This means that each ellipse now represents seven times the just noticeable difference in color at its center point. That means that two points at the extremes of the ellipse are actually 14 steps away from each other.
Figure 2 – 7-step MacAdam Ellipses plotted on the
1931 CIE color space
You can now start to see some detail and differences between the ellipses. For example, when plotted on the 1931 chromaticity space like this, we see that the ellipses in the blue region are much smaller than those in the green. To some extent this shows that we are more discriminating in blue hues than green, but, although this is somewhat true, this almost is as much a result of the color space we’ve chosen to plot the results on as it is of the human eye response. However, the 1931 color space is the one everyone is most familiar with, so it makes sense to use it. I’ve also shown the Planckian locus or black body line on the diagram, and you can see that the ellipses in that area tend to be very roughly aligned such that their long axis is parallel to that locus. That means that we are less sensitive to color differences along the black body line, which equate to red/blue shift or differences in color temperature, than we are to differences across it, which equate to the green/magenta shift.
I think you’ll agree that’s true: we tolerate quite significant amounts of change in color temperature without concern whereas even a small amount of shift to the green or magenta is noticeable.Y ou might also notice that I‘ve plotted an extra, 26th, ellipse as a red dotted line. This is centered on 3200 K on the black body line and thus represents the very familiar color point of theatrical incandescent lamps. (The creation of new ellipses like this isn’t entirely proper. The data is statistical and specific, not mathematical, and doesn’t necessarily lend itself to extrapolation and interpolation. However the data is consistent and smooth enough that such mathematical constructs seem to behave well. In this case I created the new ellipse at 3200 K by extrapolating from the full set of 25 known ellipses using a 4th power weighting based on their x,y planar distance. Figures 1 and Figure 2 come for Specifications for the Chromaticity of Solid State Lighting (SSL) Products (which is a standard for white light, not colored).
0.0
0.1
0.2
0.3
0.4
0.5
0.6
0.7
0.4254 0.4044
Target - MacAdam Ellipse Size -
7
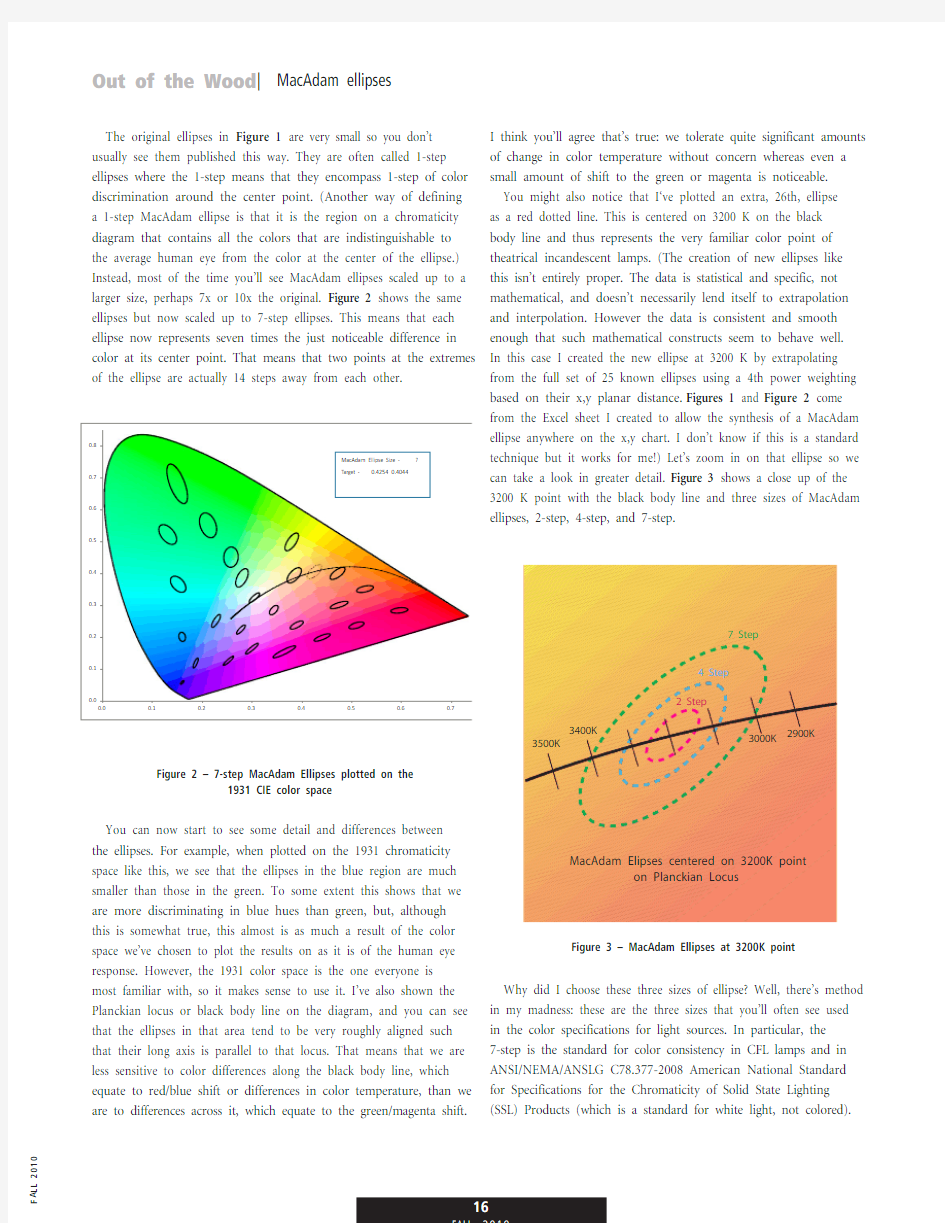
Out of the Wood | MacAdam ellipses
Looking at Figure 3 you can see that a 7-step ellipse centered on 3200 K covers a very broad area and spans a 500 K range of color temperatures from 2950 K to 3450 K. The 4-step and 2-step ellipses are tighter standards, which have been proposed by the Lighting Research Center of the Rensselaer Polytechnic Institute for use in LED luminaires, and are also standards that many light source manufacturers are already working to. The 4-step ellipse is also the standard to which many entertainment industry HID lamps, such as MSR and HMI, have been manufactured for many years. At the other extreme, we are used to working with incandescent lamps, which are extremely consistent and fall well within a 1-step ellipse. Realistically, as we look more and more at LEDs as viable light sources for entertainment use, I believe that in most cases in our industry we should strive towards the 2-step ellipse as being a good compromise that is accurate enough most of the time.
Figures 4, 5 and 6 attempt to illustrate in more detail what these color differences might look like in a real situation. In each diagram the left side of the image shows three square amber color patches, one above the other. The center one represents 3200 K light, while above and below it are patches that represent the extremes of the corresponding MacAdam ellipse. On the right of each image are three more patches showing the same light sources, but this time the 3200 K yellow has been shifted to a pure white to illustrate what they might look like after the eye has fully white adapted to the color temperature. (We don’t see 3200 K light as yellow light on a stage. We see it as white because it has become the reference point to our eyes.)
Figure 4 – White color variation at 3200 K: 7-step
Maximum color range
Maximum color range White adjusted
7 Step MacAdam Ellipse Color Variation
F A L L 2010
18
FALL 2010
Out of the Wood | MacAdam ellipses
Figure 5 – White color variation at 3200 K: 4-step
Figure 6 – White color variation at 3200K: 2-step
I don’t know how well the printing process used to produce this journal will render these color patches, but I hope that it’s good enough to at least give you an idea of the subtlety of the situation and how even a 2-step ellipse may be visible in some circumstances. While our main light sources have primarily been incandescent lamp-based we haven’t had to worry too much about their color consistency. We knew that discharge lamps varied quite a lot from batch to batch and over their life but, for many people, it wasn’t of huge concern. However, as we move into the realms of SSL and introduce further variables, such as the vagaries of LED binning, knowledge of how closely the eye can discriminate between colors and how you can measure and specify that discrimination will become increasingly important to everyone. ■
Mike Wood is President of Mike Wood Consulting LLC which provides consulting support to companies within the entertainment industry on technology strategy, R&D, standards, and Intellectual Property. A 30-year veteran of the entertainment technology industry, Mike is the Treasurer and Immediate Past President of ESTA. Mike can be reached at mike@https://www.360docs.net/doc/ec9673410.html,.
Maximum color range
Maximum color range White adjusted
4 Step MacAdam Ellipse Color Variation
Maximum color range
Maximum color range White adjusted
2 Step MacAdam Ellipse Color Variation
. . . we should strive towards the 2-step ellipse . . .
“
“
LED光源和灯具色容差测试说明
LED光源和灯具色容差测试说明 1 色容差的概念 色容差是表征被测光源X、Y值(由光电色检测系统软件计算得到)与标准光源差别的物理量。数值越小,说明被测光源越接近标准光源。 色容差单位为SDCM.GB-T17262-2002[4](单端荧光灯性能要求标准)中规定一般的节能灯要求的色容差要小于5SDCM.GB24823-2009[5](普通照明用LED模块的性能要求标准)中规定LED模块要求的色容差要小于7SDCM。 测试灯具时,一般检测设备会自动识别被测光源的色温范围,并确定对应的标准光源色温取值,从而计算出其色容差。在相同色温时,参考标准光谱一致,但色坐标X、Y不同,色容差也不同。 色容差的计算公式为: G11Δx2+2G12ΔxΔy+G22Δy2=K2SDCM(1) 式中为G11、G12、G22荧光灯发光色范围的参数,K为色容差值。各色温所对应的G 参数如表1所示。 计算时用参数乘以1000,如3000K所对应的G11为390,计算时数值为390000. 2 CFL与能源之星关于中心点的定义 目前,由于积分球关于关于色容差的中心点定义是按照CFL的中心点定义如表2所示。
但是,由于LED产品目前都参考ANSI C78.377[6]的标准(如2.1节各LED公司的色坐标分布图),其色坐标的中心点与CFL的中心点有一定的差异,能源之星对LED产品的色坐标中心点与ANSI保持一致,其坐标中心点参考表3所示。 如图1所示,粉红椭圆为CFL的在各色温段的7SDCM的容差表现,而黑色的四边形框为ANSI与能源之星对LED产品的色坐标要求,略大于7SDCM. 各LED光源厂家的色坐标分布图。 下面给出部分LED光源厂家的色坐标分布图(图2~图5)。 3 LED照明产品色容差测试修正 基于图1,由于色温段中心点的差异,即使LED的坐标点为能源之星的正中心点,但在积分球上面测试出来的色容差数值将会有较大的差异(如表4所示)。 为了修正LED光源的色容差,有以下两种方法: (1)将测试设备中色容差的中心点更改为能源之星要求的中心点,再测试读取色容差。 (2)首先通过设备测出LED光源的X、Y值,根据色容差的定义,用Excel编写其色容差的计算公式,如表5~表7所示,用于计算和评估其LED产品的色容差。 以上只给出了3000K、4000K以及6500K三个色温的计算表格,其它色温的色容差计算同理,只需将中心点改为相应数值即可。 4 结论 现有光电色测试设备都是针对传统光源(灯具)设计的,色容差按照CFL所规定的中心点计算,不适合LED光源(灯具)的测试。
从国际标准分析LED色容差
从国际标准分析LED色容差 色容差定义及麦克亚当椭圆理论 色容差:表征光色电检测系统软件计算的X、Y值与标准光源之间差别。数值越小,表示产品光色坐标和标准值越接近,光源发出的光谱与标准光谱之间的差别越小,准确度越高,光的颜色越纯正。 麦克亚当椭圆理论:1942年科学家麦克亚当利用相关原理对25种颜色进行实验,在每个颜色点大约5到9个对侧方向上测量,记录它们刚好能够分辨出颜色差异时的两点距离,结果得到的是一些面积大小各异、长短轴不等的椭圆,称为麦克亚当椭圆。麦克亚当椭圆通常用“阶”来描述,这里所说的“阶”其实就是指标准差。1阶麦克亚当椭圆指的是距离目标颜色1倍的颜色匹配结果变动的标准差,同理可知,3阶、4阶等的含义。 色容差主要标准类别 目前国内主要色容差标准主要有北美ANSI标准、IEC、欧盟标准、其对应色容差中心点归纳如下: 相关色容差对应的色温范围 行业标准水平: 1.能源之星ANSIC78.376,色容差≤7SDCM,按LED特性划分区域。 2.欧盟标准ERP,色容差≤6SDCM,按照明技术要求来规范LED划分区域。 3.国标GB10682——2002,双端荧光灯性能要求色容差≤5SDCM,可作为LED 灯色容差要求参考。 对比IEC标准和ANSI标准3阶示意图 关于色容差问题测试注意事项: 1.由图可知:IEC和ANSI两种标准中心点有差别,其中6500K、3000K、2700K 差别明显,所以下单必须先确认使用什么标准(目前同一方光电按照IEC标准测试,也可根据客户需求选择其他标准)。 2.选择对应色温段色容差中心点坐标,例如6500K色温选择2700K标准测试色容差会很大(有些机器会自动选择)。 色容差与色差的区别 色差:颜色的差异,即两个光色X、Y坐标值的差异大小,差值越小,色差越
CIE标准色度学系统
色容差是指电脑计算的配方与目标标准的相差,以单一照明光源下计算,数值愈小,准确度则愈高。但是要注意,它只代表某一光源下的颜色比较,未能检测于不同光源下的偏差。光源发出的光谱与标准光谱之间的差别。 标准光谱随着色温改变,同一个光源如果标准光谱不同其色容差也不同,但是测量的时候,一般光色电分析系统会自动识别被测光源所在的色温范围,以确定标准光谱的色温取值,色容差的单位是SDCM,一般的节能灯要求的色容差要小于5SDCM。色容差,是表征光色电检测系统软件计算的X,Y值与标准光源之间差别。数值越小,准确度越高。 标准光源的光谱随色温改变,则不同色温时,其标准光谱不同(一般检测设备会自动AUTO识别被测LED光源的色温范围,并确定对应的标准光源色温取值),色容差不同。在相同色温时,参考标准光谱一致,色坐标X,Y不同,则色容差不同。 色容差单位:SDCM。GB-T17262-2002单端荧光灯性能要求标准中规定一般的节能灯要求的色容差要小于5SDCM。GB24823-2009(已下载)普通照明用LED模块的性能要求标准中规定LED模块要求的色容差要小于7SDCM。 色容差的意义引 (1)在荧光灯中由于红、绿、蓝三种粉的密度不同,生产中很容易造成色温差,一旦出现,需通过调节色容差来调整色温差以保证灯的光色。能够显示色容差的仪器(2)作为照明光源的白光LED应当参照色容差的标准来要求指导白光LED新照明光源的发展和应用。
色容差和哪些因素有关?[1] 参照荧光灯国家标准GB/T10682-2002色容差公式: g11Δx2+2g12ΔxΔy+g22Δy2=K2 (1) 式中:Δx和Δy表示相对于目标坐标值x,y的误差,g11,g12, g22表示由各目标值决定的系数,K为色容差。标准颜色灯的色品坐标目标值应符合表D1的规定(见附录),系数见表D2。 用轴参数计算色容差的算式为:x’/K2a2+y’/K2b2=1 (2) 式中:x’=Δxcosθ+Δysinθ y’=-Δxsinθ+Δycosθ a和b分别是1SDCM的长半轴和短半轴。 附CIE1931图,详细描述见第二章: 一、CIE1931RGB 真实三原色表色系统 (一)、颜色匹配实验 把两个颜色调整到视觉相同的方法叫颜色匹配,颜色匹配实验是利用 色光加色来实现的。图5-24中左方是一块白色屏幕,上方为红R、绿G、 蓝B三原色光,下方为待配色光C,三原色光照射白屏幕的上半部,待配 色光照射白屏幕的下半部,白屏幕上下两部分用一黑挡屏隔开,由白屏幕 反射出来的光通过小孔抵达右方观察者的眼内。人眼看到的视场如图右下
电光源资料-色容差的调整对光通量的影响
稀土荧光灯的色容差调整对光通量的影响 引言 照明用稀土荧光灯具有光效高、显色性好、光色舒 适等突出优点,越来越受到人们的青睐。其使用的荧光 粉是由铕激活的氧化钇(红粉)、铈和铽激活的多铝酸 镁(绿粉)和铕激活的多铝钡镁(蓝粉)三种单色粉按不 同比例混合而成的,这三种粉的配比变化直接影响荧光 灯的光通量、光衰、色温和显色性,特别是对荧光灯的 色 容差和光通量影响相当大。 由于三种粉的密度不同(红色5. 18,绿粉4. 22,蓝 粉3. 85) ,生产中很容易造成色温差,一旦出现,需通过 调节色容差来调整色温差以保证灯的光色,而调节色容 差又会使灯的其它参量发生变化,特别是对灯的光通输 出影响较为复杂,因此在生产中合理选配三种粉的比例 和控制涂敷工艺是非常重要的。 2 实验情况及结果 一般而言,红粉、绿粉光衰较小,蓝粉光衰较大, 从中也可估计出色坐标漂移量的不同见图1,色品图 可知三种粉各自色度坐标点构成三角形决定了稀土 三基色粉能够调到的所有色温点。 实验是在保证光通量达标的前提下,根据单色 粉位置调整色容差,减少色温差,采用了国际领先水 平的三基色粉进行若干次实验, 实验结果见表1 (38W3 500k 稀土荧光粉) 。 图1 色品图 由实验可知, 1 号、2 号光通虽高,但色容差较 大,偏出国际标准值( SDCM F 5) 4号色容差小,但光 通量较低。色容差大,光通量就高,色容差小,光通 量就低。关键是看色点在色坐标中所处的区域,如 表1中4号的光通量大于5号的光通量,而4号的色 容差小于5号的色容差; 6号的光通量小于7号的光 通量,而6号的色容差大于7号的色容差。从颜色测 量结果可看出,这几号样品的色坐标点所处的位置 区域不同。如果图2中的A 区,光通量较高,色容差 应控制在该区,在此区域内尽量减小色容差,从而达 到减小色温差进而达到时维持高光通量的目的。
色容差
1色温:如果一个光源发光的颜色和一定温度的黑体(标准光源)发光的颜色相同,那么该黑体的温度就为该光源的颜色温度(简称色温Tc)。色温用绝对温标K表示。22相关色温:在人工光源中,只有白炽灯灯丝通电加热与黑体加热的情况相似。对白炽灯以外的其它人工光源的光色,其色度不一定准确地与黑体加热时的色度相同。所以只能用光源的色度与最相接近的黑体色度的色温来确定光源的色温,这样确定的色温叫相关色温。 3绝对黑体 1 定义:如果一个物体能够在任何温度下全部吸收任何波长的辐射,那么这个物体称为绝对黑体。 2 特性:绝对黑体能够将落在其上的所有热量吸收,而没有损失,同时又能够将热量生成的能量全部以“光”的形式释放出来的话,它便会因受到热力的高低而变成不同的颜色。 4绝对黑体为理想状态下的物体。绝对黑体的吸收本领是一切物体中最大的,加热时它辐射本领也最大。 5 1 显色指数:我们如果用光谱功率分布不同的光源去照明物体,一般来说,产生的颜 色感觉是不一样的。光源的这种决定被照物体颜色感觉的性质称为显色指数。显色指数是照明光源的重要特征之一。 6 2 白炽灯的显色指数定义为100,视为理想的基准光源。此系统以8种彩度中等的标 准色样来检验,比较在测试光源下与在同色温的基准下此8色的偏离(Deviation)程度,以测量该光源的显色指数。 7二CIE1931 色度图 8 1 在曲线所包围的面积内包括了一切物理上能实现的所有颜色。在这当中,有一条弯 曲的曲线,它代表各种温度下黑体辐射的x,y值的轨迹。 9 2 X轴色度坐标相当于红基色的比例;Y轴色度坐标相当于绿基色的比例。 10 3 舌形曲线代表单色光位置。 11 4 同时,在此图中也准确的表示了颜色视觉的基本规律以及颜色混合的一般规律