生产良率系统统计表
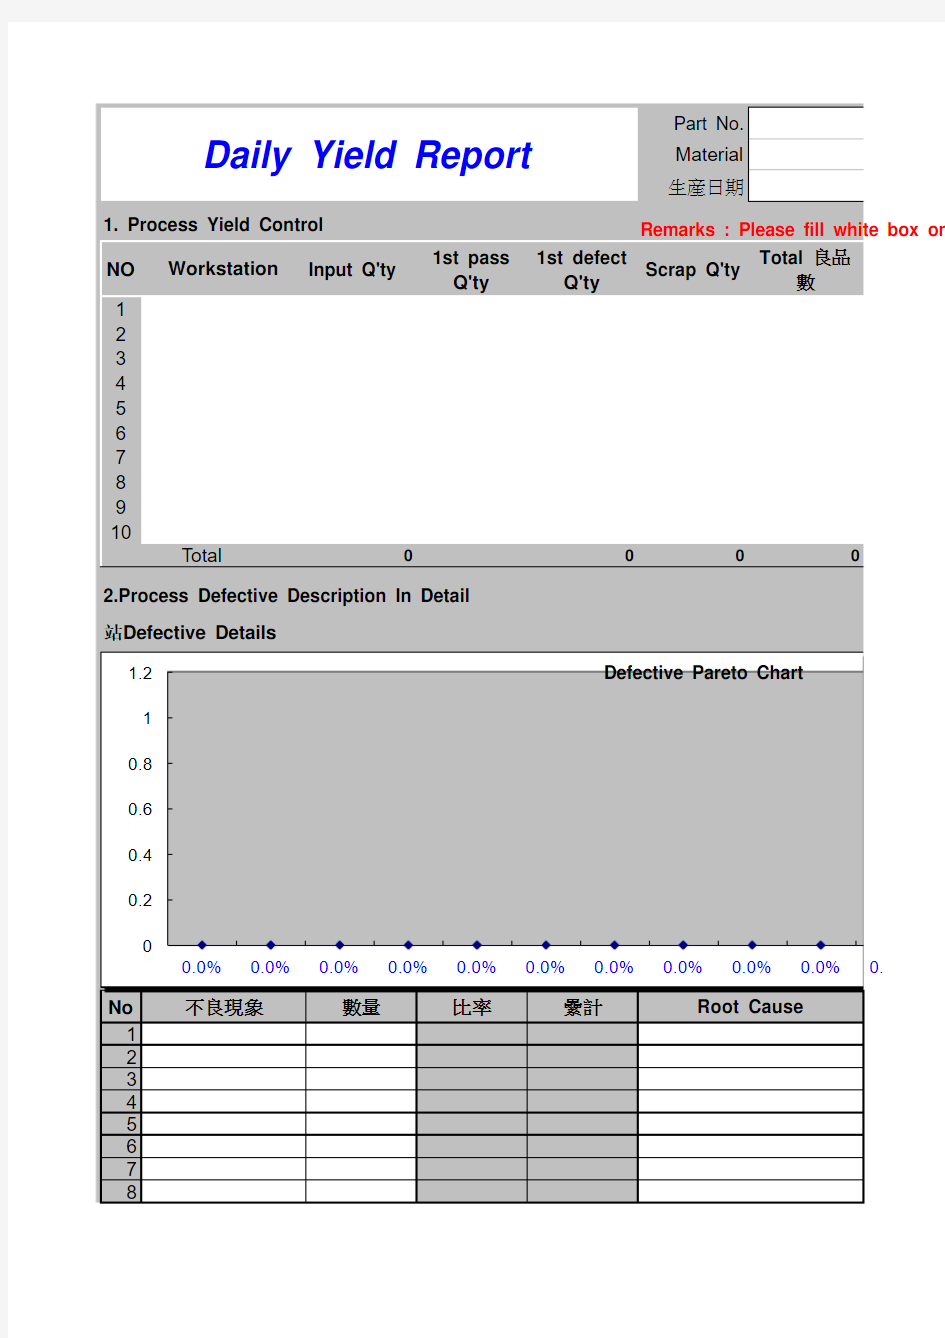
Part No.
Material 生産日期
1. Process Yield Control Remarks : Please fill white box onl
NO Input Q'ty
1st pass Q'ty
1st defect Q'ty Scrap Q'ty
Total 良品
數
12345678910
00
2.Process Defective Description In Detail 站Defective Details
No
數量比率纍計12345678
不良現象Total
Workstation Root Cause
Daily Yield Report
0.0%0.0%0.0%0.0%0.0%0.0%0.0%0.0%0.0%0.0%0
0.20.40.60.811.2D e f e c t i v e Q 't y Defective Pareto Chart
9101112131415
00
站Defective Details
No 數量比率纍計123456789101112131415
00
站Defective Details
Total
不良現象Total
Root Cause
0.0%
0.0%
0.0%
0.0%
0.0%
0.0%
0.0%
0.0%
0.0%
0.0%
0.
0.20.40.6
0.811.2D e f e c t i v e Q 't y Defective Pareto Chart
1
1.2Defective Pareto Chart
No 數量比率纍計12345678910678910
00
站Defective Details
No 數量比率纍計Total
不良現象不良現象Root Cause
Root Cause
0.0%0.0%0.0%0.0%0.0%0.0%0.0%0.0%0.0%0.0%0.
0.20.40.60.8
1D e f e c t i v e Q 't y
0.0%0.0%0.0%0.0%0.0%0.0%0.0%0.0%0.0%0.0%0.
0.20.40.60.8
11.2D e f e c t i v e Q 't y
Defective Pareto Chart
23456789101112131415
00
站Defective Details
No 數量比率纍計12345678910111213
Total
不良現象Root Cause
0.0%
0.0%
0.0%
0.0%
0.0%
0.0%
0.0%
0.0%
0.0%
0.0%
0.
0.2
0.40.60.81
1.2D e f e c t i v e Q 't y Defective Pareto Chart
15
00
站Defective Details
No 數量比率纍計123456789101112131415
00
站Defective Details
Total
Total
不良現象Root Cause
0.0%
0.0%
0.0%
0.0%
0.0%
0.0%
0.0%
0.0%
0.0%
0.0%
0.
0.20.4
0.60.811.2
D e f e c t i v e Q 't y Defective Pareto Chart
0.6
0.811.2
i v e Q 't y Defective Pareto Chart
No 數量比率纍計123456789101112131415
00
站Defective Details
No 數量比率纍計12345
Total
不良現象不良現象Root Cause
Root Cause
0.0%
0.0%
0.0%
0.0%
0.0%
0.0%
0.0%
0.0%
0.0%
0.0%
0.
0.20.4D e f e c t i v
0.0%
0.0%
0.0%
0.0%
0.0%
0.0%
0.0%
0.0%
0.0%
0.0%
0.
0.20.40.6
0.811.2
D e f e c t i v e Q 't y Defective Pareto Chart
6789101112131415
00
站Defective Details
No 數量比率纍計123456789101112131415
00
站Defective Details
Total
不良現象Total
Root Cause
0.0%0.0%0.0%0.0%0.0%0.0%0.0%0.0%0.0%0.0%0.
0.20.40.60.8
11.2D e f e c t i v e Q 't y
Defective Pareto Chart
No 數量比率纍計123456789101112131415
00
Total 不良現象Root Cause
0.0%0.0%0.0%0.0%0.0%0.0%0.0%0.0%0.0%0.0%0.
0.20.40.60.8
11.2D e f e c t i v e Q 't y
Defective Pareto Chart
Work Order:Material Lot No.
white box only.
1st Pass Yield (直通率)Final Yield
100.00%
100.00%100.00%100.00%100.00%100.00%100.00%100.00%100.00%100.00%100.00%100.00%100.00%100.00%100.00%100.00%100.00%100.00%100.00%
100.00%100.00%
100.00%
Due day Owner
Corrective Action 0.0%
0.0%
0.0%
0.0%
0.0%
0.0%
25.0%
50.0%
75.0%
100.0%
D e f e c t i v e R a t e
Due day Owner
Corrective Action 0.0%
0.0%
0.0%
0.0%
0.0%
0.0%
25.0%
50.0%
75.0%
100.0%
D e f e c t i v e R a t e
100.0%
Due day Owner
Due day Owner
Corrective Action Corrective Action 0.0%
0.0%
0.0%
0.0%
0.0%
0.0%
25.0%
50.0%
75.0%
D e f e c t i v e R a t e
0.0%0.0%0.0%0.0%0.0%
0.0%
25.0%
50.0%
75.0%
100.0%
D e f e c t i v e R a t e
Due day Owner 12.28
Corrective Action
0.0%0.0%0.0%0.0%0.0%
0.0%
25.0%
50.0%
75.0%
100.0%
D e f e c t i v e R a t e
Due day Owner
Corrective Action 0.0%
0.0%
0.0%
0.0%
0.0%
0.0%
25.0%
50.0%
75.0%
100.0%
D e f e c t i v e R a t e 50.0%
75.0%
100.0%
i v e R a t e
Due day Owner
Due day Owner
Corrective Action Corrective Action 0.0%
0.0%
0.0%
0.0%
0.0%
0.0%
25.0%
D e f e c t i v
0.0%
0.0%
0.0%
0.0%
0.0%
0.0%
25.0%
50.0%
75.0%
100.0%
D e f e c t i v e R a t e
0.0%0.0%0.0%0.0%0.0%0.0% 25.0% 50.0% 75.0% 100.0%
D
e
f
e
c
t
i
v
e
R
a
t
e
Due day Owner Corrective Action
0.0%0.0%0.0%0.0%0.0%0.0% 25.0% 50.0% 75.0% 100.0%
D
e
f
e
c
t
i
v
e
R
a
t
e
Due day Owner Corrective Action