图表作文四六级
图表作文的题型
一、根据表格作文
Writing Task 1
You should spend about 20 minutes on this task.
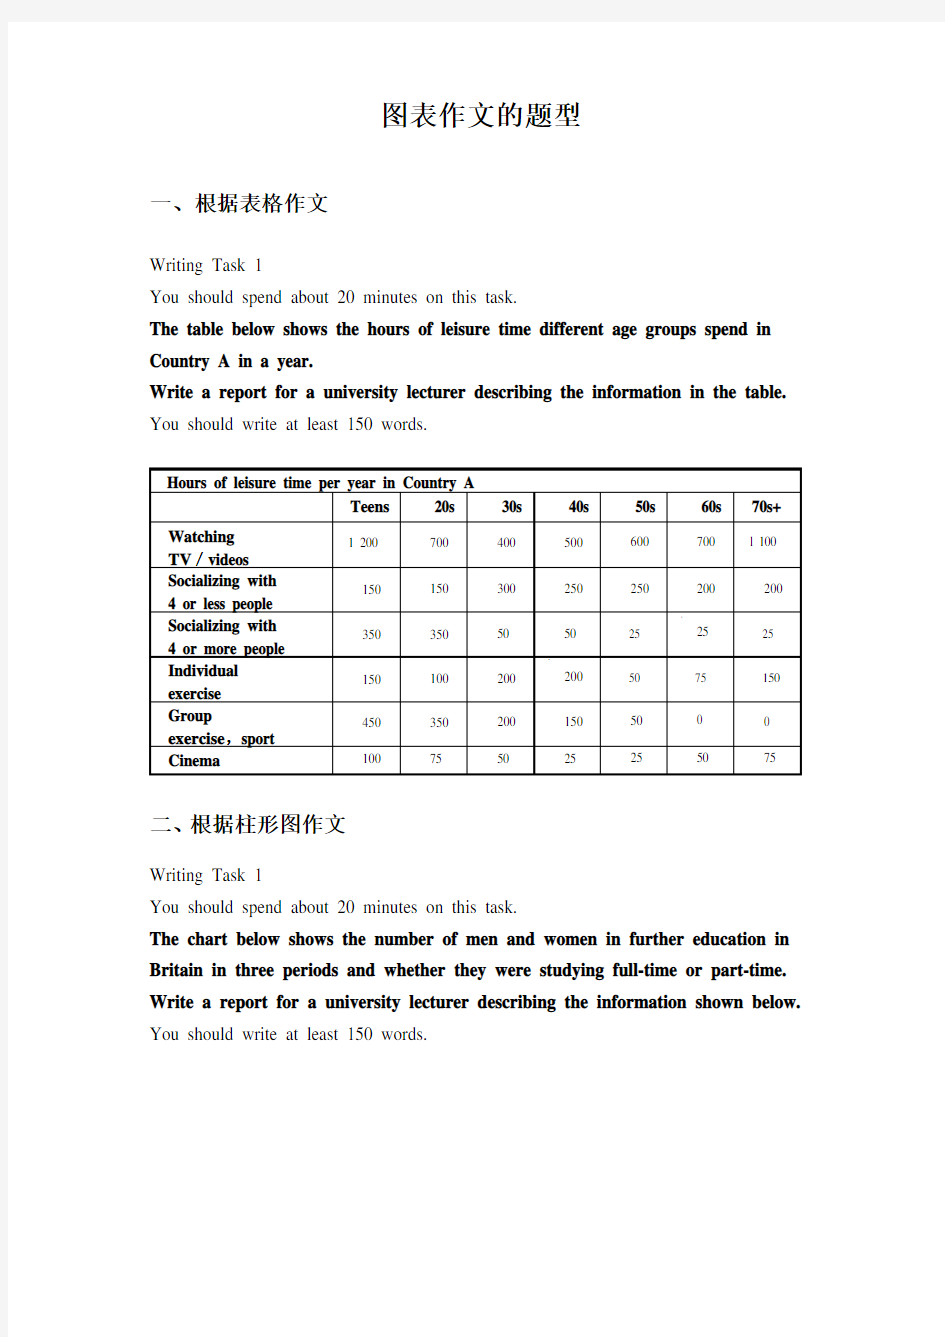
The table below shows the hours of leisure time different age groups spend in Country A in a year.
Write a report for a university lecturer describing the information in the table. You should write at least 150 words.
二、根据柱形图作文
Writing Task 1
You should spend about 20 minutes on this task.
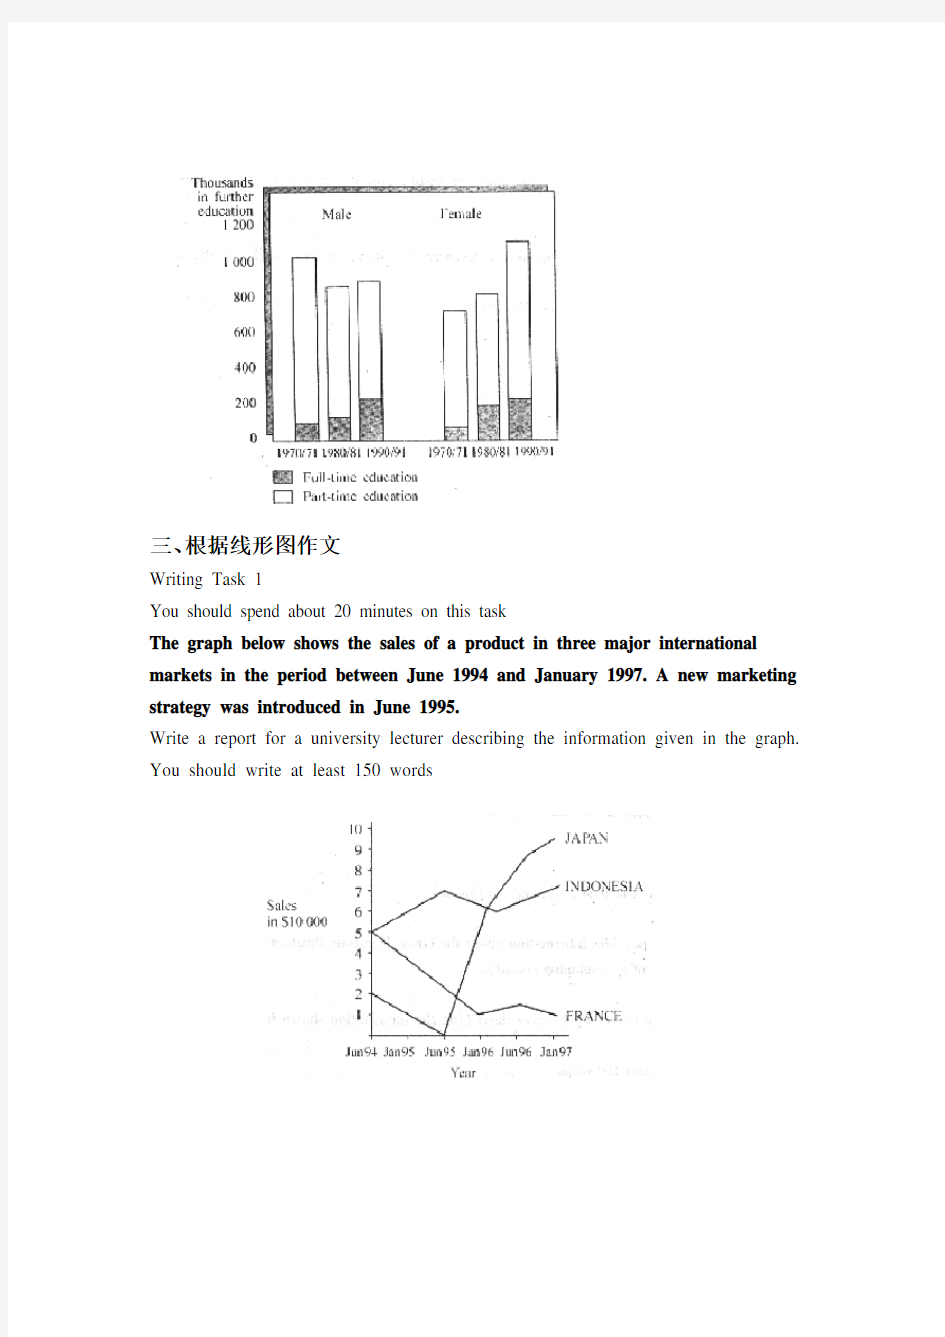
The chart below shows the number of men and women in further education in Britain in three periods and whether they were studying full-time or part-time. Write a report for a university lecturer describing the information shown below. You should write at least 150 words.
三、根据线形图作文
Writing Task 1
You should spend about 20 minutes on this task
The graph below shows the sales of a product in three major international markets in the period between June 1994 and January 1997. A new marketing strategy was introduced in June 1995.
Write a report for a university lecturer describing the information given in the graph. You should write at least 150 words
四、根据饼形图作文
Writing Task 1
You should spend about 20 minutes on this task.
The following two graphs display the workforce distribution in 1932 and 1992 in Great Britain. Write a report for a university lecturer describing the information given in the diagram.
You should write at least 150 words.
五、混合型作文(根据几类图形作文)
Writing Task 1
You should spend no more than 20 minutes on this task.
The diagram below provides information about the Gross Domestic Product (GDP) in 1992 and employment sectors of a developing country.
Write a report for a university lecturer describing the information shown in the diagram.
You should write at least 150 words.
评分标准
一、任务完成情况(Task Fulfilment)
二、连贯和衔接(Coherence and Cohesion)
三、词汇与句子结构(Vocabulary and Sentence Structure)
图表作文的篇章结构
如前所述,图表作文明确要求考生根据图表所提供的信息写一份报告。因此,考生的作文应该具有报告的篇章结构。通常包括引言、主体段落和结论3个部分。各段落之间以及段落内部各句子之间需要恰当地使用各种衔接手段,使整篇文章结构清晰、层次分明、浑然一体。
引言部分
引言部分一般由两部分构成。第一部分为背景综述,交代图表研究的对象和时间,这一部分实际上可以根据考题文字指令,结合图表标题和标注内容改写而成。第二部分为点题,概括图表所呈现的趋势。
主体段落
主体段落具体描述图表信息。充分描述图表信息并不意味着要对所有的数据逐一描写,而应该选择具有典型特征的数据进行描述,在描述数据的过程中往往需要对典型特征数据进行比较。
在数据很多的情况之下,应该首先对数据进行分类,然后总结出每一类数据所体现的趋势。一般情况下,每一种趋势写成一个自然段。每一个自然段应该有两大部分组成。首先是段落主题句,即用一句话概括趋势,这句话应该具有一定的概括性,一般不涉及具体的数据。然后是分述,用具体数据说明趋势。
结论部分
对主体段落已经讨论过的各个单方面趋势或者特征进行总的概括:结论部分不再涉及具体的数据。国外部分雅思教材强调图表题作文不需要有一个单独的结论。这种看法有一定的道理,因为结论部分的内容和引言部分的第二句话的内容基本相同。但是,从文章整体结构考虑,一份报告如果没有一个结沦就显得不够完整。因此,我们建议考生们在写作图表作文时还是包括一个结论段落。但需要特别注意的是,结论部分只是对主体段落已经讨论过的各个单方面趋势或者特征进行客观地概括,不要凭借自己的主观想象发表个人的观点。另外,还要注意语言上应尽量避免与上文完全重复,虽然结论和点题在内容上基本相同,但是在语言上需要有变化。
Sample Topic
You should spend about 20 minutes on this task.
The bar chart below shows the number of complaints made by consumers about different types of products and services in the years 1999 and 2002.
Write a short report for a university lecturer describing the information in the graph.
You should write at least 150 words.
范文
The bar chart illustrates the changes in the number of complaints made by consumers about five selected products and services in 1999 and 2002. According to the diagram, there was an increase in the complaints about all the products and services except for clothing.
The number of complaints about package holidays abroad and financial services increased over the period. The complaints made about the package holidays abroad rose by 12.7% from 13 000 in 1999 to about 15 000 in 2002. And there were about 52 000 complaints about the financial services in 2002, 5.2 % up in 1999.
There were also more complaints about electric goods and second-hand cars in 2002 than in 1999. The complaints about the two products rose by 9.2% and 6.7% respectively. The former increased from 66 000 in 1999 to about 72 000 in 2002 and the latter went up from 80 000 to about 86 000. And clothing is the only sector where the number of complaints dropped over the period. In 1999, there were around 42 000 complaints while the figure decreased by 4% to around 40000 in 2002.
In conclusion we can see there were more complaints about the products and services in 2002 than in 1999 with the only exception of clothing.
详解
引言部分
范文第一段根据题目的文字说明和图表横坐标、纵坐标以及标注所提供的信息,用一句话交代清楚图表研究的对象和研究所发生的时间段:
The bar chart illustrates the changes in the number of complaints made by
consumers about five selected products and services in 1999 and 2002.
接着用一句话综述图表所呈现的趋势:
According to the diagram, there was an increase in the complaints about all the products and services except for clothing.
主体段落
通过观察图表,我们把5种数据分成两大类,即对于服务(services)的投诉和对于产品(products)的投诉。通过观察发现关于服务(即package holidays abroad和financial services)的投诉从1999年到2002年增加了。关于产品的投诉,又存在两种情况,对于electric goods和second-hand cars的投诉增加了,而clothing行业的投诉下降了。文章主体部分采用两个自然段,分别描述两大类数据。
第二自然段的第一句话概括趋势:
The number of complaints about package holidays abroad and financial services increased over the period,...
第三自然段有两句话概括两种不同的趋势,分布于该段的段首和段中:There were also more complaints about electric goods and second-hand cars in 2002 titan in 1999.
... And clothing is the only sector where the number of complaints dropped over the period. ...
图表作文仅有对趋势的概括是远远不够的,还需要有来自图表的数据作为支持。选用典型数据充实上述两个段落中的省略号部分,就形成了完整的主体段落。
结论部分
最后,对主体段落已经讨论过的各个单方面趋势进行总的概括。本文主体段落已经讨论过的单方面趋势为:
The number of complaints about package holidays abroad and financial services increased over the period,...
There were also more complaints about electric goods and second-hand cars in 2002 than in 1999.
... And clothing is the only sector where the number of complaints dropped over the period
对以上单方面趋势进行概括,作为报告的结论:
In conclusion we can see there were more complaints about the products arid services in 2002 than in 1999 with the only exception of clothing.
注意:这句话与引言部分的有关趋势的概括要有所区别,不可以完全重复。
事实上,本文已经达到150字,引言部分和主体段落已经总结了数据反映的趋势,而且文章已有3个自然段,因此结论部分略去不写是完全可以的。
图表作文常用语言手段
一、表示“出处”的句子结构
在图表作文中(尤其是在文章的引言部分)需要说明数据和信息的来源,如:The table shows the estimated number of visitors to the UK between 1982 and 1987. As can be seen from the table, there was an 85 percent increase in real expenditure during this period.
上述两例中的划线部分表明了信息的来源。类似的结构还有很多,现归纳如下:
需要强调的是,以上结构在同一篇图表作文中使用不宜过多,而且需要尽量避免不必要的重复。
二、描述“数据变化”的常用表达方式
1.表示变化的动词和名词
注:在描述“增长”趋势时,有两种结构可供选用:
(1) Sales increased in the first quarter.
注:在描述“下降”趋势时,有两种结构可供选用:
(1) Unemployment levels fell.
(2) There was a fall in unemployment levels.
2.表示变化的形容词和副词
在描述“增加”、“下降”以及“波动”等变化时,需要根据具体情况恰当地使用表示变化程度和速度的形容词或副词。例如:
There has been a slight increase in the value of the dollar. [形容词slight 表示变化的程度]
Unemployment fell rapidly last year. [副词rapidly 表示变化的速度]
1)描述变化程度的形容词和副词:
2)表示变化速度的形容词和副词:
三、描述“数据”的表达方式
percent percentage proportion proportional a/one quarter of a/one third of a/one half of
two thirds of three quarters of
as many…as as much…as the same…as
四、“大约”的表达方式
roughly/about/around/approximately/nearly
六级之图表作文
六级之图表作文 Prepared on 22 November 2020
图表作文图表是科学文献中常用的一种表达手段。四六级图表作文利用图形(figure)、表格(table)、曲线图(graph)、柱状图(pie chart)和饼状图(pie chart)等作为写作提示,并以此为依据要求用简洁生动的语言把图标中所给出的信息完整而准确地表达出来。 这一类作文通常前半部分说明图标所表达的信息,后半部分进行议论,不论以何种方式出现,图标作文还是遵循一定的模式。最常见的模式是:第一段:描述现状。简要地描述图表,概括图表所表现的社会问题。第二段:分析原因。剖析图表所反映的深层次问题。用图表来论证第一段提出的主题,或者分析各个数据产生的原因。第三段:结论和启示。从图表中所体现的现象获得结论或者启示,或者对图标所表现的趋势加以预测。 图表作文模式 ①As is shown/depicted/described in the picture/chart, 概括图表内容。②For one thing, 支持这一内容的一个方面。③For another, 支持这一内容的另外一个方面。④It is obvious that 图表所反映的内容。 ⑤Many remarkable factors contribute to主题。⑥First of all, 理由一。⑦In addition, 理由二。⑧Thirdly,理由三。 ⑨Considering all these, I believe that我的看法或偏好。⑩First of all, 个人看法的依据一。⑾Furthermore, 个人看法的依据二。⑿Therefore, 个人的结论或文章的结论。 Example As is shown in the chart, the number of Chinese people traveling abroad increased gradually. For one thing, in 2001, the number of people traveling abroad was seven point five million, which was increased to ten million in 2002. For another, in 2003, there were twelve point one million Chinese people traveling abroad. It is obvious that China is witnessing an ever prosperous overseas tourism. The reasons of the increase lie in several aspects.First of all, with the implementation of China’s reform and opening policy, china’s economy has been growing rapidly and steadily. In addition, people’s income has increased tremendously, so more and more people are now eager to see the outside world with their own eyes. Thirdly, the Chinese government has been simplifying the formalities of traveling abroad and has opened more overseas tourist destinations.
四六级图表作文
四六级图表作文 一图表作文分类 1.1根据图形, 图表作文表示可以分为:柱状图,曲线图,饼状图,表格等等。Chart /graph可表示所有表格类型。 另:各种图表又有专门表达, 柱状图:bar chart 曲线图:line chart 饼状图:pie chart 1.2根据图表描述方式,可将其分为: 1.2.1 时间区间内,事物变化描述型 1.2.2 局部所占比例描述型 (举例说明:见下文) 1.3根据内容提纲,可将其分为: 1.3.1 描述+原因(说明)+趋势 1.3.2 描述+原因(说明)+个人观点、情况 即整体+个体 1.3.3 描述+原因(说明)+后果(描述)+结论 二图表作文的制胜秘笈: 对于图表的描述是图表作文的关键。要把握以下三点: 所谓精确,数据描述要精确,具体体现在,对约数的恰当运用上,以及对程度副词的运用上。 所谓简洁,即描述过程中要尽量避免重复,善于运用省略。 所谓概括,即描述要能概括、总结出事物变化的整体趋势和事物的特征。 谨记:既要看到局部又要有全局的高度。 分析方法包括:量化分析和感性分析。 量化分析:简单数学运算,加减乘除。 增长、减少了(差值计算) double v. 翻番,是…两倍,加倍 triple v. 增至三倍,是…三倍 (倍数计算) 感性分析:一方胜过、超出另一方。 outweigh, exceed, surpass,more than, less than
三图表描述常用语 由图表看出: As is shown/indicated/illustrated by the figure/percentage in the chart/diagram/table/graph/pie, the number of … From the chart, we can see clearly that … Seen from the chart, … The chart illustrates/ indicates/shows… 呈上升或下降趋势,… ______ has been on rise/decrease. ______ goes up/ increases/drops/declines 变化程度副词: steadily平稳地 sharply/dramatically/unexpectedly/significantly急剧地,突然地 约数的表达: about/around/nearly/approximately/ less than/ more than/ no less than/ no more than 局部所占的比例是: account for/ make up 1.两个时间点内的变化 作文题目:Health Gains in Developing Countries During the period from 1960 to 1990, the life expectancy of developing countries rose from 40 years to [nearly]表达精确60 years,while infant mortality decreased from 200 deaths per 1000 births to [around] 100. 通过使用rise, decrease,说明了发展中国家的期望寿命的上升趋势和婴儿死亡率的下降趋势,While 则体现出两种对立的趋势。 作文题:Film Is Giving Way to TV During the period between 1975 and 1985, film-goers declined [abruptly]陡然地,突然地,出其不意地from 85 000 to [about] 12 000, while TV-watchers increased [sharply]急剧地from 5000 to [more than] 100 000. 2.多个时间区间 一般是3-4个时间区间。 描述中要点明事物变化的总趋势;尽量体现出每一时间点的数值,并对数据加以分析(量化或感性分析)。 例如:Changes in the Ownership of Houses
英语四六级写作作文模板
作文模版: 图画图表作文 As is shown in the picture,… According to the information conveyed by the picture, … The picture also implies that … It is clear that … There are at least two good reasons for … On the one hand, … Let′s have an example to illustrate … On the other hand, …is due to the fact that … In addition, …is responsible for … Maybe there are some other reasons to show … But it is generally believed that the above mentioned reasons are commonly acceptable. The suggestion as to the best way to cope with the problem is as follows. In the first place, … Moreover, …Last but not the least it is … As far I am concerned, …… I am sure my opinion is both sound and well-grounded.(139words) 议论文(I) It is generally believed that …is a hot topic which is widely talked about both at home and abroad. Now our government attaches great importance to solving this problem. Scientists in this field have put forward a number of suggestions tending to relieve it. To begin with, we should …Furthermore, … It is clear that … People, however, differ in their opinions on this matter. Some people think that … According to them, all of us should … Other argue that …In their opinion, nobody can …without … There is no doubt that … As a consequence, … In short, I firmly support the view that … It is because … So my conclusion is that … (107words) 议论文(II) There is no denying the fact that …is a popular topic which is much talked about not only by …, but also by … It is generally thought that … The reasons for … are as follows. T o begin with, … Secondly,… Therefore, we should attach great significance to solving the problem. There are, I think, at least two possible ways to cope with it. The first way to tackle it is to appeal to the authorities to take drastic measures to (do) …The other policy that is worth adopting is to work out new regulations to (do) …Only in this way can we succeed in dealing with the problem in the near future. To conclude, it seems obvious that … So the prospect we are looking
【大学英语四六级考试】2020年7月英语四级看图作文万能模板
2020年7月英语四级看图作文万能模 板 【本文概要】不做“说话的巨人,行动的矮子”。说再多的漂亮话,也不如做一件实实在在的漂亮事,行动永远是迈向成功的第一步,想永远只会在原地踏步。对于考试而言亦是如此,每天进步一点点,基础扎实一点点,通过考试就会更容易一点点。以下为“2020年7月英语四级看图作文万能模板”,!更多相关讯息请关注本文! 【篇一】2020年7月英语四级看图作文万能模板 第一段:描述图画 1、As is vividly shown in the picture( 如果两个的话用pictures,也可以用drawing,同样的如果两个的话用drawings,如果是图表则用table,两个图表则用tables) above, 图画的内容。The picture( 如果两个的话用pictures,也可以用drawing,同样的如果两个的话用drawings,如果是图表则用table,两个图表则用tables) tells
( 注意,如果是前面的图画是复数,则用tell) us that 这个图片的大致反映的意思。 2、Recent years people in 地名(比如中国、北京、美国等等)have witnessed the fact that 描述 图片里的现象,And it is very common/usual to see that in recent years. 第二段:解释,说明和分析图片 1、The implied meaning of the picture(注意,同上进行单复数的处理) should be taken into account seriously. First/To begin with, 揭示涵义/原因/结果1,Second/What’s more, 揭示涵义/原因/结果2。Last but not least/Finally, 揭示涵义/愿意/结果3(如果有的话)。And the social problem(如果是现象的话可以用phenomenon) has arisen the great concern/care of our whole society/world/all the people. 2、There may/might be three(也可以是两个) factors which contribute to/are responsible for/explain/can make clear the 图片解释的现象。First of all, 原因1。And then the second reason is that 原因
历年四六级考试作文题目大汇总
历年四六级考试作文题目大汇总 1991年6月CET作文题目 四级作文题: Directions:For this part,you are allowed30minutes to write a composition of no less than100words on Changes in People's Diet. Study the following table carefully and your composition must be based on the information given in the table.Write three paragraphs to: 1.state the changes in people's diet(饮食)in the past five years; 2.give possible reasons for the changes. 3.draw your own conclusions. 4.you should quote as few figures as possible. Food Year19861987198819891990 Grain49%47%46.5%45%45% Milk10%11%11%12%13% Meet17%20%22.5%23%21% Fruit and vegetables24%22%20%20%21% Total100%100%100%100%100% Changes in People's Diet 六级作文题: Directions:for this part,you are allowed30minutes to write a composition based on the graph below. Outline: 1.Rise and fall of the rate of car accident as indicated by the graph; 2.Possible reason(s)for the decline of car accidents in the city;
英语四六级图表作文范文
5、图表作文:人口快速增长带来的问题 Directions: A. Study the following graphs carefully and write an essay in at least 150 words. B. Your essay should cover these points; 1. effect of the country's growing human population in its wildlife 2. possible reasons for the effect 3. your suggestion for wildlife protection (15 points) 【参考范文】the ups and downs of population growth As is seen from the two graphs, it is clear that with the rapid growth of U.S. population from 1800 to 1990, the number of its wildlife species no longer existing soared during the same period. Naturally, we can draw the conclusion that the sharp decline of wildlife species resulted from the population growth. Two reasons may account for this phenomenon. To begin with, as the population grows, people consume much more natural resources, which often leads to excessive hunting. Second, with the increase of human activities, modern people take up more and more space. Which has a great impact on other species. Finally, the problem of pollution becomes more and more serious with the development of modern industry. More and more animals have to adapt themselves to the decaying environment or move to a totally different place, but not all of them are fortunate enough to survive the changes. Solving this problem calls for, above all, the government’s efforts to control population growth, to decrease industrial pollution and to enhance the laws to forbid wildlife hunting. Moreover, common citizens should be aware of this ecological crisis and take on the responsibility of wildlife protection. In a word, only when the government and the common people make joint e f forts can we hope to find a satisfactory solution to this problem. 6、图表作文:居民日常生活花消表 Study the following table carefully and write an essay of at least 150 words. Your essay must be written on Answer Sheet? Your essay should meet the requirements below. 1. Changes in people' s daily expenses in the past five years 2. Give possible reasons for the changes. 3. Draw my own conclusions [参考范文] In the past five years, there have been great changes in people’s daily expenses in XX city. According to the figures given in the table, the amount of money spent on food decreased gradually, accounting for 35 per cent in 1998. However, there was a rapid increase in clothing expenses, which made up 17% in 1998. In addition, the table shows an upward tendency in recreation expenses. The same was the case with other expenses. What caused these remarkable changes? In my opinion, there are at least three good reasons.
英语六级作文图表题
1.大学生心理问题Directions: Write an essay of 160~200 words based on the following bar chart. In your essay, you should 1)first describe the bar chart, 2)then interpret its meaning, and 3)give your comment on it. You should write neatly on ANSWER SHEET 2. (20 points) 话题剖析 如图所示,有一个大时钟,年轻人试图把指针向前推,而老人则尝试把指针向后推,他们累的满头大汗,却都徒劳无功。年轻人之所以要向前推是因为他对未来充满好奇,老人则是希望回到过去,但是时间是不会加快也不会变慢的。该图的寓意是我们应该充实的过好现在的每一天,珍惜现在的时间,这样才不会在年老时后悔。在论证中,可以从以下角度来考虑:时间不以人的意志向前或者倒退,年轻时应该如何充分利用宝贵时间,因为只有珍惜时间的人才会有更大的机会获得成功,才能充分实现人生的价值。 参考范文(196 words) As is apparently portrayed in the bar chart above, at present university students suffer from psychological problems of various kinds, among which spiritual depression, miscellaneous problems, and suicide-committing top the list. What the chart reveals is indeed thought-provoking.
2014年12月大学英语四级作文范文:图表图画型
2014年12月四级作文范文:图表图画型 (共四篇) 一 2014年12月英语四六级作文 图表图画型范文(一):Traveling Abroad 四级作文题目:Traveling Abroad It can be seen from the chart that there have been sharp increases in the number of people traveling abroad in City X in the past decade. As the chart shows, the year 1995 witnessed only about 10,000 people from this city touring abroad. In 2000, the number soared to nearly 40,000. Last year, more than 120,000 people in the city chose to spend their vacations outside China. A number of factors account for the change in the chart, but the following are the most critical ones. First, thanks to the policy of reform and opening-up, the nation's economy has been developing at a considerably high speed in the past decades. Therefore, the people have more extra money for traveling. Secondly, other relevant state policies and the boom of touring industry provide citizens with more opportunities to go out and see the world. Last but not least, people have attached greater importance to the quality of life, thus they spend more money and time traveling and sight-seeing. In a word, this chart is a perfect indicator of China's fast expanding economy and people's rising standard of life. The trend of traveling abroad will further stimulate the development of our economy and broaden people's horizons.
英语四六级图表作文
Directions: For this part, you are allowed 30 minutes to write a short essay entitled Regular Letter Is Giving Way to E-mail . You should write at least 120 words, and base on your composition on the chart and the outline given below . Number of People (In Thousands) 50 100 150 200 250 199819992000200120022003200420052006 1. 根据上图描述某市市民使用平信以及E-mail 的人数变化 情况 2.分析产生这些变化的原因 3.你认为传统平信会消失吗? Regular Letter Is Giving Way to E-mail . As is clearly shown in the graph, regular letter is giving way to E-mail during the past 9 years. Especially the recent 4 years saw great increase in the number of e-mail users. Meanwhile, the number of people who write regular letters dropped steadily year by year. A number of factors could contribute to the changes. To begin with, with the development of the economy, computer has become a commonplace nowadays. They have changed people ’s life and work in considerable ways . Of course, the way of communication is no exception . In an efficiency-oriented world, great importance is attached to speed. In this respect , the regular letter is no match for e-mail. It only takes a few seconds for your e-mail to arrive at its destination. While for regular letters, days even weeks have to be spent on the way. Besides, e-mail is easy to operate. With an internet-connected computer, one can send or check e-mails anytime anywhere. It is true that e-mails are less time-consuming and more efficient. But it does not mean people will give up regular letters. Compared with e-mails, regular letters involve more personal emotion which can draw people closer. In a word, I don’t think regular letters will be substituted by e-mails totally. 图表题型主要分类: 1) 曲线图题型—graph, line chart 2) 饼状图题型—pie chart 3) 柱状图题型—bar chart 4) 表格图题型—table 图表描述应注意的问题: 1) 要突出重点,抓住图表中的极端点,如最大或最小,最多或最少,最好和最差,基 本相同之处等。
英语四六级文章模板
1正反论证型文章 表现形式:有人认为。。。;有人认为。。。;我的看法。。。; 作文模板 开头: Now people in growing numbers are beginning to realize that ... There is a general discussion today about the issue of ... Recently, it has become the focus of the society. 中间: People who like ... have their reasons. First of all, ... In the second place, ... There fore ... But others may not agree. People who dislike ... have their reasons, too. Firstly, ... in addition, ... So ... 结尾: To my point, I think both of them have somthing right. It is high time that we placed great emphasis on ... There is little doubt that further attention must be paid to the issue. 2原因现象型文章 表现形式:热点现象;出现的原因;你的看法; 作文模板 开头; Now people in growing numbers are beginning to realize that ... There is a general discussion today about the issue of ... Recently, it has become the focus of the society. 中间:
最新英语四六级图表图画作文模板教学内容
四六级图表图画作文写作思路、模板与范文 图画作文写作思路是固定的:描述图片、阐明观点、给出建议。 第一段,重点描述图画内容。对图画内容的描述可以用图画中人物的对话。 简要描述即可,不用发散或挖掘。也就意味着,事实上你若看不懂图画中的某些文字,其实没关系,照抄就好。 第二段,阐明观点。观点在题干中往往会给得很清楚,这就说明仔细审清题干比看懂图画中的对话更重要。阐明观点之后的思路与一般的四六级提纲型写 作一致:可以先举例说明现象、然后再探讨导致现象的原因以及该现象可能导致 的影响等。 末段,除了总结观点外,一般还可以提出建议。这段的写法无论是图画、图 表还是提纲写作,都差别不大。 图画作文模板: It seems to me that the cartoon / drawing is sending a message about ____________(图画内容),which reveals ____________(稍作评价).In my perspective of view, ____________ (表明个人观点)。 Apparently, ____________(将个人观点和图片内容相结合,得出观点。)For one thing, ____________(从社会角度论证). For another thing, ____________(从个人角度说明). For example, ____________(自己、朋友或他人,只要自己知道或听过的 例子).Last but not least, ____________(从反面角度谈论). As a result, the drawer of the illustration is urging us to _____________(建议或措施).Only in this way can we ____________(展望结果). In conclusion / To my understanding, ____________(再次表明观点或态度). We should ____________(进一步说明个人的观点). 范文:以20XX年6月英语四级作文为例 Which Is More Important As can be seen from the picture above, there is a conversation between a
四六级作文题目及范文
1995年1月大学英语四级作文题目及范文 Directions: For this part, you are allowed 30 minutes to write a composition on the topic Can Money Buy Happiness? You should write no less than 100 words and you should base your composition on the outline (given in Chinese) below: 1.有人认为金钱是幸福之本(source of happiness ) 2.也有人认为金钱是万恶之源(root of all evil ) 3.我的看法 [范文]Can Money Buy Happiness? Can money buy happiness? Various people have various answers. Some people think that money is the source of happiness. With money, one can buy whatever he enjoys. With money, one can do whatever he likes. So, in their minds, money can bring comfort, security, and so on. Money, as they think, is the source of happiness. But there are still a lot of others who think that money is the root of all evil. Money drives people to steal, to rob, and to break the law. A lot of people became criminals just because they were in search of money. And in the Western countries, there is nothing that can’t be bought by money. Many people lose their ow n lives when hunting it. I think that money is essential to life and we cannot do without money. But even though money is necessary to life, it can’t buy happiness. Happiness is not something that can be measured by money. It is a state of mind. One can have plenty of money, with which he can buy whatever he wants, and at the same time he is not happy because he is never satisfied or he is troubled by various kinds of problems. Therefore, although money is necessary for a happy life, it can’t buy happiness. 1995年1月大学英语六级作文题目及范文 Directions: For this part, you are allowed thirty minutes to write a composition on the topic My view on the Negative Effects of Some Advertisements. You should write at least 120 words and you should base your composition on the outline (given in Chinese) below: 1. 现在有些不良的商业广告 2. 这些广告的副作用和危害性 3. 我对这些广告的态度 [范文] My view on the Negative Effects of Some Advertisements Nowadays ther are a lot of false advertisements in society. They have caused many harms to society. Generally, their harms can be listed as follows.
图表作文四六级
图表作文的题型 一、根据表格作文 Writing Task 1 You should spend about 20 minutes on this task. The table below shows the hours of leisure time different age groups spend in Country A in a year. Write a report for a university lecturer describing the information in the table. You should write at least 150 words. 二、根据柱形图作文 Writing Task 1 You should spend about 20 minutes on this task. The chart below shows the number of men and women in further education in Britain in three periods and whether they were studying full-time or part-time. Write a report for a university lecturer describing the information shown below. You should write at least 150 words.
三、根据线形图作文 Writing Task 1 You should spend about 20 minutes on this task The graph below shows the sales of a product in three major international markets in the period between June 1994 and January 1997. A new marketing strategy was introduced in June 1995. Write a report for a university lecturer describing the information given in the graph. You should write at least 150 words