高职高专实用英语口语大赛训练题目
全国高职高专实用英语口语大赛”选拔赛竞赛参考题
Part II
Presentation
(3 minutes)
1
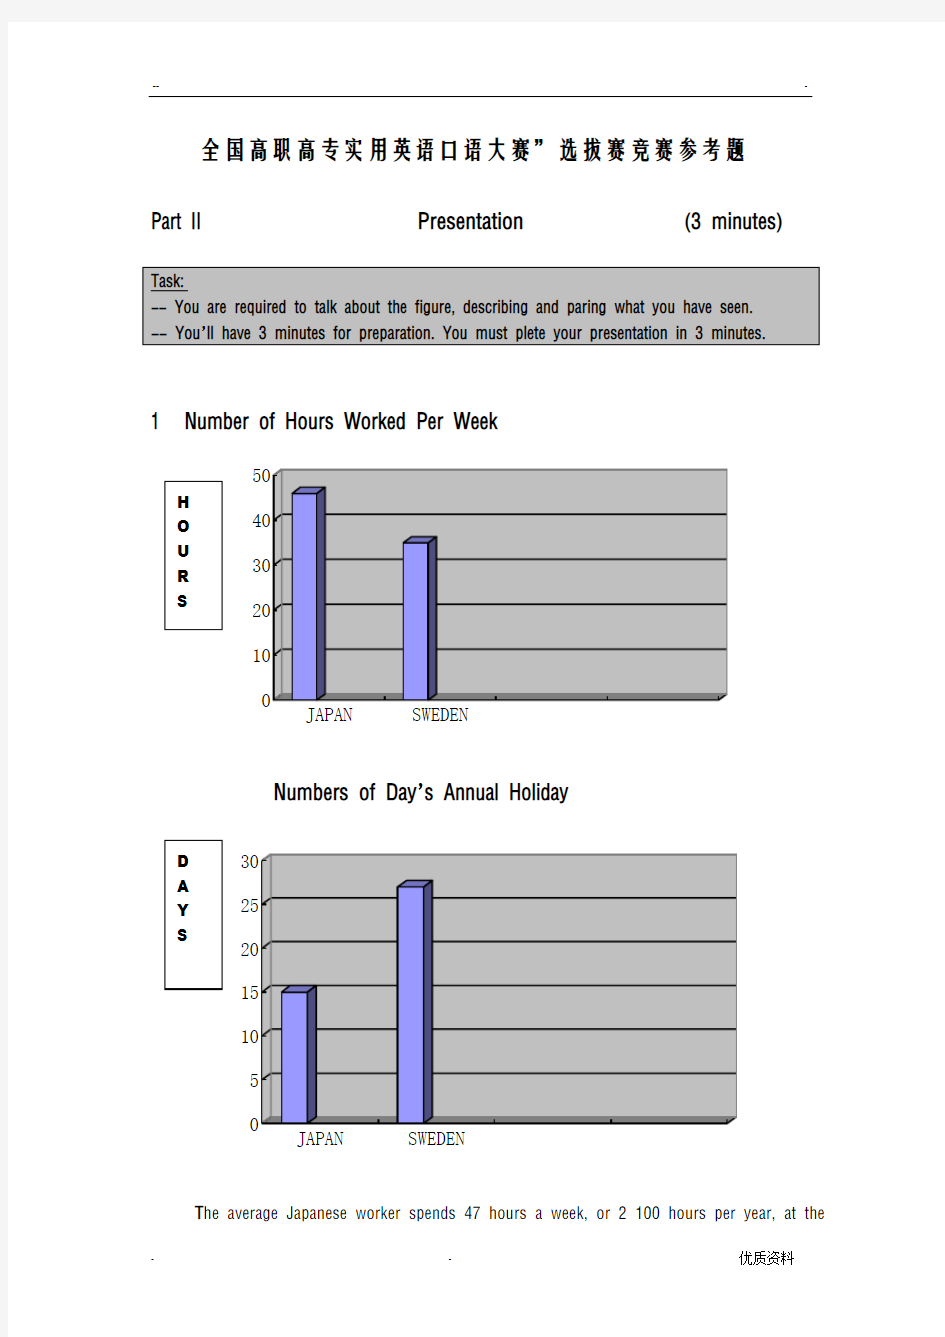
Number of Hours Worked Per Week
JAPAN
SWEDEN
Numbers of Day ’
s Annual Holiday
JAPAN
SWEDEN
T he average Japanese worker spends 47 hours a week, or 2 100 hours per year, at the
office or factory, while the average Swede clocks up only 37.
Swedish workers have 28 days of holiday per year, but the Japanese have only 15. A typical Japanese worker takes a six-day week, however, a Swedish worker works less than 5 days a week. If you are a worker, life is much easier in Sweden than in Japan, for you can work 10 hours shorter each week and you may have a much longer annual holiday.
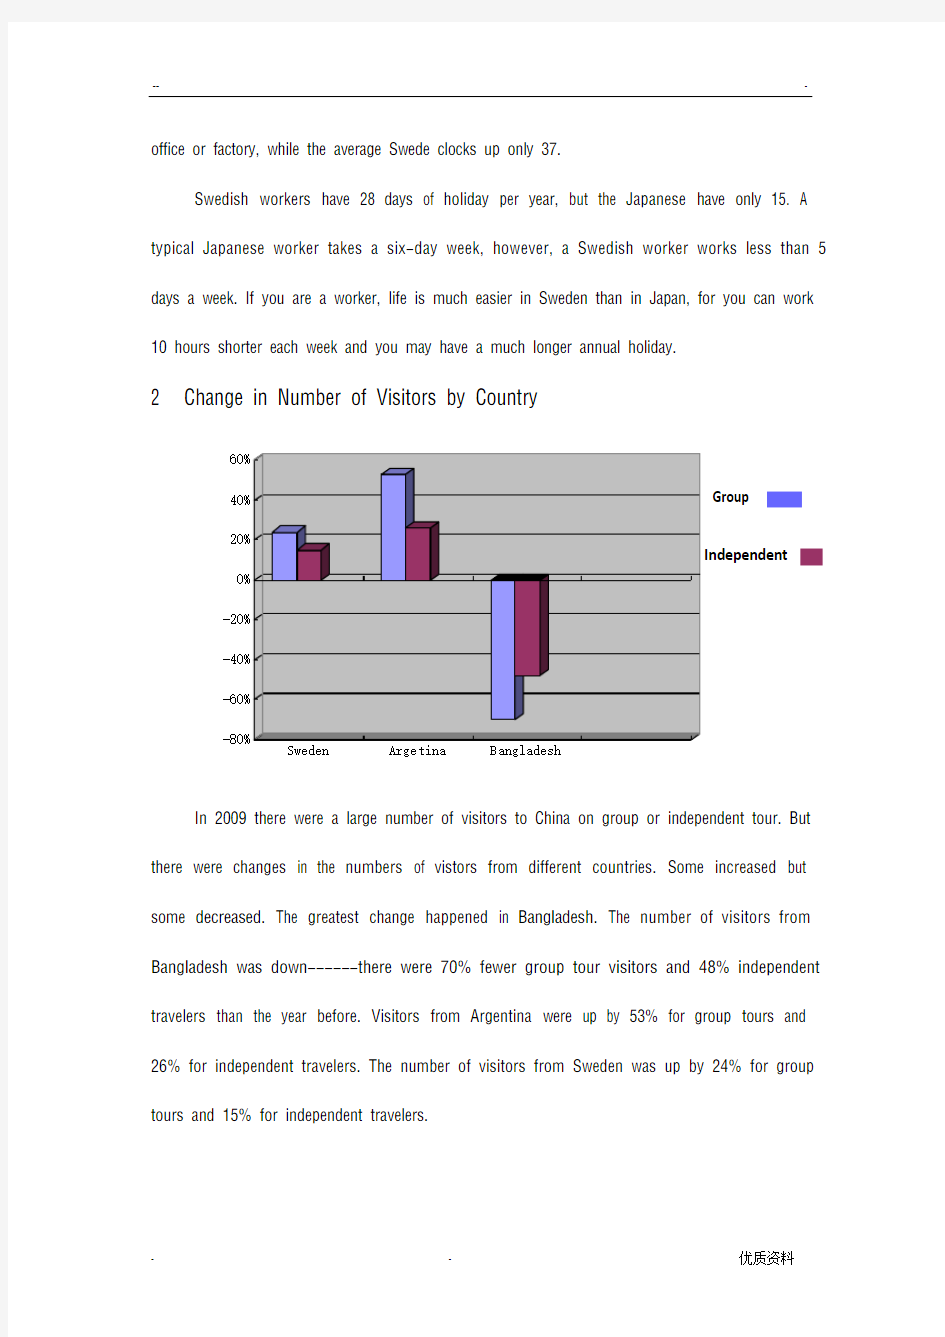
2 Change in Number of Visitors by Country
In 2009 there were a large number of visitors to China on group or independent tour. But there were changes in the numbers of vistors from different countries. Some increased but some decreased. The greatest change happened in Bangladesh. The number of visitors from
Bangladesh was down------there were 70% fewer group tour visitors and 48% independent travelers than the
year before. Visitors from Argentina were up by 53% for group tours and 26% for independent travelers. The number of visitors from Sweden was up by 24% for group tours and 15% for independent travelers.
Group
Independent
3 Sales of puter pany
50100150200250
1
2
3
4
5
6
7
8
9
10
11
12
At the beginning of the year sales of the puters were as 80 000 pounds. Sales rose steadily between February and April. However, they then fell slightly between April and July. Following a minor rise in August, sales declined noticeably from 160 000 pounds to 120 000 pounds. The downward trend continued, and in November sales reached their lowest point
Sales (Pound)
×1000
Month
since January. Fortunately, thanks to a new marketing strategy and growing demands for holiday goods, sales increased dramatically at the end of the year and eventually reached 200 000 pounds. In all, it ’s a year of both rise and fall and was finally ended up with great success in sales.
4 Time Spent on Different Media by Teenagers
24681012141618s u r f o n -l i n e
w a t c h T V
l i s t e n t o r a d i o
u s e t e l e p h o n e
r e a d b o o k s &m a g a z i n e s
hours/week
The chart shows a survey result about the hours the teenagers spend per week on the different media such as Internet, TV, radio, telephone and books or magazines in their spare time. Clearly, the teenagers like surfing the net very much and they usually spend 16.7 hours per week on-line. Next to this, they would prefer to watching TV, 13.6 hours per week being spent for that. Interestingly, in a week, they only spend about 6 hours reading books or magazines. And the amount of time they spend in listening to radio or using telephone is just in between.
5 Foreign Trade Growth of China (in billion of RMB)
5101520253035J a n
.
F e b .M a r .A p r .M a y .J u n .J u l y .A u g .S e p t .O c t .N o v .D e c .
510152025303540
As the graph shows, Chinese exports almost remained steady in January last year. In February, they went up rapidly. In the next three months, they fluctuated between 20 billion and 25 billion. From May to October, exports saw a slight decrease, then a small increase in November. In December, there was a significant increase. But after that, Chinese exports fell dramatically.
pared with exports, Chinese imports saw a continuous rise from the beginning of last year to May. In the next six months, they showed a gradual fluctuation. At the start of November, they began to pick up and from November to December, imports increased abruptly to reach a peak of 17 billion. At the beginning of this year, a sudden decline in exports led to steep fall in imports.
6 Market Share of MEX pany Products
Japan 15%