实验2 Matlab绘图操作
实验2 Matlab 绘图操作
实验目的:
1、 掌握绘制二维图形的常用函数;
2、 掌握绘制三维图形的常用函数;
3、 掌握绘制图形的辅助操作。 实验容:
1. 设sin .cos x y x x ??
=+??+??
23051,在x=0~2π区间取101点,绘制函数的曲线。 2. 已知: y x =2
1,cos()y x =22,y y y =?312,完成下列操作:
(1) 在同一坐标系下用不同的颜色和线性绘制三条曲线; (2) 以子图形式绘制三条曲线;
(3) 分别用条形图、阶梯图、杆图和填充图绘制三条曲线。
3.
已知:ln(x x e y x x ?+≤??=??+>??2
0102
,在x -≤≤55区间绘制函数曲线。
4. 绘制极坐标曲线sin()a b n ρθ=+,并分析参数a 、b 、n 对曲线形状的影响。 5.在xy 平面选择区域[][],,-?-8888
,绘制函数z =
6. 用plot 函数绘制下面分段函数的曲线。
,(),,x x f x x x x ?++>?
==??+
50
00
50
7. 某工厂2005年度各季度产值(单位:万元)分别为:450.6、395.9、410.2、450.9,试绘制柱形图和饼图,并说明图形的实际意义。
8. 在同一坐标轴中绘制下列两条曲线并标注两曲线交叉点。
(1).y x =-205
(2)sin()cos ,sin()sin x t t
t y t t
π=?≤≤?
=?303
详细实验容:
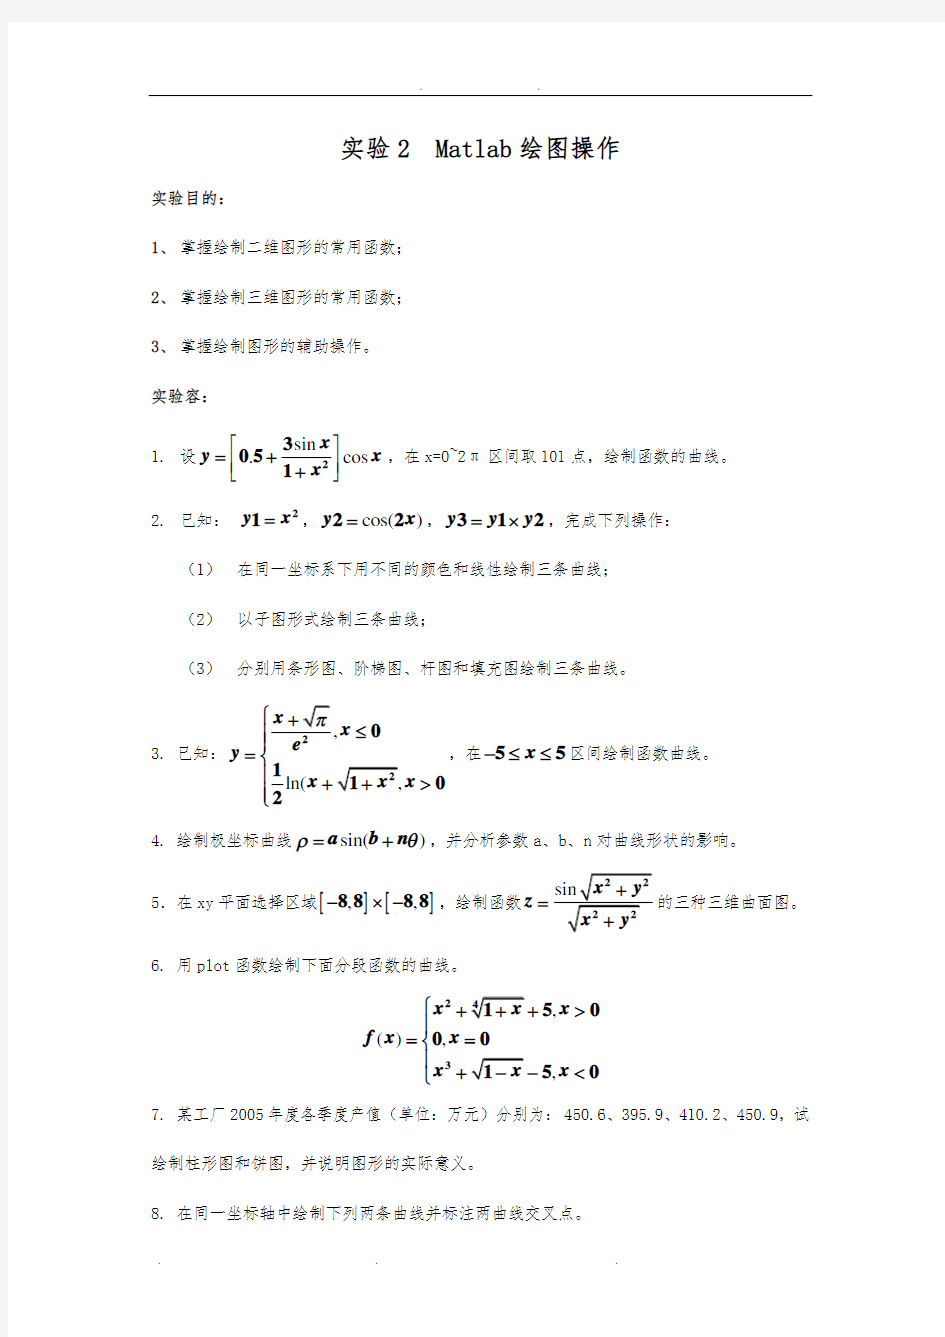
1.设sin .cos x y x x ??
=+??+?
?23051,在x=0~2π区间取101点,绘制函数的曲线。 >> x=(0:2*pi/100:2*pi);
>> y=(0.5+3*sin(x)/(1+x.^2))*cos(x); >> plot(x,y)
2.已知: y x =2
1,cos()y x =22,y y y =?312,完成下列操作: (1)在同一坐标系下用不同的颜色和线性绘制三条曲线; >> x= linspace(0, 2*pi, 101);
>> y1=x.*x; >> y2=cos(2x); >> y3=y1.*y2;
plot(x,y1,'r:',x,y2,'b',x,y3, 'ko')
(2)以子图形式绘制三条曲线;
>> subplot(2,2,1),plot(x,y1)
subplot(2,2,2),plot(x,y2)
subplot(2,2,3),plot(x,y3)
(3)分别用条形图、阶梯图、杆图和填充图绘制三条曲线。
subplot(2,2,1),bar(x,y1,'r');
subplot(2,2,2),stairs(x,y1,'b');
subplot(2,2,3),stem(x,y1,'y');
subplot(2,2,4),fill(x,y1,'k');
subplot(2,2,1),bar(x,y2,'r');
subplot(2,2,2),stairs(x,y2,'b');
subplot(2,2,3),stem(x,y2,'y'); subplot(2,2,4),fill(x,y2,'k'); subplot(2,2,1),bar(x,y3,'r'); subplot(2,2,2),stairs(x,y3,'b'); subplot(2,2,3),stem(x,y3,'y'); subplot(2,2,4),fill(x,y3,'k');
3. 已知:
,
ln(,
x
x
e
y
x x x
π
?+
≤
??
=?
?++>
??
2
2
1
10
2
,在x
-≤≤
55区间绘制函数曲线。
>> x=-5:0.1:5;
>> y=(x+sqrt(pi))/exp(2).*(x>=-5&x<=0)+(1/2)*log(x+sqrt(1+x.^2)).*(x>0&x<=5); >> plot(x,y)
4. 绘制极坐标曲线sin()
a b n
ρθ
=+,并分析参数a、b、n对曲线形状的影响。
>> theta=0:0.01:2*pi;
>> rho=2*sin(2*theta+1);
>> polar(theta,rho,'k')
>> theta=0:0.01:2*pi;
>> rho=1*sin(1*theta);
>> polar(theta,rho,'k')
5.在xy平面选择区域[][]
,,
-?-
8888,绘制函数
sin x y
z
x y
+
=
+
22
22 >> x=-8:8;
>> y=x;
>> [x,y]=meshgrid(x,y);
>> z=sin(sqrt(x.^2+y.^2))./sqrt(x.^2+y.^2);
>> subplot(2,2,1),plot3(x,y,z);hold on
>> subplot(2,2,2),mesh(x,y,z);hold on
>> subplot(2,2,3),surf(x,y,z);hold off
10
10
-1
1
10
6. 用plot函数绘制下面分段函数的曲线。
,
(),
,
x x x
f x x
x x x
?+++>
?
==
?
?
+--<
?
24
3
150
00
150
>> x=-8:0.01:8;
>> y=(x.*x+sqrt(sqrt(1+x))+5).*(x>0)+0.*(x==0)+(x.*x.*x+sqrt(1-x)-5).*(x<0); >> y=plot(x,y)
7. 某工厂2005年度各季度产值(单位:万元)分别为:450.6、395.9、410.2、450.9,试绘制柱形图和饼图,并说明图形的实际意义。
>> value=[450.6;395.9;410.2;450.9];
>> season=[1;2;3;4];
>> b=int8(c==min(value));
>> subplot(1,2,1),bar(season, value, 'stack');
>> subplot(1,2,2),pie3(value,b);
24%
26%
23%
26%
8. 在同一坐标轴中绘制下列两条曲线并标注两曲线交叉点。 (1).y x =-205
(2)sin()cos ,sin()sin x t t
t y t t π=?≤≤?
=?
303
x=-1:1; y=2*x-0.5; plot(x,y); hold on t=0:pi/100:pi; x=sin(3.*t).*cos(t); y=cos(3.*t).*sin(t); plot(x,y); hold off
P=fix((y+2.5)./(x+1).*10); A=rem(P,20)==0; A
Q=find(A==1)
Q =
3 30 最后结果是:
x = 0.1870 y =0.0617
x = 0.2434 y = -0.7252