风险管理软件CrystalBall使用指导
Monte-Carlo Simulation with Crystal Ball?
To run a simulation using Crystal Ball?:
1. Setup Spreadsheet
Build a spreadsheet that will calculate the performance measure (e.g., profit) in terms of the inputs (random or not). For random inputs, just enter any number.
2. Define Assumptions—i.e., random variables
Define which cells are random, and what distribution they should follow.
3. Define Forecast—i.e., output or performance measure
Define which cell(s) you are interested in forecasting (typically the performance measure, e.g., profit).
4. Choose Number of Trials
Select the number of trials. If you would later like to generate the Sensitivity Analysis chart, choose “Sensitivity Analysis” under Options in Run Preferences.
5. Run Simulation
Run the simulation. If you would like to change parameters and re-run the simulation, you should “reset” the simulation (click on the “Reset Simulation” button on the toolbar or in the Run menu) first.
6. View Results
The forecast window showing the results of the simulation appears automatically after (or during) the simulation. Many different results are available (frequency chart, cumulative chart, statistics, percentiles, sensitivity analysis, and trend chart). The results can be copied into the worksheet.
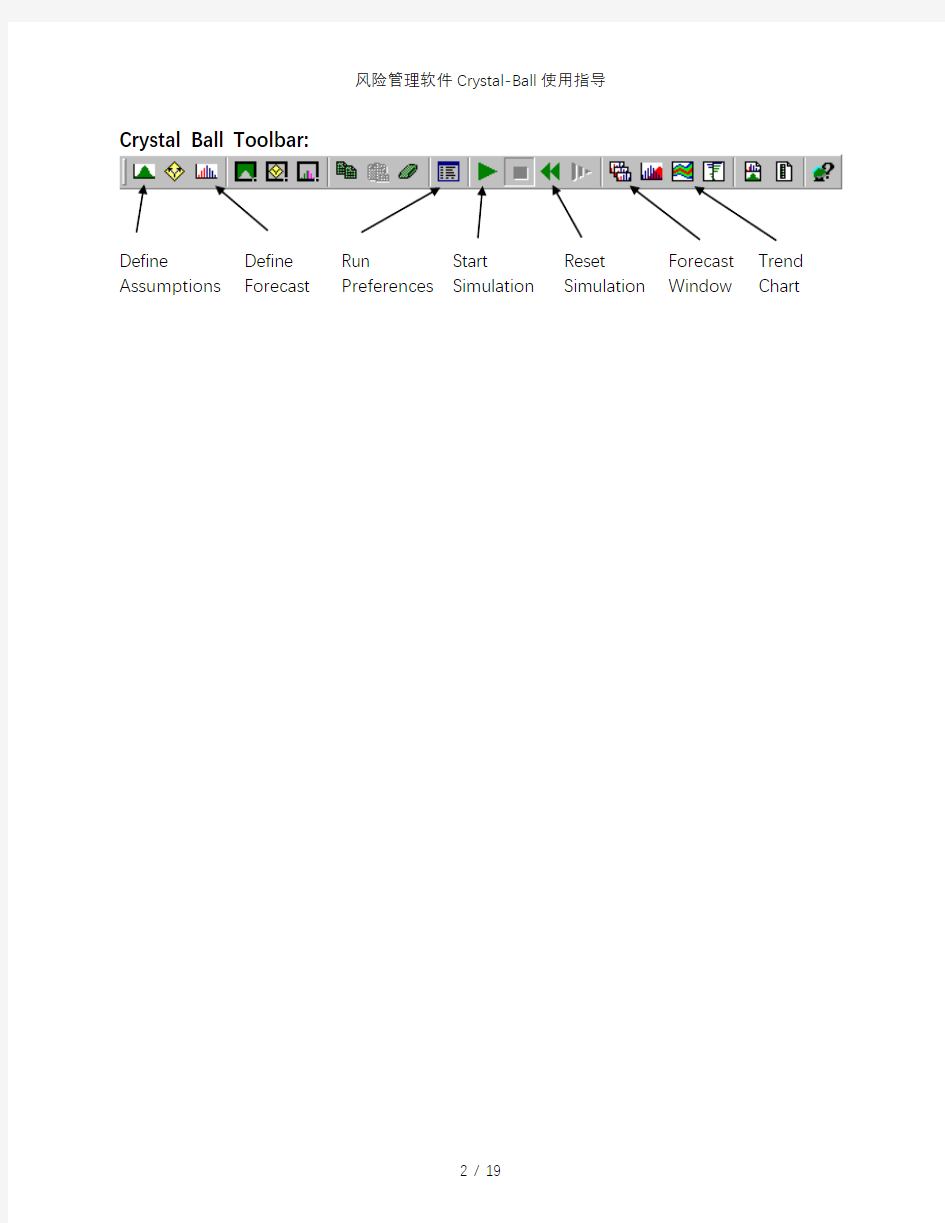
Crystal Ball Toolbar:
Define Define Run Start Reset Forecast Trend Assumptions Forecast Preferences Simulation Simulation Window Chart
Walton Bookstore Simulation with Crystal Ball?
Recall the Walton Bookstore example: It is August, and they must decide how many of next year’s nature calendars to order. Each calendar costs the bookstore $7.50 and is sold for $10. After February, all unsold calendars are returned to the publisher for a refund of $2.50 per calendar. Suppose Walton predicts demand will be somewhere between 100 and 300 (discrete uniform).
Demand = d ~ Uniform[100, 300]
Order Quantity = Q (decision variable)
Revenue = $10 * Min(Q, d)
Cost = $7.50 * Q
Refund = $2.50 * Max(Q–d, 0)
Profit = Revenue – Cost + Refund
Step #1 (Setup Spreadsheet)
Walton Bookstore Simulation with Crystal Ball ?
Step #2 (Define Assumptions —i.e., random variables)
—
color code (blue):
and click on the “Define Assumptions” button in toolbar (or in the Cell menu):
Select type of distribution:
Provide parameters of distributions:
Walton Bookstore Simulation with Crystal Ball?Step #3 (Define Forecast—i.e., output)
click on the “Define Forecast” button in toolbar (or in the Cell menu),
and fill in the Define Forecast dialogue box.
Step #4 (Choose Number of Trials)
Click on the “Run Preferences” button in toolbar (or in the Run menu):
and select the number of trials to run.
Walton Bookstore Simulation with Crystal Ball?
Step #5 (Run Simulation)
Click on the “Start Simulation” button in toolbar (or Run in the Run menu):
Step #6 (View Results)
The results of the simulation can be viewed in a variety of different ways (frequency chart, cumulative chart, statistics, and percentiles). Choose different options under the View menu
in the forecast window.
The results can be copied into a worksheet or Word document (choose Copy under the Edit menu in the simulation output window.
Using Trend Charts to Find the Impact of Order Quantity
on Potential Profit
Define several forecast cells (G14:G18) for several possible order quantities (Q=100, 150, 200, 250, 300). Use the same random order quantity for each to compare them more equally (i.e., one assumption cell for demand—C14—with the rest set equal to C14).
After running the simulation, choose “Open Trend Chart” in the Run menu. This chart gives “certainty bands” for the forecast cells. 10% of the time, the project duration will fall within the inner band (light blue), 25% of the time within the 2nd band (red), 50% of the time within the third band (green), and 90% of the time within the outside band (dark blue).
Project Management—Global Oil
Global Oil is planning to move their credit card operation to Des Moines, Iowa from their home office in Dallas. The move involves many different divisions within the company. Real estate must select one of three available office sites. Personnel has to determine which employees from Dallas will move, how many new employees to hire, and who will train them. The systems group and treasurer’s office must organize the new operating procedure and make financial arrangements. The architects will have to design the interior space, and oversee needed structural improvements. Each site is an existing building with sufficient open space, but office partitions, computer facilities, furnishings, and so on, must all be provided.
A complicating factor is that there is an interdependence of activities. In other words, some parts of the project cannot be started until other parts are completed. For example, Global cannot construct the interior of an office before it has been designed. Neither can it hire new employees until it has determined its personnel requirements.
The necessary activities and their necessary predecessors (due to interdependence) are listed below. Three estimates are made for the completion time of each activity—the minimum time, most likely time, and maximum time.