人教版高三英语图表作文训练复习教案

图表作文复习
I. 理论依据:《课程标准》八级写作目标
1、能根据所读文章实行转述或写摘要;
2、能根据文字或图表提供的信息写短文或报告;
3、能写出语意连贯且结构完整地范文,叙述事情或表达观点和态度;
4、能在写作中做到文体规范、语句通顺。
II. 教学内容:复习图标英语作文的写作方法和思路。
教学目标:达到《课程标准》八级写作目标
教学重点和难点:根据所给的信息,准确地审题和组织文章的结构;使用尽可能多样的句式
必要的过渡性词语完成写作任务。
III. 图表作文的几种形式:
A表格形式,将统计的数据或被说明的事物直接用表格形式体现出来,即统计表。
B图形形式
C表示数据变化的曲线图;
D 表示数据的大小或数量之间的差异的柱状图;
E表示总体内部结构变化的扇形图
IV. Presentation
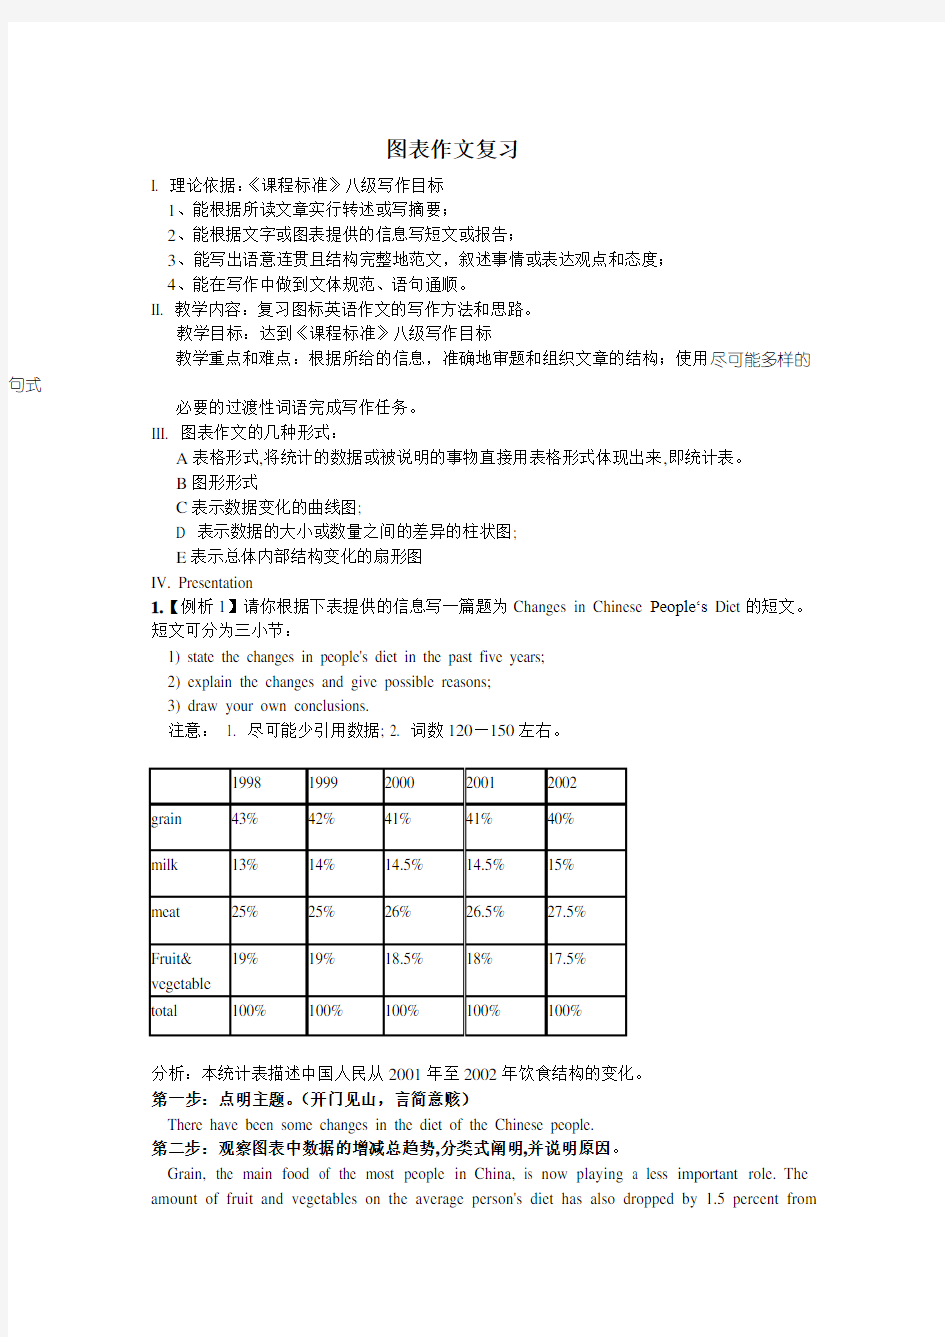
1.【例析1】请你根据下表提供的信息写一篇题为Changes in Chinese People‘s Diet的短文。短文可分为三小节:
1) state the changes in people's diet in the past five years;
2) explain the changes and give possible reasons;
3) draw your own conclusions.
注意:1. 尽可能少引用数据; 2. 词数120—150左右。
分析:本统计表描述中国人民从2001年至2002年饮食结构的变化。
第一步:点明主题。(开门见山,言简意赅)
There have been some changes in the diet of the Chinese people.
第二步:观察图表中数据的增减总趋势,分类式阐明,并说明原因。
Grain, the main food of the most people in China, is now playing a less important role. The amount of fruit and vegetables on the average person's diet has also dropped by 1.5 percent from
1998 to 2002. The amount of milk and meat has increased.
The changes in diet can be explained by several reasons. For one thing, with the development of economy, an increasing number of people can afford to buy better foods. For another, people have realized the importance of a balanced diet. Avoiding starvation is no longer the only purpose of eating.
第三步:归纳总结并得出结论。
In a word, the changes are the signs of the improvement in people's lives. There is no doubt that there will be greater changes in people's diet in the future.
2.Conclusion:
图表式作文写作分三步:
第一、开门见山地点明本图表所反映的主题
经常使用的词汇有:table, chart, figure, graph, describe, tell, show, represent等等。
第二、分析数据间的主要差异及趋势,然后描写
在描写数据间变化及总趋势特征时,可采用分类式或对比式以支持主题,并阐明必要的理由。要注意层次清楚。经常使用的词汇有:rise, drop, reduce, increase, decrease, fall, while, but, on the contrary, however, compare... to/ with..., in contrast to, as...as, the same as, similar to, different from, difference between, among, more than, less than等等。
第三、归纳总结或发表评论。有时第三步可省略
经常使用的词汇有:in a word, in short, generally speaking, It's clear from the chart that..., We can draw the conclusion that..., We can learn/know...等等。
激活练习:
3. More practice
某学校对中学生课余活动实行了调查,结果如下。请根据图表1提供的信息描述学生每天的课余活动,并针对图表2中任何一个数据中反映的情况写出你的看法。词数120-150。
一、内容要点:
1. 图表1中六项活动及所用时间
2. 图表2中一个数据反映的情况
3. 自己的看法
二、说明:
1. 内容要点可用不同方式表达。
2. 能够紧扣主题的适当发挥。
一个看法。词数很多于60。
一、内容要点:
1. 图表1中六项活动及所用时间
2. 图表2中一个数据反映的情况
第一步:本图表所反映的主题
Key words
1. the daily average amount of time, different after-class activities.
The Chart shows the daily average amount of time the students spend on different after-class activities.
第二步:图表1中六项活动及所用时间
On Chart 1, The students spend 93 minutes on their homework. And watching TV takes up 46 minutes. They put in about the same amount of time listening to music and working on the computer, 34 minutes and 30 minutes each. 25 minutes is spent on sports, only 12 minutes goes into housework.
第三步:图表2中一个数据反映的情况及自己的一个看法
Problem:little time for sports
Suggestions
10% of the time is taken up with sports activities.
We should encourage the students to do more exercise after class.
One possible version:
Chart 1 shows the daily average amount of time the students spend on different after-class activities. As Chart 1 shows,the students put most of their time -93 minutes-into their homework, and next in line is watching TV, which takes up 46 minutes. They spend about the same amount of time listening to music and working on the computer, 34 minutes and 30 minutes each. While 25 minutes is spent on sports, only 12 minutes goes into housework.
As is shown in Chart 2, only 10% of the time is taken up with sports activities. I think the school should encourage the students to do more exercise after class. Just as a proverb goes, all work and no play makes Jack a dull boy. So only when students strike a balance between studies and play, can they be healthier and more energetic.
4. 图表题中常见句子翻译:
? 1. 从图表上能够看出这本书销售辆有两个高峰。
? 2. 从图表上能够看出62%的人愿意当志愿者。
? 3. 7月的数量是四月的两倍
? 4. 与1,2月间的销售量相比,本书2月到7月间的销售额增加了两倍。
? 5. 正如你所看到的,整体呈下降趋势.
? 6. 在前三个月车祸从数由一月22起上升到三月的32起.
答案:
? 1 From the graph, we can see that there were two peaks in the sales of the book
? 2.As is shown by the graph that 62% of students like to be a volunteer
3. The number in July doubled that in February.
4. Comparing the sales of the book between January and February, we find that it
increased 3
times.
? 5. As you can see the general tendency is a declining.
? 6. In the first three months car accidents increased from 22 in January to 32 in March. 5. 图表作文中套用句式:
1. As is shown by the graph/in the table that/ As we can see clearly from the chart above…(概述图表)
2. The results of the survey seem to suggest that…(得出结论)
3. …amount to …(数量总计)(add up to /come to /sum up to )
4. …increase(rise/ fall/ drop )from …to …(数量增减)
5.(be)three times as + 形容词+ as
https://www.360docs.net/doc/6f11512640.html,pared with …, …
7.There is (was) a rapid rise in …
8 The changes ….can be explained for several reasons.
9. It is reported that 85% of…
10 In recent years/during this years……
11 … are also the reason why the number increasing so fast.
12. From the increased number we can get that…