丁往道《英语写作手册(中文版)》考研真题详解(图表作文)【圣才出品】
◆图表作文
题1 [英语二2010研]
Directions:
In this section, you are asked to write an essay based on the following chart. In your writing, you should
1) interpret the chart and
2) give your comments.
You should write at least 150 words.
Write your essay on ANSWER SHEET 2. (15 points)
【图表解读】
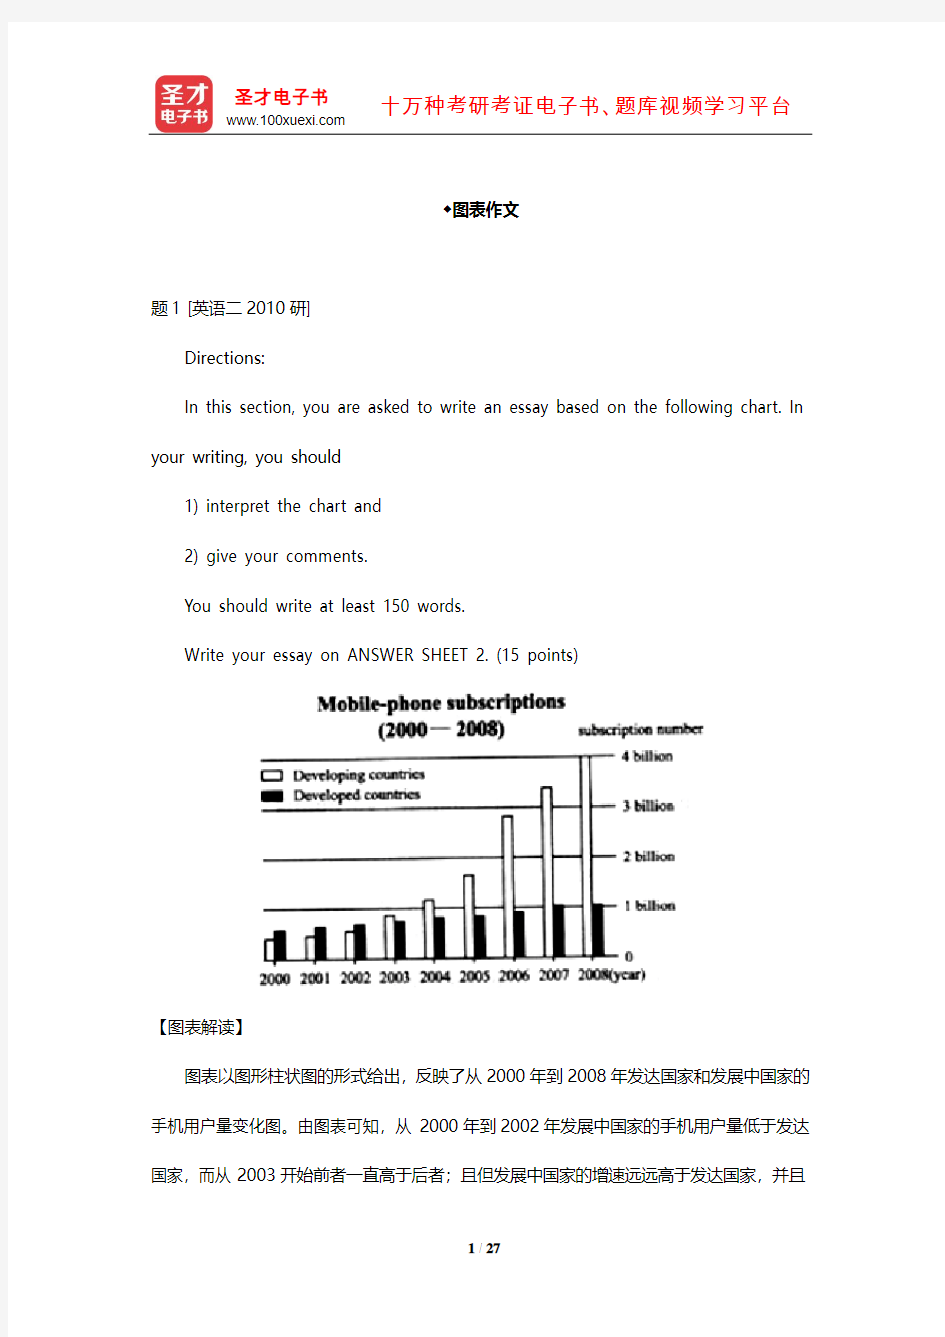
图表以图形柱状图的形式给出,反映了从2000年到2008年发达国家和发展中国家的手机用户量变化图。由图表可知,从2000年到2002年发展中国家的手机用户量低于发达国家,而从2003开始前者一直高于后者;且但发展中国家的增速远远高于发达国家,并且
在2008年差额达到最大,前者用户量达到4亿,是后者的4倍。
根据要点,范文将安排三个段落:第一段简单描述图表内容,以2003年为分水岭,之前发展中国家的手机用户量一直低于发达国家,之后前者远远高于后者,且发展中国家的增幅远高于发达国家,08年差额达到最大,前者总量达到4亿,是后者的4倍。第二段,指出两个原因,最初发展中国家的经济情况远远落后于发达国家,但近几年经济开始崛起,所以导致先少后多;发达国家人口总量少,个人主义强烈,文明化程度高,且其他社交媒体发展完备,故增速低于人口众多的发展中国家。第三段,表达个人立场,手机的便利性极大地促进了人们的交流,但是也给换件和健康带来了危害,建议合理使用手机。
【参考范文】
(1)As can be seen from the chart, from 2000 to 2002, the mobile phone subscriptions in developed countries are higher than that in developing countries.
(2)However, the situation reverses from 2003 and since then the number of mobile phone users in developing countries has been increasing much faster than that in developed countries. Particularly in 2008, the total number of the mobile phone subscriptions in developing countries has witnessed a peak of 0.4 billion, compared with 0.1 billion in developed countries.
(3)I believe that this interesting fact is caused by the following two reasons.
(4)Above all, during the beginning years, the developed countries have much more advanced economic development and thus more people can afford this service. However, developing countries have recently elevated their economies to a more and more higher stage, which thus benefits an increasing number of people with phone use. (5)Furthermore, the developed countries have a rather smaller
population who keeps a limited demand for mobile service. There, most of the people are well-educated and the society is highly civilized, which decreases the potential in many aspects including in the area of private telecommunication tools and people’s demands for further enlargement of such tools tend to saturation. This is why the number of mobile phone users in developed countries has remained below o.1 billion within almost ten years.
(6)In my opinion, mobile phones can greatly facilitate interpersonal communication but at the same time do harm to the physical health and the environment due to the radiation. In this sense, people should use their phones in a proper manner so as to decrease the harm as much as possible.
【行文点评】
(1)开篇点题,as 引导非限制性定语从句,指代后面的主句内容。
(2)however表示转折,提示后面的变化趋势与前面差别很大,甚至相反。reverse表示“倒置,完全相反”,4亿更合适的表达为“0.4 billion”。
(3)中心句,统领全段,be caused by“由……导致”。
(4)(5)分别以above all和furthermore开头,层次分明地解释原因,条理清晰。第二条原因中提到,西方国家高度文明化,导致了对于通讯工具的需求饱和,需要仔细揣摩。
(6)点明个人立场,结合图表和生活实际,给出自己的建议和意见。
【亮点词汇】
subscription [] n. 订阅;定金;签署
reverse [] v. 颠倒,倒转,相反
witness [] v. 见证,证明,表明
civilized [`] adj. 文明的,文明化的
telecommunication [] n. 电讯,无线电通讯enlargement [] n. 扩大
saturation [] n. 饱和(状态),饱和,浸透
in a proper manner合适地,恰当地
【实用句型】
As can be seen from the chart ....
However, the situation reverses and ....
The total number of … has witnessed ….
I believe that this interesting fact is caused by the following two reasons.
In this sense, people should use …in a proper manner so as to…..
题2 [英语二2011研]
Directions:
Write an essay based on the following chart. In your writing, you should
1) interpret the chart and
2) give your comments.
You should write at least 150 words.
Write your essay on ANSWER SHEET 2. (15 points)
2008、2009年国内轿车市场部分品牌市场份额示意图
【图表解析】
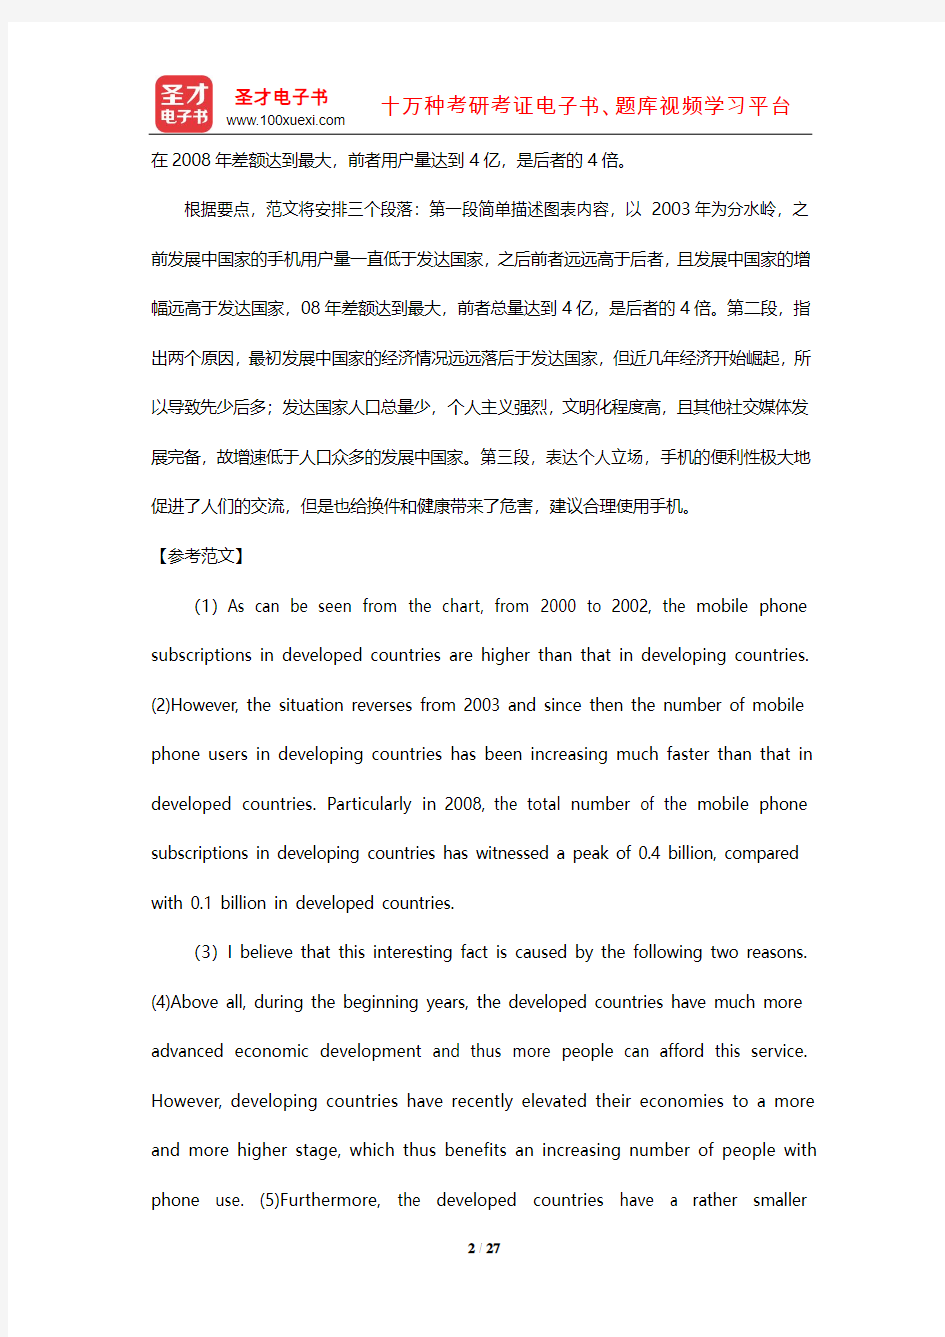
本题以柱状图的形式给出,反映了从2008年到2009年三大汽车品牌在国内轿车市场份额的变化。由图表可知,国内品牌的市场份额显著增加,日系品牌急剧下降,而美系品牌基本持平。考生可先对这一现象作简单描述,再着重分析其原因,最后给出自己的观点或建议。
根据解题思路,范文将安排三个段落:第一段,描述图表内容,从2008年到2009年,国内品牌的市场份额显著增加,从25%上升到33%,日系品牌急剧下降,从35%下降到25%,而美系品牌基本持平,保持在15%左右;第二段分析原因,首先国内科技进步巨大,汽车行业不断创新进步,再者日系品牌原来一直以品质著称,但近几年的汽车召回事件损害了品牌信誉,最后美系品牌由于其消费群体定位精确,故仅存在有限的消费人群。
【参考范文】
(1)This chart clearly reveals the change of market shares of three regional car brands from 2008 to 2009. (2)The market share owned by domestic car brands has increased dramatically from 25% to 33%. By a sharp contrast, the market share
Japanese car brands accounted for has dropped rapidly from 35% to 25%. At the meantime, the market share of American car brands has remained at about 15%.
(3)This phenomenon, in my opinion, can be attributed to three reasons. Above all, domestic technology has increasingly advanced and the car industry has all the time concentrated upon innovation and self-owned technologies, so the quality and function of domestic cars have been greatly improved. By contrast, Japanese car brands which were well-known for top quality have terribly been damaged by several times of massive car-recallings. (4)Meanwhile, American car brands usually design customer-made sales strategies and target specific consumers, so they have a limited proportional consumers.
(5)Evidently, the Chinese automakers are doing a good job in competing with Japanese and American counterparts. In the future, I believe Chinese car brands will become more and more popular both home and abroad.
【行文点评】
(1)首句整体说明柱状图展示的内容,reveal意为“揭示,显示”,传神达意。
(2)分层叙述市场份额的变化情况,dramatically,sharp,rapidly,increase,drop,remain 等词准确表示出变化的形势。
(3)开头即为中心句,统领全段,为下面即将分层展示的三个原因做铺垫。be attributed to归因于。
(4)美系车在华销量不是特别好的原因需要仔细思考,同时需要具备一些基本的背景知识。(5)最后表达了对国内车系销量成绩的肯定与未来发展的美好憧憬。
【亮点词汇】
英语作文五年荟萃图表类
图表类 第一部分五年高考题荟萃 Passage 1 (09·福建) 某英语报社拟成立“微笑俱乐部”,现向癸未征募会员。要求申请者提交一篇题为“I want to Smile”的英语短文。请你以申请者的身份,根据以下思路图的提示用英语写一篇短文。 注意: 1.根据思路图适当展开,以使行文连贯; 2.词数:120左右 I Want to Smile 【参考范文】 I Want to Smile There are many advantages of smiling. It can not only make us happy, but also please others. If we smile at life, life will smile on us in return. So I want to smile at all whenever and wherever possible, First, I would like to smile at my parents because they have given me life and take all the trouble to bring me up. They arrange almost everything for me. With their help, I have made great progress. I woul d like to say “Thank you” to them with a smile. Then my smile should go to myself, for only in this way can I gain more confidence in smiling my troubles away and live a better life.
2017考研英语作文:网络类范文
凯程考研辅导班,中国最权威的考研辅导机构 第 1 页 共 1 页 2017考研英语作文:网络类范文 作文预测 大作文话题类型:1. 抽象品质; 2. 社会现象类 3. 社会问题类 预测话题包括:1. 网络类(网购、微博、微信等新现象);2. 抽象品质类(梦想与行动、创新、 诚信等)3. 环境类(节约型社会、交通状况、动物/资源保护等)4. 社会现象类(剽窃,明星代言、真人秀等) 预测作文范文 网络类(网购、微博、微信等新现象) What is subtly demonstrated in the above drawing is that in front of a desktop sits a fashionable lady who is staring at the screen with shocked expression wearing on cheeks and huge sweat dropping from her forehead. What is spit from the computer is the lengthy Alipay bill, which can almost be spread as long as two meters. The caption above reads that you should keep away from Taobao and cherish your income. The objective of the drawer is to show us that utmost attention should be paid to shopping online, which has exerted profound impact on the daily life of the average individuals. We can easily recognize its advantages: e-commerce, which is extremely convenient, can save us a great amount of precious time and we can buy products everywhere we want as long as we can surf online. However, for all the advantages mentioned above, online trading is by no means without its limitations: we may be cheated by some online retailers, which might be a potential threat to our bank accounts. Accordingly, it is imperative for us to take drastic measures. For one thing, we should appeal to the authorities to make strict legislations to severely punish those who deliberately spoil the interests of online customers. For another, we should enhance the awareness of residents that rational purchasing is conducive to our income management. Only in this way can we maximize the merits and minimize the demerits of online purchasing.
考研英语历年图表作文范文
考研英语历年图表作文范文 图表作文是英语二大作文的考察形式,由一张图表和两段提纲构成,图表又分为4种类型来考察,包括柱形图,饼图,曲线图和表格。当然,同学在复习时,无需每种图表都各自准备,我们可以寻找图表中存在的共性,出万能的表达,化繁为简。以下就是图表作文的谋篇要点和万能表达。 首段为图表阐释段,也就是用文字描述图表中的相关数据。在本段中包括四大信息要点,图表标题,整体表现,极值和过渡句。在本段中将图表归为两类,动态图和静态图,在此同学们不必太过纠结,只需注意图表中反映的内容有无时间跨度,存在时间的变化为动态图,没有时间上的跨度称为静态图。 动态图和静态图在图表标题和过渡句上表达是一致的。首先图表标题是汉译英,具体的方法我们会在强化课程上讲解。在整体表现上,主要体现的是全部指数的变化或差异。动态图的表达为“As is clearly reflected by the chart, 全部指数witnessed some changes from 时间 to 时间.”静态图为As is clearly reflected by the chart, 全部指数show totally different attitudes towards 话题。
到了极值描述,就是反映出数据的最大变化和差异,它们都是趋势,所以,可以用这样的表达, Especially, 某指数 shows the most obvious tendency that 具体表现.在具体表现的描述中一定要包含具体数字,最后过渡句的通用句式是Obviously, the inclinations, clearly reflected by the chart, should be given more consideration. 中段为分析论证段,主要是从原因或者影响方面找切入点分析这种现象。 在这里只说原因方面,影响的切入点会在强化课程中具体介绍。段落包含两大要点-中心句和具体原因。中心句的作用就是承上启下,也就是承接上文提出的问题,开启下文阐释的原因。大家看看以下表达,Theoretically, several reasons may trigger the trend that 最大变化/差异, but the following two, for my part, could aount for the prevalence of the phenomenon mentioned above.接下来就是具体原因的介绍了,不建议同学们套用小作文中的分条写模板,第一字数太少,第二语言不够优秀。 “To begin with, it is universally admitted that +原因一. So long as you regard this analysis reasonable, I may go further. Another special consideration in this case is that+原因二.”这样的表达不仅吸睛,同学们自己需要写的内容也不多,避免了字数不够的尴尬。第三段为总结预测段,就是总结上
图表类英语作文范文英语作文模板(图表类的)
图表类英语作文范文英语作文模板(图表类的)这里很全 一、图表类作文常用的单词、短语和句型 1.表示数据变化的单词或短语 in the case of (在……的情况下) in terms of (在……方面) increase / raise / rise / go up(增加) decrease / grow down / drop / fall (减少) increased by (增长了) increased to (增长到) the number sharply goes up to(数字急剧上升至)
significant(重大的),steady(平稳的),gradual(逐渐的),slow(慢慢的),stable(稳定的),rapid(快速的)…… 2. 表示从图表得知的信息的句型 The table / chart / graph shows that...(这个图表告诉我们……) Aording to the table / chart /graph, we can see that...(根据图表,我们可以看出……) It can be concluded from the graph that...(从图表中可以得出……) The table shows the changes in the number of...over the period from...to...(该表格描述了在……期间……数量的变化) 二、图表类作文的模式
图表类作文中的图表主要有以下形式:柱形图类(chart)、圆饼图类(pie chart)、曲线图类(line chart)、表格类(table)。写文章时,首先要对图表加以描述,而后引出主题加以讨论,最后得出结论,也就是按照描述图表—解释原因—下结论的步骤来写。切忌对图表不作交代就直接谈论主题。 1.表格类作文的模式 表格类作文一般可以分为三段:第一段对表格中的数据进行描述,只要抓住变化规律即可,切忌一一列举数据;第二段说明变化的原因;第三段得出结论。即: (1) Studying the table carefully, we can see...(仔细研读表格,我们可以看出……) (2) In my opinion, the reasons why...are as follows. Firstly...Secondly...Thirdly...(在我看来,为什么……的原因在于以下几点:第一……第二……第三……)
2020考研英语精选作文精美语句格式6
2020考研英语精选作文精美语句格式6 人生价值类模板1: As the old Chinese saying goes,…… . It echoes with this picture in which…… . The title of the picture further points out that…… . The picture is meant to…… . As far as I am concerned, I think…… . This universal truth can be particularly proved in the field of…… , where…… . A brief survey of history about also demonstrates the fundamental importance of…… .…… , for example,…… . The same principle applies to common people as well, and I am sure everybody can benefit from…… . 人生价值类模板2: From the picture we can perceive that…… . What astonishes the drawing and the readers is that…… . It is known to all that…… , but it seems…… . The artist utilizes this artistic presentation to imply a spreading vogue that…… . Ultimately, the trend boils down to…… . Accordingly,…… . To worsen the problem, this behavior is evoking…… . In my point of view, we are in a prime time to curb the
考研英语作文范文和模板:图表作文
考研英语作文范文和模板:图表作文 图表作文 1.写作攻略图表作文是考研英语写作中较为常见的题型之一,也是难度较大的一种写作题型。这类作文可综合提供题目、数据、图像、提纲,形式多样,但实际上只涉及5个方面:描述图表、指明寓意、分析原因、联系实际、给出建议,而每次考试只是从这5个方面的内容中选出3个结合在一起。从写作类型来看,基本上属于说明文。要求考生围绕题目将有关信息转化为文字形式,考生应该具有一定数据分析和材料归纳的能力,同时会运用一定的写作方法。考研试题一般以三段式写作方法来组织文章,第一段总结归纳信息反映的整体情况,点出主题思想,第二段回答第一段所得出的问题,对数字、数据等做出有条理的分析比较,第三段做出总结或给以简单的评论。表格和图表题型写作要点:(1)考生应仔细研究题目以及提示信息,认清图表中的数字、线条、阴影等部分的变化趋势和走向,抓住其主要特点,然后根据图表所显示的中心信息确定内容层次以及主题句。(2)考生应该仔细研究图表所给出的大量信息,从中选取最重要,最有代表性的信息,然后根据全文的主旨去组织运用所获取的关键信息。切忌简单
地罗列图表所给出的信息。(3)图表作文一般采用的时态为一般现在时,但如果图表中给出了具体时间参照,考生则应对时态进行相应的调整。(4)图表作文有一些固定句型和表达法,考生应对此融会贯通。(5)图表作文可以细分为表格,曲线图、柱形图和饼形图。除了上述共同要点,考生还应了解这四种图在写作方面的不同特点。——表格可以表示多种事物的相互关系,所以考生要对表格中所给出的大量数字进行比较分析,从中找出其变化规律。——曲线图常表示事物的变化趋势,考生应认真观察坐标系所显示的数据信息,并且密切注意交汇在坐标横轴和纵轴上的数字及单位。——柱形图用来表示各种事物的变化情况及相互关系,要求考生通过宽度相等的柱形的高度或长度差别来判断事物的动态发展趋势,因此考生应密切关注坐标线上的刻度单位及图表旁边的提示说明与文字。——饼形图表示各事物在总体中所占的比例及相互关系,旨在要求考生准确理解并阐述一个被分割成大小不等切片的饼形图所传达的信息。考生应清楚掌握部分与整体,部分与部分之间的相互关系,这种关系通常是以百分比的数字形式给出的。(6)列出各段主题句。考生可以根据所给提纲或已知信息列出每段的主题句,为全文的展开做好铺垫。(7)围绕主题句完成段落的展开。尽量做到主题明确、条理清楚、文字简练。(8)检查与修改。对图
图表类英语作文范文
图表类型的英语写作如果不擅于观察漫画的话,作文写出来可能会偏题。下面是小编给大家带来图表类英语作文,供大家参阅! 图表类英语作文范文篇1第一段:说明图表 开篇句:As the bar chart shows, ____ during the years of ____to____. 扩展句:1、As early as _____. 2、Then _____ years later, ____. 3、And arriving in the year ____, ____. 第二段:解释图表变化原因 主题句:Several factors contribute to _____. 扩展句:1、______. (原因1) 2、And ______.(原因2) 3、Furthermore, ______ (原因3) 4、All these result in ____. 第三段:提出解决办法 结尾句:However, ____ is faced with some problems. 扩展句:1、With _____, ____, the effect of which is not only discouraging, but also challenging. 2、So my principle is to pay due attention to ___, but not justto____. 示范 第一段:说明图表 开篇句:As the bar chart shows, the number of people below the poverty line decreased dramatically during the years of 1978 to1997. 扩展句:1、As early as 1978, about 250 million people were under the poverty line. 2、Then seven years later, the number became three fifths thatof1978. 3、And arriving in the year 1997, the number was reduced to50millions. 第二段:解释图表变化原因 主题句:Several factors contribute to the sharp decrease of the below-poverty population. 扩展句:1、The reform and opening following 1978 enabled the peasants to become much better off. (原因1) 2、And with the development of Chinese economy, that policy also improved city dwellers lives greatly. (原因2) 3、Furthermore, the high-tech introduced made it possible for the countrys economy as a whole to take off. (原因3) 4、All these result in the great fall of the Chinesepopulationbelow the poverty line.
考研英语分类归纳
考研英语分类归纳
【作文】 1、As is known to all 众所周知 例如:As is known to all,china is a developing country. 2、be driven by an array of forces:表达原因 3、increasingly:表示加强程度(高级词汇) 4、Controversial(adj.)as it is,__________________is undoubtedly correct,and it is a real cause for concern.尽管有争议,但_____________无疑是正确的,这的确引起了忧虑。 5、all roads lead back to:一切可追溯到 6、The temptation today is to think of sth as sth:当今,人们非常倾向于将……看作是…… 7、……,combined with……,have resulted in……:……加上……导致了(两个原因导致的结果) 8、It is not yet clear ……:……还不清楚 9、Part of the issue is that……;Part of the issue is that……;another factor may be that……:部分原因是,部分原因是,另一个因素是(三个原因) 10、There is one step ……could take that……:……可以采取的措施是…… 11、There are many reasons……,fundamentally……:有许多原因……根本原因是……
考研英语图表作文写作常识50例资料
考研英语图表作文写作常识50例 一、图表作文写作常识 1、图形种类及概述法: 泛指一份数据图表:a data graph/chart/diagram/illustration/table 饼图:pie chart 直方图或柱形图:bar chart/histogram 趋势曲线图:line chart/curve diagram 表格图:table 流程图或过程图:flow chart/sequence diagram 程序图:processing/procedures diagram 2、常用的描述用法 The table/chart diagram/graph shows (that) According to the table/chart diagram/graph As (is) shown in the table/chart diagram/graph As can be seen from the table/chart/diagram/graph/figures, figures/statistics shows (that)…… It can be seen from the figures/statistics We can see from the figures/statistics It is clear from the figures/statistics It is apparent from the figures/statistics table/chart/diagram/graph figures (that)…… table/chart/diagram/graph shows/describes/illustrates how…… 3、图表中的数据(Data)具体表达法
考研英语二图表作文范文和核心词汇
考研英语二图表作文预测:全国出境游 Topic 3: The boom of overseas traveling industry From the bar chart given above, we can observe that the number of people traveling abroad experienced some changes during the past several years. From 1999 to 2000, the number of Chinese people traveling abroad increased rapidly from 7.5 million to 10 million, and then to 12.1 million in 2001. The bar chart reveals that people in mounting numbers are going to travel abroad. What exactly contribute to this phenomenon? Reasons can be listed as follows: for one thing, the authorities have issued some preferential policies to promote the development of the overseas tourism industry, which encourages a sudden emergence of travel agencies that can provide customers with convenient overseas tourism services. Additionally, with the improvement of financial status and purchasing power, a considerable number of Chinese people can afford the once-deemed-expensive traveling expenses. Last but not least, as there exists huge difference in cultures, customs and landscapes between China and overseas countries, quite a few people hold that overseas traveling is not only a perfect way to relax oneself, but also enrich their knowledge and expand their horizons. By observing the past trends, we may forecast that the growth tendency will continue. However,it is also a highly variable industry
图表类英语作文范文
图表类英语作文范文 图表类型的英语写作如果不擅于观察漫画的话,作文写出来可能会偏题。下面是小编给大家带来图表类英语作文,供大家参阅! 图表类英语作文范文篇1第一段:说明图表 开篇句:As the bar chart shows, ____ during the years of ____to____. 扩展句:1、As early as _____. 2、Then _____ years later, ____. 3、And arriving in the year ____, ____. 第二段:解释图表变化原因 主题句:Several factors contribute to _____. 扩展句:1、______. (原因1) 2、And ______.(原因2) 3、Furthermore, ______ (原因3) 4、All these result in ____. 第三段:提出解决办法 结尾句:However, ____ is faced with some problems. 扩展句:1、With _____, ____, the effect of which is not only discouraging, but also challenging. 2、So my principle is to pay due attention to ___, but not
justto____. 示范 第一段:说明图表 开篇句:As the bar chart shows, the number of people below the poverty line decreased dramatically during the years of 1978 to1997. 扩展句:1、As early as 1978, about 250 million people were under the poverty line. 2、Then seven years later, the number became three fifths thatof1978. 3、And arriving in the year 1997, the number was reduced to50millions. 第二段:解释图表变化原因 主题句:Several factors contribute to the sharp decrease of the below-poverty population. 扩展句:1、The reform and opening following 1978 enabled the peasants to become much better off. (原因1) 2、And with the development of Chinese economy, that policy also improved city dwellers lives greatly. (原因2) 3、Furthermore, the high-tech introduced made it possible for the countrys economy as a whole to take off. (原因3) 4、All these result in the great fall of the
考研英语写作词汇整理
考研英语写作词汇整理 目前距离21考研还有170多天了,单词记得咋样了?考研单词分为阅读词汇跟写作词汇,阅读词汇在文章中看到能知道意思就好,写作词汇就要求我们要记住拼写,会运用,所以写作词汇除了记住之外,还需要自己默写,还会造句~这就需要我们平时在做阅读的时候收集好词好句,为后期写作文做准备,可能有的同学说我背模板,背模版是没错,如果在背模版的基础上加上自己的同学,改成适合自己的东西,那么你的作文肯定更能拿高分。 好了,说了这么多,就是希望你在复习的时候多积累一点写作词汇~ 下面是雷哥考研整理的一部分写作词汇。看看你认识多少个~ 1. previous [?pri?vi?s] adj. 先前的; 以往的; (时间上)稍前的 【写作例句】 There are no previous statistics for comparison. 没有先前的统计数据可供比较。 2. appreciate [??pri??ie?t] v. 欣赏; 赏识; 重视; 感激; 感谢; 欢迎; 理解; 意识到; 领会 【写作例句】 Your earliest reply will be highly appreciated. 如能早日回复,我们将不胜感激。 3. confidence [?kɑ?nf?d?ns] n. 信心; 信任; 信赖; 自信心; 秘密 【写作例句】 I have total confidence that things will change. 事情会有所改变的,我对此信心十足。 4. participate [pɑ?r?t?s?pe?t] v. 参加; 参与 【写作例句】 I would like to convey my gratitude to you for your kindness to receive me when I participated in the exchange program in USA. 我想感谢您在我参加美国交流项目时对我的热情接待。 5. region [?ri?d??n] n. (通常界限不明的)地区, 区域, 地方; 行政区; (一国除首都以外的)全部地区, 所有区域【写作例句】 This region is becoming increasingly important both strategically and economically. 这个地区的战略地位和经济地位变得越来越重要了。 6. facility [f?'s?l?ti] n. 设施; 设备; (机器等的)特别装置; (服务等的)特色; (供特定用途的)场所 【写作例句】 The hotel has special facilities for welcoming disabled people. 酒店有专门的设施来接待残疾人。
考研英语大作文写作攻略图表作文
考研英语大作文写作攻略:图表作文 .写作攻略 图表作文是考研英语写作中较为常见的题型之一,也是难度较大的一种写作题型。这类作文可综合提供题目、数据、图像、提纲,形式多样,但实际上只涉及5个方面:描述图表、指明寓意、分析原因、联系实际、给出建议,而每次考试只是从这5个方面的内容中选出3个结合在一起。从写作类型来看,基本上属于说明文。要求考生围绕题目将有关信息转化为文字形式,考生应该具有一定数据分析和材料归纳的能力,同时会运用一定的写作方法。考研试题一般以三段式写作方法来组织文章,第一段总结归纳信息反映的整体情况,点出主题思想,第二段回答第一段所得出的问题,对数字、数据等做出有条理的分析比较,第三段做出总结或给以简单的评论。表格和图表题型写作要点: (1)考生应仔细研究题目以及提示信息,认清图表中的数字、线条、阴影等部分的变化趋势和走向,抓住其主要特点,然后根据图表所显示的中心信息确定内容层次以及主题句。 (2)考生应该仔细研究图表所给出的大量信息,从中选取最重要,最有代表性的信息,然后根据全文的主旨去组织运用所获取的关键信息。切忌简单地罗列图表所给出的信息。 (3)图表作文一般采用的时态为一般现在时,但如果图表中给出了具体时间参照,考生则应对时态进行相应的调整。 (4)图表作文有一些固定句型和表达法,考生应对此融会贯通。 (5)图表作文可以细分为表格,曲线图、柱形图和饼形图。除了上述共同要点,考生还应了解这四种图在写作方面的不同特点。 -- 表格可以表示多种事物的相互关系,所以考生要对表格中所给出的大量数字进行比较分析,从中找出其变化规律。 -- 曲线图常表示事物的变化趋势,考生应认真观察坐标系所显示的数据信息,并且密切注意交汇在坐标横轴和纵轴上的数字及单位。 -- 柱形图用来表示各种事物的变化情况及相互关系,要求考生通过宽度相等的柱形的高度或长度差别来判断事物的动态发展趋势,因此考生应密切关注坐标线上的刻度单位及图表旁边的提示说明与文字。 -- 饼形图表示各事物在总体中所占的比例及相互关系,旨在要求考生准确理解并阐
级常考图表分析型英语作文
图表分析型英语作文Sample 1 More Candidates for Civil Servants 1.根据下图描述报考公务员人数变化的趋势 2.分析导致这种趋势的原因 3.你的建议 1,000,000 2003 2004 2005 As is shown in the bar chart, the number of applicants for civil servants has increased abruptly—by about 10 times, from 100,000 in 2003 to 1,000,000 in 2005. Several factors may contribute to the rush. First and foremost, working as civil servants in China is relatively stable, and Chinese people have a traditional preference for maintaining a life-long career. The rising interest could also be attributed to the unique social status. Comparatively speaking , civil servants are generally highly respected by common people in China. Last, we should not neglect the benefits such as the welfare in government departments. Compared with the striking number of applicants for becoming civil servants, the vacancies issued by the government are scarce. Thus, it is suggested that applicants should weigh their own advantages and
考研英语小作文模板总结-书信篇定稿版)
笔者考研英语作文归纳方法适合英语基础偏差对作文只要求中庸偏上分数的同学考研英语作文一般都是很多同学最后需要复习的题型。在我们的复习中很多同学都会产生误区。具体误区如下: ·只背范文不去思考,不去总结。 ·范文追求数量不追求质量。 ·范文确实背了,但是没背熟,不能脱口而出。 ·范文背熟了,没有默写训练,上考场写了好多错别字。 ·范文背熟了,默写训练了,没有实战改写,上考场还是下不了笔。 作文的复习是成体系的,循序渐进的。背范文+背模板→背的熟→会默写→会改写→实战练习。没有这一套的复习,缺少任何环节,作文都等于没有复习。所以很多同学会产生这样的误区。努力了,确实背了,背了不少,也背熟了,就是上考场写不出来。然后就开始怀疑自己的英语写作能力。从而影响考研英语的整体成绩。 所以笔者根据自身吃亏和成长的实践经验,整理一下自己的考研英语作文笔记。和大家共同分享,争取用最少的篇幅告诉大家,英语作文达到不拖后腿的程度到底是怎么回事。建议,背的模板首先不要贪多。其次要会快速的默写。再者掌握一定的语言表达模式后,以不变的表达能力应万变的题型。最后,背、默、改多多益善,坚持到上
考场前一秒。 由于记忆的连贯性,最好上考场直接对作文开刀。肯定比顺着题型做要记忆深刻的多。 小作文(10分): 复习范围(英语一、英语二考察内容相同) ·书信(重点)——全面复习,熟悉格式,掌握必要表达 ·通知(重点)——全面复习,熟悉格式,掌握必要表达 ·备忘录(基本没考过,了解格式) ·便笺(基本没考过,了解格式) 一、书信 1.格式 XXX(称呼): XXXXXXXXX.XXXXXXX.(第一段) XXXXXXXXX.XXXXXX.XXXXXX.(第二段) XXXXXXXXX.XXXXXXXXXXXXXX.(第三段) XXXX(谨启) XXXX(署名)
考研英语图表作文写作方法和模板
图表作文(一) 第一节图表作文的类型 图表作文可分为两大类:表作文和图作文。 表作文 表格(Table)可以使大量数据系统化,便于阅读、比较。表格常由标题(Title)、表头(Boxhead)(表格的第一行)、侧目(Stub)(表格左边的第一列)和主体(Body)部分(表格的其余部分)等部分组成。如下表: 用表格表达的信息具体准确,而且表格中的各项均按一定规律排列。阅读表格时要注意找出表格中各个项目的相互关系,表格中各个项目的变化规律。例如,上面的表格中的数字说明,和1978年相比,1983年大学入学的人数在增加,而小学的入学人数在减少。搞清楚这些变化规律也就读懂了表格的内容。 图作文 图作文又可分为三种:圆形图作文、曲线图作文和条状图作文。 (1) 圆形图作文 圆形图(Pie chart)也称为饼状图或圆面分割图。圆形图因为比较形象和直观,各部分空间大小差别容易分辨,所以常用来表示总量和各分量之间的百分比关系。整个圆表示总量,楔形块表示分量。有时圆形图还有数值表,两者结合可把各分量表示得更准确、清楚。例如:This is a pie chart of the average weekly expenditure of a family in Great Britain. As can be see from the chart, the main expenditure of an average British family is spent on food, which accounts for 25% of its total expenditure. The next two significant expending items are transport and housing, which are 15% and 12% respectively. If we take into account clothing and footwear, which makes up 10%, the four essentials of life, that is, food, transport, housing, and clothing and footwear, amount to 62% of the total expenditure. (2) 曲线图作文 曲线图(Line graph)也称为线性图或坐标图。曲线图最适合表示两个变量之间关系的发展过程和趋势。一般来说,曲线所呈现的形状比某一点所代表的变量的值更有意义。曲线图有横轴和纵轴。一般先看横轴所代表的数量或时间等,然后再看纵轴所显示的意义。同时必须找出线条所反映的最高或最低的变化。例如: 这个曲线图的横轴代表1990年的不同的月份,纵轴代表交通事故的数量。从交通事故曲线图上可知,前八个月的交通事故的数量有升有降。曲线图在八月份升到了最高点(39),此后一直呈下降的趋势,十二月份降到了最低点(16)。可见,1990年的交通事故的数量总体上呈下降的趋势。 (3) 条形图作文 条形图(Bar graph)也称为立柱图或圆柱图。条形图由宽度相同但长度不同的条块代表不同的量。当要比较几个项目或量时,常用不同颜色来区分。条形图主要用来表示:1)同一项目在不同时间的量;2)同一时间不同项目的量。阅读条形图时,要先看图例,再看横轴、纵横各代表什么量,每一个刻度所代表的值是多少,最后找出图中各长条所表示的数据及各长条间的相互关系。例如: 左边的条形图的横轴代表时间,纵轴代表期望寿命(Life Expectancy),这一条形图想要体现的是同一项目(期望寿命)在不同时间的量。右边的条形图的横轴也是代表时间,纵轴是代表婴儿的死亡率(Infant Mortality),这一条形图想要体现的也是同一项目(婴儿的死亡率)在不同时间的量。左边的条形图表明1990年的人均期望寿命比1960年的人均期望寿命长20岁,而1990年的婴儿死亡率比1960年的婴儿死亡率下降了50%。