英文图表写作实例

university lecturer describing the information in the graph below、You should write about 150 words、。
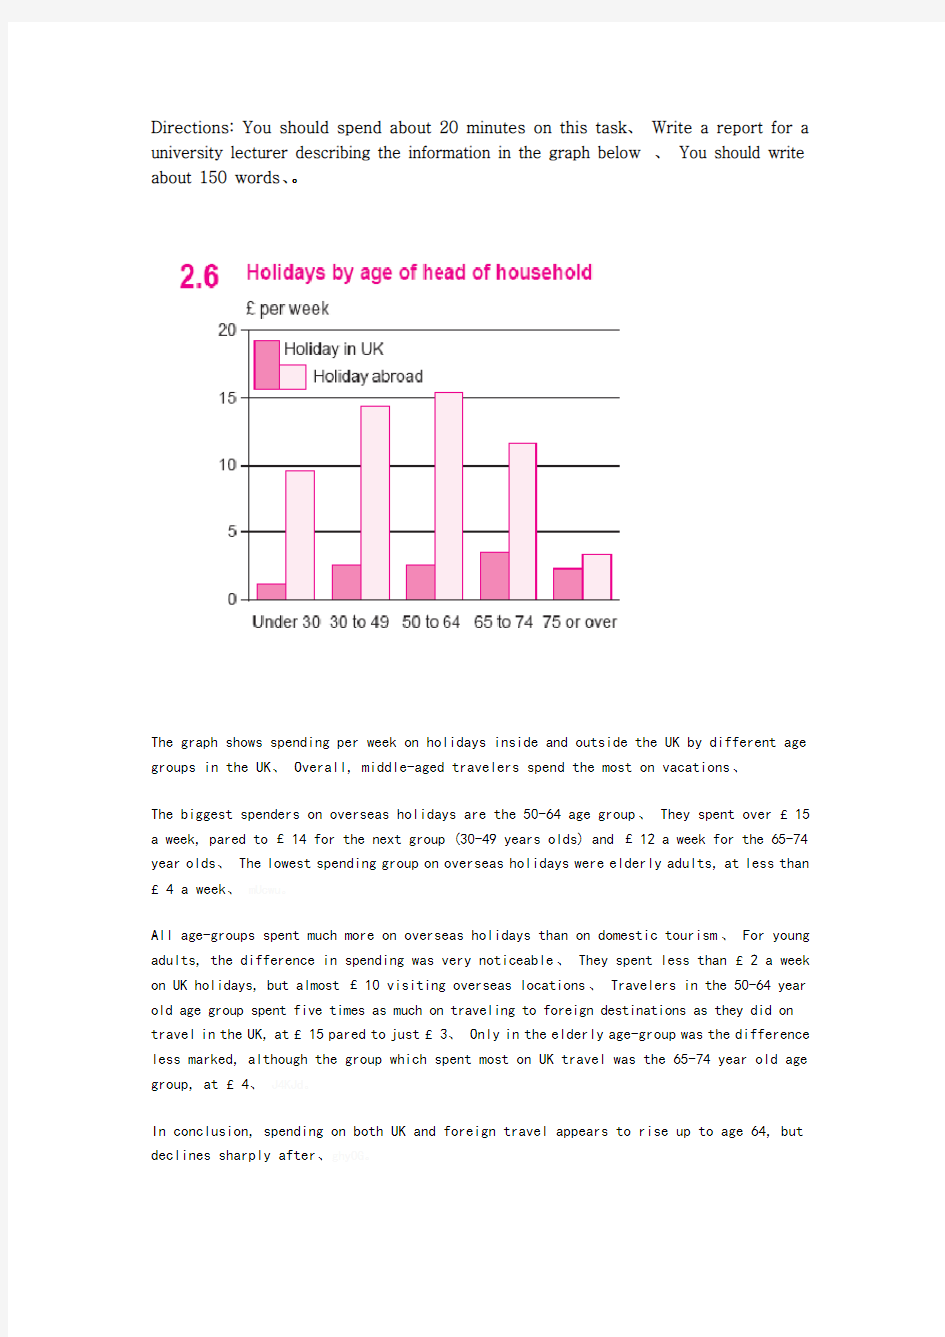
The graph shows spending per week on holidays inside and outside the UK by different age groups in the UK、 Overall, middle-aged travelers spend the most on vacations、
The biggest spenders on overseas holidays are the 50-64 age group、 They spent over £15 a week, pared to £14 for the next group (30-49 years olds) and £12 a week for the 65-74 year olds、 The lowest spending group on overseas holidays were elderly adults, at less than £4 a week、
All age-groups spent much more on overseas holidays than on domestic tourism、 For young adults, the difference in spending was very noticeable、 They spent less than £2 a week on UK holidays, but almost £10 visiting overseas locations、 Travelers in the 50-64 year old age group spent five times as much on traveling to foreign destinations as they did on travel in the UK, at £15 pared to just £3、 Only in the elderly age-group was the difference less marked, although the group which spent most on UK travel was the 65-74 year old age group, at £4、
In conclusion, spending on both UK and foreign travel appears to rise up to age 64, but declines sharply after、
a university lecturer describing the information in the graph below、 You should write about 150 words、。
different types of cars
This is a bar chart which gives information about cars、 Four different models are mentioned、
The Toyota Corolla and the Nissan Micra are both made in Japan, and have similar prices、 The former costs $15,550 while the latter is a little cheaper、 The Corolla has a bigger engine but the Micra does more gallons to the mile、 The Volkswagen Golf is made in Germany and is the most expensive of the four cars as it is priced at $18,250、 The Golf has the biggest engine size at 1600cc and is the least economical as it only does 40 miles to the gallon、 The Ford Focus is in the same price range as the Corolla and the Focus at $15,800, although it does more miles to the gallon than either of them、
The table illustrates the similarities and differences between the four cars、It shows that the Micra is the cheapest while the Golf is the most expensive、
157 words
a university lecturer describing the information in the graph below、 You should write about 150 words、。
US Farm Workers
Suggested Answer:
US Farms and Workers, 1910 to 2000
The graph shows changes in the number of farms and farm workers in the USA between 1910 and 2000、 Overall, there was a huge drop in the number
of workers and farms over the period、
The biggest change was in the number of farm workers、
In 1910 there were almost 14 million agricultural
workers in the US、 This number remained fairly stable
for twenty years, dropping only to about 13 million
in 1930、 However, between 1930 and 1975 the number
of labourers plunged、 It fell from 13 million in 1935
to just over 4 million in 1975, a drop of about 66%、
From 1970 to about 1990 the number continued to
decrease, but more slowly, and from 1990 numbers appeared to level off at about 3 million、
The number of farms followed a similar decline、 Between 1910 and 1940 the number of farms remained stable at about 6、5 million、 After 1945, the number started to drop rapidly、It fell from 6 million in 1945 to just under 3 million in 1975, a fall of 50%、 In the last twenty years of the century however, the number remained relatively stable at just over 2 million、
In conclusion, the number of farms and workers in America has plummeted over the last 100 years、 However, the drop now seems to have stabilized、
Directions: You should spend about 20 minutes on this task、 Write a report for a university lecturer describing the information in the graph below、 You should write about 150 words、
Pie Chart: The American Food Budget
The graph shows American spending on food for the home、 Overall, the biggest areas of expenditure are on meats, fish and eggs, cereals and dairy products、
The biggest percentage of spending is on meats, fish and eggs、 This totals over a quarter of the food budget、 The second biggest area is cereals and bakery products、 These account for 16% of spending、 Dairy products prise just over one-tenth of expenditure on food, while fruit and vegetables together account for almost 20% of spending、
Just under one-tenth of spending goes on beverages such as coffee, tea, and soda、 The smallest categories in the typical US food budget are fats and oils, at 3%, and sugar and sweets, at 4%、 Finally, miscellaneous food items prise 15% of purchases、
In conclusion, dairy products, cereals, meat and fish constitute more than half of expenditure, while fruits and vegetables add up to a further 20%、