《投资学》模型
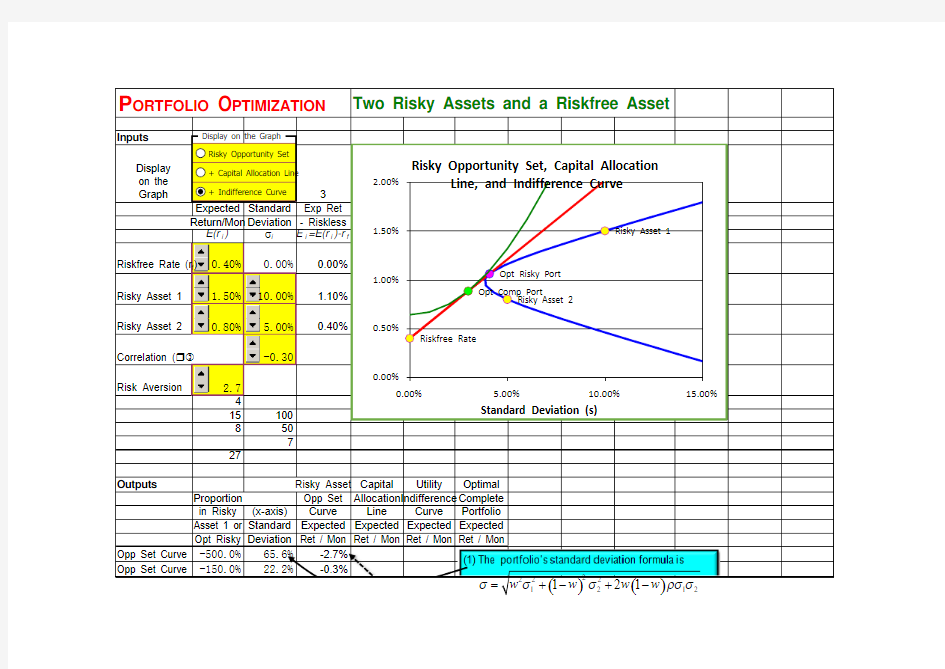
P ORTFOLIO O PTIMIZATION
Two Risky Assets and a Riskfree Asset
Inputs
Display on the Graph
3
Expected Standard Exp Ret Return/Mon Deviation - Riskless E(r i )s i E i =E(r i )-r f
Riskfree Rate (r f )0.40%0.00%0.00%Risky Asset 1 1.50%10.00% 1.10%Risky Asset 20.80%
5.00%0.40%
Correlation (r)-0.30
Risk Aversion
2.7
4151008507
27
Outputs
Risky Asset Capital Utility Optimal Proportion Opp Set AllocationIndifference Complete
in Risky (x-axis)Curve Line Curve Portfolio Asset 1 or Standard Expected Expected Expected Expected Opt Risky
Deviation Ret / Mon Ret / Mon Ret / Mon Ret / Mon
Opp Set Curve -500.0%65.6%-2.7%Opp Set Curve
-150.0%
22.2%-0.3%
Opt Comp Port
Risky Asset 2
Risky Asset 1
Opt Risky Port Riskfree Rate
0.00%
0.50%
1.00%
1.50%
2.00%
0.00%
5.00%
10.00%
15.00%
E x p e c t e d R e t u r n / M o n t h
Standard Deviation (s)
Risky Opportunity Set, Capital Allocation
Line, and Indifference Curve
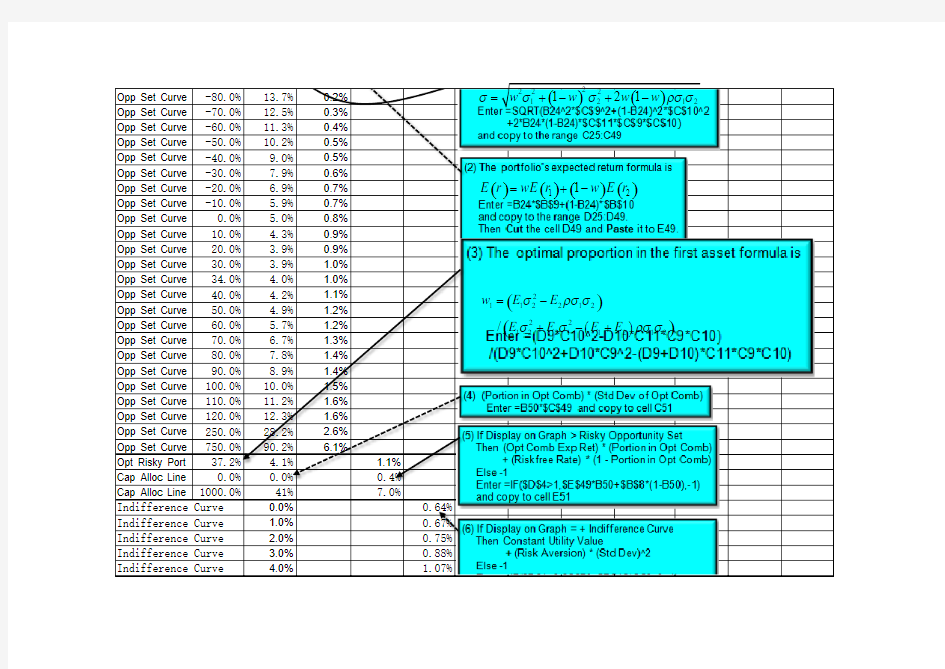
()()2
222121w w w w s s s ρs s =+-+-Risky Opportunity Set + Capital Allocation Line
+ Indifference Curve
Display on the Graph
Opp Set Curve-80.0%13.7%0.2%
Opp Set Curve-70.0%12.5%0.3%
Opp Set Curve-60.0%11.3%0.4%
Opp Set Curve-50.0%10.2%0.5%
Opp Set Curve-40.0%9.0%0.5%
Opp Set Curve-30.0%7.9%0.6%
Opp Set Curve-20.0% 6.9%0.7%
Opp Set Curve-10.0% 5.9%0.7%
Opp Set Curve0.0% 5.0%0.8%
Opp Set Curve10.0% 4.3%0.9%
Opp Set Curve20.0% 3.9%0.9%
Opp Set Curve30.0% 3.9% 1.0%
Opp Set Curve34.0% 4.0% 1.0%
Opp Set Curve40.0% 4.2% 1.1%
Opp Set Curve50.0% 4.9% 1.2%
Opp Set Curve60.0% 5.7% 1.2%
Opp Set Curve70.0% 6.7% 1.3%
Opp Set Curve80.0%7.8% 1.4%
Opp Set Curve90.0%8.9% 1.4%
Opp Set Curve100.0%10.0% 1.5%
Opp Set Curve110.0%11.2% 1.6%
Opp Set Curve120.0%12.3% 1.6%
Opp Set Curve250.0%28.2% 2.6%
Opp Set Curve750.0%90.2% 6.1%
Opt Risky Port37.2% 4.1% 1.1%
Cap Alloc Line0.0%0.0%0.4%
Cap Alloc Line1000.0%41%7.0% Indifference Curve0.0%0.64% Indifference Curve 1.0%0.67% Indifference Curve 2.0%0.75% Indifference Curve 3.0%0.88% Indifference Curve 4.0% 1.07%
()()
2
222
1212
121
w w w w
s s sρs s =+-+-
()()()()
12
1
E r wE r w E r
=+-
()
()
()
2
112212
22
12211212 /
w E E
E E E E
sρs s
s sρs s =-
+-+
Indifference Curve 5.0% 1.32% Indifference Curve 6.0% 1.61% Indifference Curve7.0% 1.96% Indifference Curve8.0% 2.37% Indifference Curve9.0% 2.83% Indifference Curve10.0% 3.34% Indifference Curve11.0% 3.91% Indifference Curve12.0% 4.53% Indifference Curve13.0% 5.20% Indifference Curve14.0% 5.93% Indifference Curve15.0% 6.72%
Opt Comp Port 3.0%0.9% Constant Utility Value0.0064
.