4-Tecplot 学习资料
University of Minnesota Supercomputing Institute Tecplot
Tecplot is a powerful interactive plotting program for visualizing and analyzing engineering and scientific data. It integrates XY plotting with two- and three- dimensional surface data-visualization capabilities into a single easy-to-use program. Tecplot allows the user to create plots with contours, iso-surfaces, mesh lines, vectors, streamlines, light-source shaded surfaces, and scatter symbols. Tecplot manuals are available in the Institute's reference library, in /usr/local/tecplot8/doc (pdf format), and on line.
Tecplot has some built in animation capabilities which produces AVI movies or raster meta files. For raster metafiles, use rm2sun or rm2mpeg to convert these to sun image files or to a mpeg movie respectively (be sure to add the imageproc module, module add imageproc).
Version:10.0-0-7
Labs: Scientific Development and Visualization Lab, Basic Sciences Computing Lab, Scientific Development and Visualization Lab-sdvlapp1, Medicinal Chemistry/Supercomputing Institute Visualization-Workstation Laboratory, Altix, IBM Power4
System(s): all UNIX workstations, Unisys, PCs in SDVL and BSCL
License: Shared U site license
Categories: Visualization, Isosurfaces, Contours, Graphs, Vector Fields, Fluid Dynamics
For more information, see https://www.360docs.net/doc/1c12295765.html,/software/tecplot/tutorial/index.html.
Last modified: Fall 1999
Introduction to Tecplot
Tecplot uses the standard X-motif interface (buttons, pull down menus, pop up windows, ...). It is very easy to use. Tecplot can be used to create graphs, draw 2-D surfaces and create contour and vector plots of 2-D data. With a point and click interface, annotation, text, lines, circles, rectangles and such, can be added. It has some capabilities for 3-D data.
With Tecplot, it is easy to create and position many graphs and plots on a single page. Each graph or plot is inside a "frame". Frames can be copied and then modified. This allows you to easily show different views of the same data set: just copy a frame and then modify it.
This is an introduction to Tecplot, not a complete manual. If you go through these pages, you will be able to draw graphs, surfaces and contours. After this, play with Tecplot: it can do far more. The principles described here apply to most of the tecplot drawing functions. With a little effort and some experimentation, you will be able to do much, much more. Most everything is accessible in more than one way, so if you cannot find something, pull down menus.
For assistance with Tecplot, contact, Barry Schaudt (schaudt@https://www.360docs.net/doc/1c12295765.html,) or help@https://www.360docs.net/doc/1c12295765.html,.
?Getting Started.
?Graphs
?Surfaces.
?Contours.
?Data Formats.
?title = "sample mesh" ?variables = "x", "y", "z" ?zone i=5, j=4, f=point
?
? 2.000000 5.000000 -19.178485 ? 4.000000 7.000000 26.279464 ? 6.000000 9.000000 24.727109 ? 8.000000 11.000000 -79.999217 ?10.000000 13.000000 42.016704 ? 2.000000 8.000000 19.787165 ? 4.000000 10.000000 -21.760844 ? 6.000000 12.000000 -32.194375 ? 8.000000 14.000000 79.248588 ?10.000000 16.000000 -28.790332 ? 2.000000 11.000000 -19.999804 ? 4.000000 13.000000 16.806681 ? 6.000000 15.000000 39.017270 ? 8.000000 17.000000 -76.911799 ?10.000000 19.000000 14.987721 ? 2.000000 14.000000 19.812147 ? 4.000000 16.000000 -11.516133 ? 6.000000 18.000000 -45.059235 ? 8.000000 20.000000 73.035620 ?10.000000 22.000000 -0.885131 ?Printing and Saving your work.
Getting Started with Tecplot
For now, you may use Tecplot from any Institute machine. Recently we have increased the user seats to unlimited number. That means you can start Tecplot nt anytime no matter how many other users have been using it.
To start Tecplot type
module add tecplot
tecplot
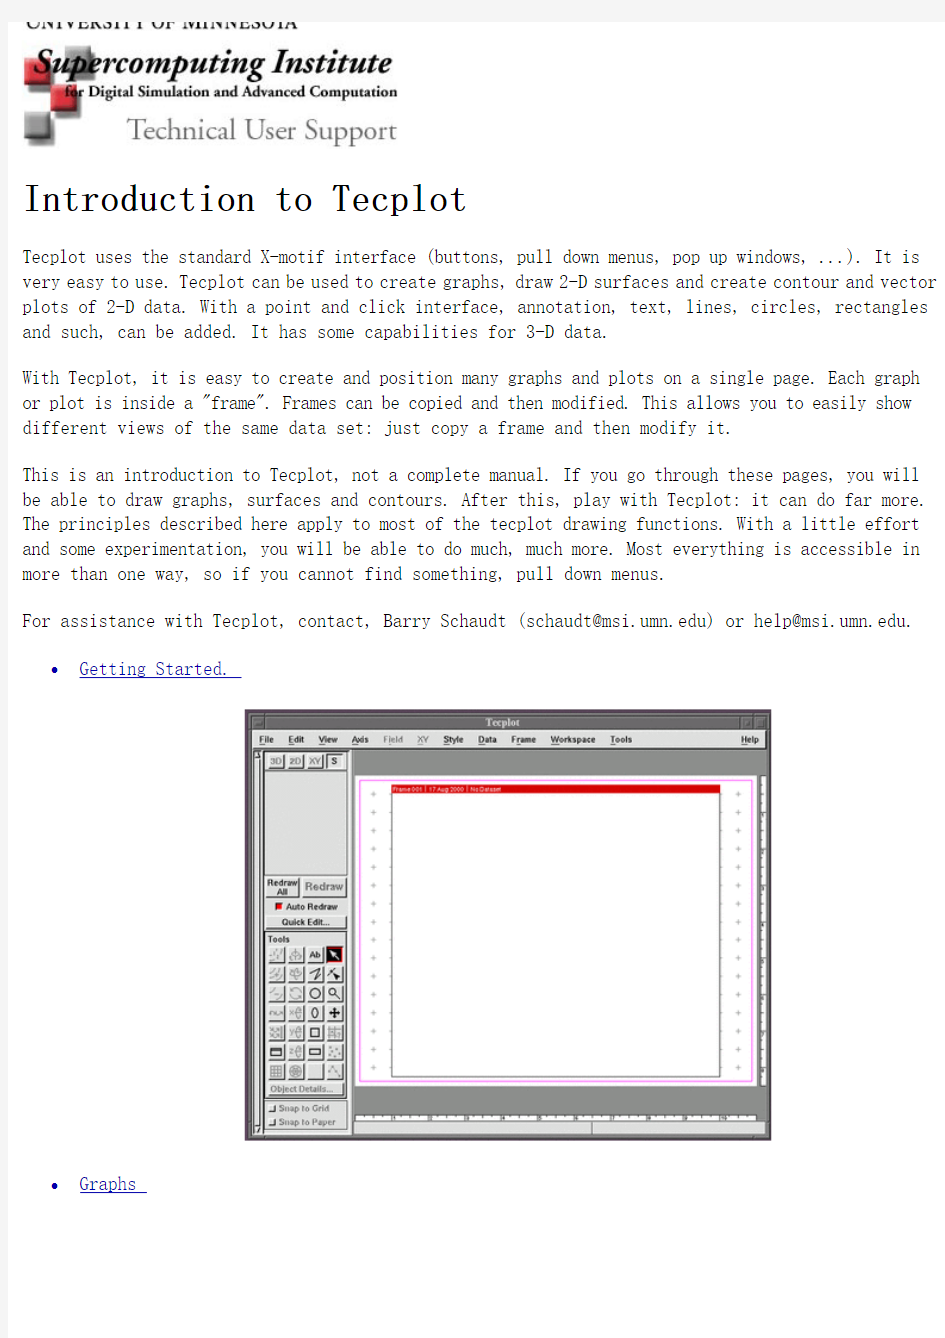
If successful, you will see the following window. (My comments are in green.)
The rest of this page consists of disjoint topics. The first 3 are the steps that I go through at the beginning of a tecplot session. The remaining are other steps that you may want to take to control the appearence of the tecplot window.
Frame Header and Border
If you want to turn off the frame header, pull the "Frame" menu down to "Edit Current Frame ...".
A window will pop up.Click on the box next to "Frame Header". Note: To see the affect of a change, click on the "Redraw" button.
The frame border can be turned off in a similar manner. When done, press "Close"
Reading in a Data File
To read in a data file, pull the "File" menu down to "Load Data File(s)...". A window will pop up. Note: The filter is set to show only files with extension "plt". To see all files, delete ".plt" from the filter and click on "Filter".
Tecplot can read several types of files . To do so, tecplot will run preplot on the file selected Working with Frames
To resize a frame, click on the arrow button in the tool pallate on the left side of the screen, click on the boundary of frame, Resize handles will appear on the frame as shown in the following figure
Using the left mouse button, drag any these resize handles.
To move a frame, choose the arrow button in the tool pallate click on the boundary of the frame that you want to move. Now move the cursor to the edge of the frame, but not on a resize handle. The cursor will change to a cross. While the cursor is a cross, use the left mouse button to move the frame
A frame may be copied. To copy a frame, click on the boundary of the frame that you want to copy, pull down the "Edit" menu to "Copy", then pull down the "Edit" menu to "Paste". The new frame is placed right on top of the old frame. Now move the new frame to the new position. This copies the data and all settings to the new frame. As shown in the following figure, either frame can be modified
Tecplot Graphs
Two Dimensional Graphs
Tecplot is very flexible when drawing graphs. It can do the following, the ones with links are discussed in this document.
?Basic XY Plots
?Assign a variable to an axis
?Change the length and scale of the axes
?Plot multiple data sets.
?Plot multiple graphs, multiple axis
?Plot multiple data sets.
?Scatter plots , with choice of symbols.
?Bar charts
?Error bars
?3D graphs
To draw a graph using tecplot, just read in your one dimensional data . The graph will appear.
There are many things that you can do with the graph. Click on the "Plot Attributes..." button. If you don't see the "Plot Attributes..." button - either "Object Details..." or "Tool Details..." appears in its place - be sure to click the arrow in the tools palette, and then click the left mouse button anywhere on the screen that is not over text, a graph or such. When you click on the "Plot Attributes..." button, you will see the following.
From this menu, you can control how the graph is plotted. The various features are broken down by category: "Definitions", "Lines", "Curves","Symbols", .... To select the category, click on the appropriate button. The categories, definitions, lines and symbols will be discused.
?Definitions: You can assign a variable to the x-axis and to the y-axis. To assign a variable to the y-axis, just click on "Y-Axis Variable". A window will pop up. Choose the variable that you to use for the vertical axis. The x-axis is handled in a similar manner.
?Lines: Select the "Lines" category to set line color, line width, line style (Solid, dotted, dashed, ...), line color and more. Just point and click.
?Symbols (Scatter Plots): To show a symbol (square, circle) at the data points, click on the box next to "Symbols" in the upper left corner of the tecplot window. If you just want to see symbols - no line connecting the points - unselect the "Lines" in the upper left corner. In the "Plot Attributes" window, click on "Symbols". You should see the following.
From here, you can select the symbol shape, outline color, fill color, size and spacing. Just click on the appropriate button. To control the spacing, click on "Symb Spacing" and then click on "Iskip=2", "Iskip=3" or "Iskip=4" which will draw the symbol at every second, third or fourth point respectively. If this is still too many. Use the "Enter Index..." option to manually enter
a skip value.
Controlling the Axis.
To adjust the axes, including tick marks, labels, and length, pull the "Axis" menu down to "Edit...". You will see the following
Across the top, is a list of axes that you can display and modify. Select the desired axis. In the above the "X1" axis is selected. A modification occurs only on the selected axis.
Here everything but range is easy to use, just remember "Labels" means the numbers that appear next to the tick marks, and "Title" means the name of the variable.
The range option can be confusing.
?If one of the axis is too long, you can change the range. There are several things to set before you change the range. Unselect "Preserve Length when Changing Range" and select "Independent".
?If you want to change the range to zoom in, select "Preserve Length when Changing Range" and select "Dependent". You may have to enter a ratio to determine the scale of the axis.
?You can also change the scale by selecting the arrow from the tools palette, clicking on an axis, then dragging a resize handle (a black square) to change the size of the plot. Note: This changes the scale of all axes.
Preserving the length keeps the axis the same length, the scale changes.
When things go wrong, pull down the "View" menu to "Data Fit". Tecplot will do its best to fit the data to the frame.
Plotting Multiple Data Sets
Tecplot can plot multiple data sets. The easiest way to plot multiple data sets is to create a file containing all the data set, each data set is a zone in the file. In the "Plot Attributes" window, you can turn on and off various zones. Just click on the desired zone (that is, click on the line that are listed by map number), or click and drag to choose multiple zones, then click on the "Map Show" button. You can then activate or deactivate the selected zone(s).
You can also plot multiple data sets that are in different files. The easiest way to do this is to read all the data sets in at once.
?Pull the "File" menu down to "Load Data File(s)...". You will see the following window.
?Click on "Multiple Files". This window will change. Enter the name of each of the file that you want to read in. Between each file either press the return key or click on the "Add" button.
When all files have been selected, press "OK".
?The first file will be plotted. To plot the other files, click on "Plot Attributes..." Select the desired data set - each data set is assigned a map number corresponding the order that you selected the data files - by clicking on the line contining the desired map or by clicking and dragging to select multiple maps. Now click on the "Map Show" button and activate or deactivate.
?You may have to pull the "View Menu" down to "Data Fit" to view all the data sets. Multiple Graphs Multiple Axes
You can show multiple axis when you have multiple data sets.
In the "Plot Attributes" window, select "Definitions". Now click on "Which Y-Axis", and redraw. That's it. You can modify the new axis by pulling down the "Axis" menu to "Edit" and selecting the appropriate axis
Three Dimensional Graphs
Tecplot can draw three dimensional graphs. Read in your data, then click on the "3D button in the upper left corner of the tecplot window, then redraw. As with 2D graphs, you can play with the axis labels, major and minor grid marks, grid background. To do so, pull down the "Axis" menu to "Edit". Click on the desired button and enter the desired settings for each axis.
Tecplot Surfaces
When data has been read in,it is easy to draw 3D meshes and surfaces, and then rotate, translate or zoom in or out.
Meshes and Surfaces.
After you have read in your data, you will see a 2D mesh. To view a 3D mesh select the "3D" button that is near the upper left corner of the tecplot window. Click "Redraw" and press ok on the warning windows that appear. You should see the 3D mesh. Here is an example.
To view a surface, turn the Mesh off (click on the red box next to mesh), turn shade on (click on the gray box next to Shade) and click on "Redraw". The shaded surface will be drawn.
For a smoother surface, click on "Plot Attributes ...". (If you see "Tool Details..." instead of "Plot Attributes... first click on the arrow in the tools palette.) A window will popup. If a zone isn't highlighted, select the desired zone by clicking on its line. Pull down the "Shade Plottype" menu as follows to "Gouraud", and press "Redraw". The gouraud shading of this surface appears later in this page.
The surface will be drawn with gouraud shading, which eliminates some of the sharp edges of the polygons that define the surface.
Rotation, Translation and Zoom.
You may rotate, translate, and zoom in or out whenever you are working with three dimensions. Select one of the x-rotate, y-rotate, z-rotate, translate or zoom button in the tools palette, as shown below, and then use the mouse with the left button to perform the operation.
If you are working with a surface, a mesh representation of the surface will appear. When done, click "Redraw" to see the surface.
For more control, click the "Tool Details..." button when one rotation, translation or zoom tool is selected. A window will pop-up. The operation is obvious. These windows can also be accessed by pulling down the "View" menu to "3D Rotate" or "Translate/Magnify".
The three buttons immediately above the x-rotate button also may be selected to perform rotations.
Tecplot Contours
Contours in 2 Dimensions
First, turn the mesh off, by clicking on the box next to "Mesh". Now click on the box next to contour "Contour". The first time that you do this for a data set, a window will pop up and you will be asked to select a contour variable. Click on the down arrow, a list of variables will appear. Click on the appropriate variable and then close the window. To view the contours, click on "Redraw"
You will see the basic contour plot in one color. You may modify this plot. Modifications include: the number of levels, color, a table and shading.
To add color to the contour plot, click on "Plot Attributes...". The following window will appear.
Pull the "Cont Color" menu down to "MultiColor" and click on "Redraw". Here is an example. (We will soon see how to add the table.)
Note that the boundary is selected. If you want the contour lines with out the boundary, click on the red box next to "Boundary" and redraw. You can fill in the contour plot with colors as shown in the following figure.
To do this, you will need the "Plot Attributes..." window shown previously on this page. Pull down the "Cont Plottype" menu to "Flood" and redraw.
3D Contour Plots
To draw a 3D contour plot, turn 3D on. Click on the "3D" button in the upper left corner of the tecplot window. Several warning windows will appear, click "OK" on each one. Once again, redraw.
Just as with 2D contour plots, there are many options. You may use contour lines, or you may fill the plot. The procedure to to this is exactly as it is in 2D. There are several examples.
?3D contour lines ("Cont Plottype" is set to "Lines")
? A 3D contour line plot was placed over the gouraud shaded surface. Note: "Contour" and "Shade"
are on.
?3D contour shaded ("Cont Plottype" is set to "Flood")
Tables
To add a table, pull down the "Field" menu, to "Contour Legend...", click on the box next to "Show Contour Legend". There are many other options that you may want to try. All options are in the "Contour Legend" window. When done with the options, redraw.
You can move the contour legend with the mouse. Cick once on the legend with the left mouse button, now use the mouse with the left mouse button to position the legend as desired.
Adjusting the Contour Levels
To adjust the contour levels, pull down the "Field" menu to "Contour Levels ...". A window will pop up. In this window you can add and delete levels. The number of levels can be changed and the levels automatically generated: Click on "Reset Levels", you will be asked to enter the number of levels. As always, redraw.
Printing and Saving your work
What output format options are available in Tecplot?
Tecplot lets you print and export your output in the following formats:
PostScript
Encapsulated PostScript
HP-GL
PNG
HTML
BMP
AVI
Sun Raster
TIFF
X11 Raster
PostScript Raster
NASA Raster Metafile
Printing
To print the image, first save it as a PostScript file, then use the appropriate lpr command to print it. Pull the "File" menu down to "Print..." Be sure "Send Output to File" is on. Look at the "Format". If it is correct - It is either Monochrome or Color - click "OK". The standard file selection window will appear. Enter a file name and click "OK".
If you want to change the format from Monochrome to Color or vice-versa, click on the "Print Setup..." button, and click on the box next to "Color" to change from monochrome to color or vice-verse. Click on "OK" and print as stated above.
Encapsulated PostScript
To save the image as as encapsulated PostScript for use in other documents, pull the "File" menu down to "Export...". A window will pop up. In this window, pull the "Format" menu down to "EPS". If you want color, be sure to click the box next to "Color". When all is set click on "OK". You will be asked to enter the name of a file.
Saving your work for future modification
To save you work for future modification, you will want to save a layout (use the file extension ".lay"). Pull the "File" menu down to "Save Layout" or "Save Layout as...". The former will update the previously save layout if you read in a layout, or ask you to enter a name if you haven't. The latter will allow you to always enter a name.
After entering a name, tecplot may want to rename a data set. You may use