VI Mason_Phase equilibria ZnO-CoO in air JACerS 2013
Phase Equilibria of the Zinc Oxide–Cobalt Oxide System in Air
Nicola H.Perry*and Thomas O.Mason**,?Department of Materials Science&Engineering,Northwestern University,2220Campus Drive,Evanston,Illinois60208
Phase equilibria of the zinc oxide–cobalt oxide system were studied by a combination of X-ray di?raction and in situ elec-trical conductivity and thermopower measurements of bulk ceramic specimens up to1000°C in air.Rietveld re?nement of X-ray di?raction patterns demonstrated increasing solubility of Co in ZnO with increasing temperature,which is supported by the slight increase in wurtzite(Zn1?x Co x O)cell volume and lattice parameter a versus temperature determined for the phase boundary compositions.Similarly,the solubility of Zn in CoO increased with increasing temperature.In contrast,the spinel phase(Zn z Co3?z O4)exhibited retrograde solubility for Zn.Electrical measurements showed that the eutectoid temper-ature for transformation of rocksalt Co1?y Zn y O into wurtzite and spinel is894±3°C,and the upper temperature limit of the stability of the spinel phase is894°C–898°C for the compositions Co/(Zn+Co)=0.82–1.The resulting composition-temperature phase diagram is presented and compared to the earlier(1955) diagram by Robin.
I.Introduction
T HE ZnO–Co3O4/CoO system is a rich source of oxides widely studied for their optical,magnetic,catalytic,and electrical properties.The end-member ZnO is an inexpensive wide bandgap,high mobility(usually)n-type semiconductor of interest for paints,coatings,cosmetics,surface-acoustic wave?lters,transparent electronics and photovoltaic cells,1 while the other end-member,Co3O4,is a(low-temperature) antiferromagnetic,p-type semiconductor used,for example, as a catalyst,2–5Li-ion battery anode,6,7and gas sensor.8 Some reports suggest that the addition of Co to ZnO increases electrical conductivity9and produces a(room-temperature)ferromagnetic semiconductor,10while extensive substitution of Zn into Co3O4produces ZnCo2O4,a p-type semiconductor related to the relatively new p-type transpar-ent conducting oxide ZnIr2O4in the Zn-d6-spinel class.11 Similar to Co3O4,ZnCo2O4has also been investigated as a battery anode12,13and catalyst,14as well as a pigment15and a hole transport layer for organic photovoltaic cells/p-type bu?er layer for inorganic cells.16The high-temperature CoO end-member,which is also p-type and antiferromagnetic, serves in glaze and enamel pigments and has been researched for its size-dependent magnetic properties.17–19A variety of crystal structures are present—in bulk form,ZnO takes the hexagonal wurtzite structure(space group P63mc);Co3O4 and ZnCo2O4are both“normal”spinels with the3+ions mostly on octahedral sites and the2+ions mostly on tetrahedral sites20(space group Fd 3m);the high-temperature cobalt oxide,CoO,has the rocksalt structure(space group Fm 3m).
Our interest in the phase equilibria originated with the goal of determining the extent of o?-stoichiometry possible in equilibrium for the ZnCo2O4compound.It has been shown that the charge carriers(holes)are generated in this compound to charge-compensate for intrinsic antisite accep-tors,Zn2+on octahedral Co3+sites21,and so the degree of o?-stoichiometry(along with the degree of inversion)is related to the number of carriers that can be produced.Simi-larly,because cation antisite defects are the majority defects in ZnCo2O4(as opposed to vacancies or interstitials),21,22o?-stoichiometry can be predicted on the basis of the formation enthalpies of the antisite defects.This relationship allowed for a comparison of the experimental spinel(Zn1àx Co2+x O4) phase boundary with that predicted from?rst-principles calculations of defect formation enthalpies in our previous work.23We later also experimentally con?rmed the theoreti-cal prediction of the existence of a wide spinel solid solution between Zn1àx Co2+x O4and Co3O4at high temperatures.20 The present work expands on these earlier?ndings by study-ing the entire ZnO–Co3O4/CoO phase diagram up to1000°C, including the upper temperature limit of stability for various compositions in the spinel solid solution,the equilibrium sol-ubilities of Co in bulk ZnO and Zn in bulk CoO at various temperatures,and the eutectoid temperature for the transfor-mation of Co1ày Zn y O rocksalt into Zn z Co3àz O4spinel and Zn1àx Co x O wurtzite.Knowledge of all of these boundaries is foundational for interpreting and optimizing the electrical, optical,and magnetic properties of equilibrium compounds in the Zn–Co–O system.
Various groups have investigated the stability of certain phases in the system.For example,Peiteado et al.24studied the thermal stability of ZnCo2O4in air,observing(similar to our previous results23and those of Robin25)that it becomes Co-rich as the temperature is increased.Echigoya et al.26reported temperature-composition“phase diagrams”(<627°C)for nonequilibrium as-sputtered and annealed thin ?lms of Zn–Co–O,with signi?cant di?erences to the bulk diagram of Robin25and to the present work,such as a greater solubility of Co into ZnO in the thin?lms.Similarly, Jayaram and Rani27,Mandal et al.28,and Straumal et al.29 have demonstrated that higher solubilities of Co into ZnO can be attained through nonequilibrium synthesis,low-temperature synthesis,and decreasing grain size,respectively. Bates et al.30determined Co solubilities in ZnO prepared by a hydrothermal route in the range500°C–800°C.Nipan et al.31published a“concentration diagram”for the Zn–Co–O system showing solubility of Zn into CoO and Co3O4and of Co into ZnO,along with a table showing observed phases for selected temperatures and compositions in the range800°C–1250°C.To the authors’knowledge,however,the only published bulk,equilibrium composition-temperature phase diagram spanning the complete ZnO–Co3O4range is the early(1955)work of Robin.25That diagram shows measured phase boundaries as solid lines and others as dashed lines (presumably schematic lines).In this article,we update the diagram to verify/modify the reported boundaries and?ll in the areas of uncertainty.
W.K.Wong-Ng—contributing editor
Manuscript No.31807.Received July25,2012;approved October22,2012.
*Member,The American Ceramic Society.
**Fellow,The American Ceramic Society.
?Author to whom correspondence should be addressed.e-mail:t-mason@northwestern.
edu
966J.Am.Ceram.Soc.,96[3]966–971(2013)
DOI:10.1111/jace.12103?2012The American Ceramic Society
J ournal
II.Experimental Approach
Given the goal of determining the equilibrium stability ranges for phases existing at and below1000°C,the low-temperature synthesis route of decomposition of aqueous (Zn,Co)nitrates was chosen.This synthesis method reduces the time required to reach equilibrium(versus solid-state processing)by intimately mixing cations in solution and thus reducing di?usion lengths required for homogeneity. (Zn(NO3)2and Co(NO3)2have similar decomposition tem-peratures,which may be advantageous for maintaining good mixing of the cations during decomposition to oxides.) Details of the aqueous processing are given elsewhere.20 After forming mixed(Zn,Co)oxide powders from the decomposition process,powders were ground in an agate mortar and pestle,and either recalcined or pressed into0.5″diam pellets at125MPa and sintered.Pellets were nested in a bed of sacri?cial powder of identical composition and within three concentric alumina crucibles for the sintering process,to minimize contamination/preferential cation volatilization.Calcining and sintering were performed in air for48–336h(typically48–60h unless equilibrium was being veri?ed;see below)at temperatures up to1000°C, followed by quenching in air for samples containing spinel or spinel+wurtzite.Samples containing the rocksalt phase(or rocksalt+wurtzite)were quenched in water to prevent oxi-dation to the spinel phase during cooling;air quenching was found to be insu?ciently rapid in these https://www.360docs.net/doc/dc5121711.html,positions (cation ratios)of select samples were veri?ed using wave-length-dispersive X-ray?uorescence with a Bruker S4 Pioneer spectrometer(Bruker AXS Inc.,Madison,WI)and found to be accurate to within2%of the target composition. Grain sizes were measured using the program ImageJ from SEM micrographs of fracture surfaces,taken using a S4800 FE-SEM(Hitachi High-Technologies,Schaumburg,IL).
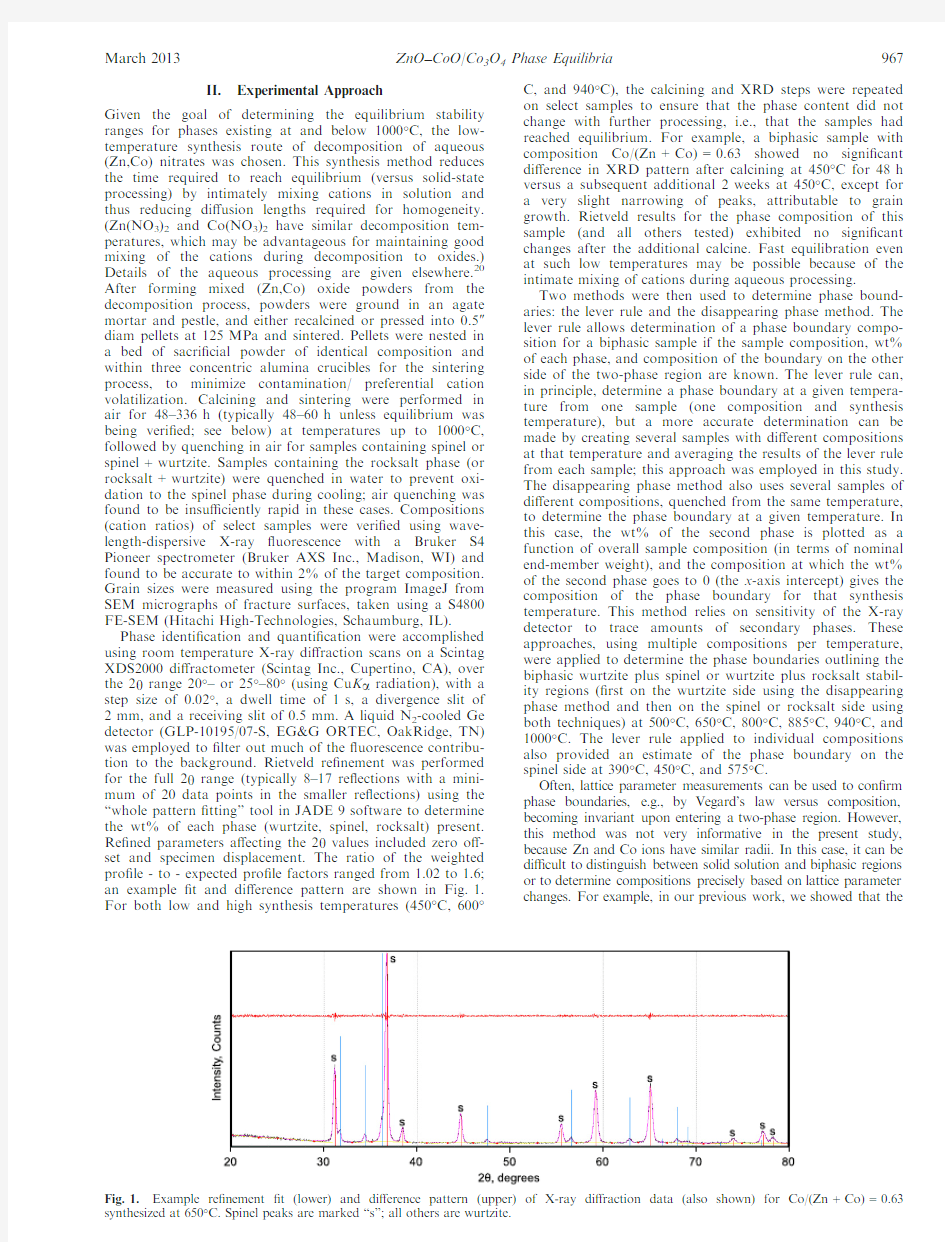
Phase identi?cation and quanti?cation were accomplished using room temperature X-ray di?raction scans on a Scintag XDS2000di?ractometer(Scintag Inc.,Cupertino,CA),over the2h range20°–or25°–80°(using Cu K a radiation),with a step size of0.02°,a dwell time of1s,a divergence slit of 2mm,and a receiving slit of0.5mm.A liquid N2-cooled Ge detector(GLP-10195/07-S,EG&G ORTEC,OakRidge,TN) was employed to?lter out much of the?uorescence contribu-tion to the background.Rietveld re?nement was performed for the full2h range(typically8–17re?ections with a mini-mum of20data points in the smaller re?ections)using the “whole pattern?tting”tool in JADE9software to determine the wt%of each phase(wurtzite,spinel,rocksalt)present. Re?ned parameters a?ecting the2h values included zero o?-set and specimen displacement.The ratio of the weighted pro?le-to-expected pro?le factors ranged from1.02to1.6; an example?t and di?erence pattern are shown in Fig.1. For both low and high synthesis temperatures(450°C,600°C,and940°C),the calcining and XRD steps were repeated on select samples to ensure that the phase content did not change with further processing,i.e.,that the samples had reached equilibrium.For example,a biphasic sample with composition Co/(Zn+Co)=0.63showed no signi?cant di?erence in XRD pattern after calcining at450°C for48h versus a subsequent additional2weeks at450°C,except for a very slight narrowing of peaks,attributable to grain growth.Rietveld results for the phase composition of this sample(and all others tested)exhibited no signi?cant changes after the additional calcine.Fast equilibration even at such low temperatures may be possible because of the intimate mixing of cations during aqueous processing.
Two methods were then used to determine phase bound-aries:the lever rule and the disappearing phase method.The lever rule allows determination of a phase boundary compo-sition for a biphasic sample if the sample composition,wt% of each phase,and composition of the boundary on the other side of the two-phase region are known.The lever rule can, in principle,determine a phase boundary at a given tempera-ture from one sample(one composition and synthesis temperature),but a more accurate determination can be made by creating several samples with di?erent compositions at that temperature and averaging the results of the lever rule from each sample;this approach was employed in this study. The disappearing phase method also uses several samples of di?erent compositions,quenched from the same temperature, to determine the phase boundary at a given temperature.In this case,the wt%of the second phase is plotted as a function of overall sample composition(in terms of nominal end-member weight),and the composition at which the wt% of the second phase goes to0(the x-axis intercept)gives the composition of the phase boundary for that synthesis temperature.This method relies on sensitivity of the X-ray detector to trace amounts of secondary phases.These approaches,using multiple compositions per temperature, were applied to determine the phase boundaries outlining the biphasic wurtzite plus spinel or wurtzite plus rocksalt stabil-ity regions(?rst on the wurtzite side using the disappearing phase method and then on the spinel or rocksalt side using both techniques)at500°C,650°C,800°C,885°C,940°C,and 1000°C.The lever rule applied to individual compositions also provided an estimate of the phase boundary on the spinel side at390°C,450°C,and575°C.
Often,lattice parameter measurements can be used to con?rm phase boundaries, e.g.,by Vegard’s law versus composition, becoming invariant upon entering a two-phase region.However, this method was not very informative in the present study, because Zn and Co ions have similar radii.In this case,it can be di?cult to distinguish between solid solution and biphasic regions or to determine compositions precisely based on lattice parameter changes.For example,in our previous work,we showed that the
re?nement?t(lower)and di?erence pattern(upper)of X-ray di?raction data(also shown)for Co/(Zn Spinel peaks are marked“s”;all others are wurtzite.
March2013ZnO–CoO/Co3O4Phase Equilibria967
lattice constant of equilibrium Co3O4barely increases as Zn is
added in up to ZnCo2O4.20(Interpolating the data in that work
suggests that a change in Zn concentration of0.05per formula unit results in a lattice parameter change in the order of10à4 A (in the spinel phase),which is below the uncertainty in the mea-
surements and?tting with this instrument.)However,we do report lattice parameters for Co-substituted ZnO in this work,as a secondary means of showing the increase in Co solubility in ZnO with increasing synthesis https://www.360docs.net/doc/dc5121711.html,ttice parameters were determined by Rietveld re?nement of XRD scans of powder samples mixed with Si powder(99.9995%,Sigma Aldrich, St.Louis,MO)as an internal standard.
The upper temperature limit of the wurtzite-spinel biphasic
region was determined from electrical measurements(simul-taneous conductivity and thermopower)versus temperature in air for a biphasic sample synthesized at800°C with the nominal composition of ZnCo2O4.Measurements were made in the thermal gradient of a tube furnace in air,in a custom-built van der Pauw sample holder with four S-type thermo-couples attached to the sides of the pellets at90°intervals. The thermocouples served both as electrical leads for voltage/ current and as temperature sensors;Pt paint was applied to the contact points on the pellet to ensure good electrical contact.Current reversal was employed to average out the contribution of thermovoltages to the conductivity measure-ments.The average temperature from the four thermocouples was taken as the sample temperature.The temperature was increased gradually($0.3°C/min),and the temperature at which the conductivity and thermopower abruptly changed was attributed to the phase transformation from spi-nel+wurtzite to rocksalt+wurtzite.Similar measurements during heating were performed on Co3O4.The upper limit of stability for the spinel phase was subsequently measured in equilibrium for one sample(Zn0.27Co2.73O4)by tracking the conductivity and thermopower over time while the tempera-ture was held constant,for several temperatures near the transition.Measurements during slow cooling were also made on Zn0.27Co2.73O4in an attempt to determine the lower limit of stability for the rocksalt Co1àx Zn x O phase(the rocksalt/spinel+rocksalt boundary).
Di?erent techniques were applied to the study of di?erent
boundaries in the diagram because of the challenges associ-
ated to each type of boundary.The in situ electrical method was chosen because of the need to determine a transition temperature quite precisely.The di?culty of quenching the rocksalt phase from temperatures near the phase boundary to room temperature for XRD measurements would lead to uncertainty about the lower temperature limit of its stability by that method.Conversely,the XRD approaches were more appropriate for the other boundaries,because a larger num-ber of samples(with?ner compositional resolution)would be required to determine the compositions of these bound-aries precisely with electrical measurements.(In addition, electrical conductivity changes were observed to be quite small going from the spinel to spinel+wurtzite stability regions.)
III.Results
In what follows,cation composition is given by C=Co/ (Zn+Co).Average grain sizes ranged from0.2l m (C=0.67)to0.6l m(C=1)for spinel-phase specimens synthesized at500°C.All the remaining specimens(wurtzite, spinel,or mixed phase wurtzite+rocksalt or wurtzite+spi-nel),synthesized above800°C,had average grain sizes larger than0.75l m,typically>1l m.In general,grain sizes $1l m or greater should be large enough to avoid grain size-dependent solubility concerns,29so the phase boundaries should represent bulk values.At500°C and below,the aver-age grain size is smaller,so some solubility enhancement can-not be ruled out.However,the negligible solubility of Co in ZnO determined at the lower temperatures is closer to reported bulk values than to nanoscale values.25,29At the higher synthesis temperatures(900°C–1000°C),the grain size (and grain size di?erence between phases)is large enough for the Brindley microabsorption correction32to the X-ray dif-fraction analysis to become nonnegligible;however,the cor-rection was found to be less than the uncertainties/error bars in the reported phase wt%.
The amount of wurtzite phase present in biphasic samples, determined from the X-ray di?raction scans,is shown in Figs.2(a)(wurtzite+spinel)and(b)(wurtzite+rocksalt) for selected synthesis temperatures.The x-axis intercept(at wt%wurtzite=0)for a given temperature gives the spinel/ spinel+wurtzite(2a)or rocksalt/rocksalt+wurtzite(2b) phase boundary composition,in terms of nominal Co3O4 weight,for the“disappearing phase”method.Similarly,the composition at which the wt%of wurtzite=100(x-axis intercept along the top axis)gives the phase boundary between wurtzite and the two-phase region,i.e.,the extent of Co solubility in ZnO,again with composition given in terms of nominal Co3O4weight.Individual data points were also used for lever rule analysis at a given temperature.It can be seen from Fig.2(a)that the spinel phase boundary composi-tion(x-axis intercept along the bottom axis)becomes more Co-rich with increasing temperature in this range.Fig-ures2(a)and(b)also show that the maximum amount of Co in the wurtzite phase increases with increasing synthesis temperature.
Lattice parameters measured for the wurtzite phase in biphasic samples,where the wurtzite composition is pinned at the phase boundary,also suggest that increasing amounts of Co can be incorporated as the synthesis tem-perature increases;Fig.3shows how the wurtzite cell vol-ume(at the phase boundary compositions)increases very
R2 = 0.9978
R2 = 0.9969
R2 = 0.9969 0
25
50
75
100
M
e
a
s
u
r
e
d
w
t
%
w
u
r
t
z
i
t
e
Composition: nominal wt% Co
3
O
4
500C
800C
885C
R2 = 1
R2 = 1 0
25
50
75
100
025*******
025******* M
e
a
s
u
r
e
d
w
t
%
w
u
r
t
z
i
t
e
Composition: nominal wt% Co
3
O
4
940C
1000C
(a)
(b)
Fig.2.Phase compositions determined from X-ray di?raction for (a)biphasic spinel–wurtzite samples and(b)biphasic rocksalt–wurtzite samples processed at various synthesis temperatures.The x-axis refers to the synthesized composition in terms of wt%of the end-member Co3O4.Uncertainties are no larger than the symbols used.
968Journal of the American Ceramic Society—Perry and Mason Vol.96,No.3
slightly as a function of synthesis temperature.The cell volume increase appears to be related to an increase in lat-tice parameter a ,while lattice parameter c decreases with increasing synthesis temperature above 800°C (see Table I).(The value of c at 650°C appears to be an outlier in com-parison with literature values for ZnO and values in this work for higher temperatures.)Overall,the changes in lattice parameters are slight (0.004 A over the composition range Co/(Zn +Co)=0–0.19),as expected from the similar ionic radii of Zn and Co.The extents of solubility (phase boundary compositions)determined for Co in ZnO at the various temperatures match well with the reported compo-sitions of Zn 1àx Co x O with similar lattice parameters,33–37although the scatter in lattice parameter values in the liter-ature precludes quantitative phase boundary composition https://www.360docs.net/doc/dc5121711.html,ttice parameters for the spinel phase versus composition were reported in our previous work.20
Results from the in situ electrical measurements during heating through the upper limit of spinel stability (in air)at $0.3°C/min are shown in Figs.4and 5.As can be seen,the conductivity increases with increasing temperature while the spinel phase is stable,but drops with the onset of the phase transformation to the rocksalt phase.The thermopow-er of the spinel phase initially decreases with increasing tem-perature,then increases as the rocksalt phase forms.Approximate transition temperatures (upper temperature limit of stability for the single phase spinel region)were 894°C for the biphasic sample (spinel composition pinned at the phase boundary)and 898°C for C =1.This upper limit of stability for pure Co 3O 4is in good agreement with pub-lished values.38
It should be noted that,when a Zn-containing spinel phase (but not the pure Co 3O 4)undergoes a transformation,there should be a ?nite temperature range over which spinel and rocksalt phases co-exist in equilibrium,according to the Gibbs phase rule.Attempts to identify the upper phase boundary of this two-phase region by slow cooling of a C =0.91specimen were unsuccessful;measurements
exhibited hysteresis relative to the heating measurements.However,equilibrium (long-hold)conductivity measurements showed spinel of this composition (C =0.91)to be stable at 895°C.The nearly ?at behavior of the lower phase boundary (894°C –898°C)suggests that the two-phase “lens”is quite narrow ([5°C).
The composition-temperature phase diagram that results from the X-ray di?raction analysis and electrical measure-ments is shown in Fig.6.With increasing temperature,the wurtzite phase can incorporate more Co,and the rocksalt phase can incorporate more Zn.The only phase to exhibit retrograde solubility is the spinel,which becomes increasingly Zn-poor with increasing temperature.There is good agree-ment between the results from the lever rule,disappearing phase method,and the electrical measurements.A schematic diagram (not to scale)illustrating the eutectoid region in more detail is shown in Fig.7.
Table I.
Lattice Parameters Measured for the Wurtzite Phase Along the Phase Boundary,for Biphasic Samples Synthesized at
Di?erent Temperatures
Synthesis temperature (°C)
Lattice parameter a ( A)
Lattice parameter c ( A)
Hexagonal cell volume ( A 3)
Pure ZnO (reported)37
3.2475–3.2501 5.2042–5.2075650 3.2499?0.0006 5.2022?0.001547.584?0.030800 3.2501?0.0001 5.2061?0.000247.625?0.002885 3.2515?0.0001 5.2041?0.000147.649?0.003940 3.2528?0.0002 5.2020?0.000547.667?0.0121000
3.2533?0.0003 5.2017?0.0004
47.678?0.011
47.5
47.6
47.7
600
700
800
900
1000
1100
H e x a g o n a l C e l l V o l . (?3)
Synthesis Temperature, C
Fig.3.Hexagonal cell volume determined for the Zn 1àx Co x O wurtzite phase at the phase boundary compositions.The change in cell volume supports the other X-ray di?raction results showing a change in phase boundary composition with synthesis temperature.
100200300
05101520
800
850
900
950
C o n d u c t i v i t y , S /c m
Temperature, C
Fig.4.In situ electrical conductivity versus temperature measured in air during heating at $0.3°C/min (range:0.31°C –0.36°C/min)to ?nd the upper temperature limit of stability for the spinel phase.
0100200300400500
800
820
840
860
880
900
920
940
T h e r m o p o w e r , V /K
Temperature, C
Fig.5.In situ thermopower values measured in air during heating at $0.3°C/min.The onset of change indicates the upper temperature limit of stability for the spinel phase.
March 2013ZnO –CoO/Co 3O 4Phase Equilibria 969
IV.Discussion
The phase diagram in this work updates the 1955diagram of Robin.25There is good agreement between the two diagrams for the low-temperature phase boundaries of wurtzite/wurtz-ite +spinel and spinel/wurtzite +spinel.At higher tempera-tures,the present work shows a slightly higher solubility of Co in wurtzite,a lower solubility of Zn in rocksalt,a higher spinel-rocksalt transition temperature (by 60°C –70°C),and a much narrower “lens”for the biphasic spinel +rocksalt https://www.360docs.net/doc/dc5121711.html,pared with the solubility of Co in bulk,polycrys-talline ZnO reported by Straumal et al.29(from aggregate data),the present work shows lower solubility of Co below 900°C and slightly higher solubility above 900°C.Table II compares phase boundaries in the work of Straumal et al.,
Robin and this study.Di?erences in processing techniques and attainment of equilibrium may be responsible for the dis-crepancies.(For example,the collected data in the work of Straumal et al.show a range of values for Co solubility in ZnO even for samples with grain size >1l m;these samples were processed by a variety of techniques including conven-tional powder sintering,Co ion implantation into ZnO sub-strates,high-pressure synthesis,and chemical vapor transport.)
Two points should be mentioned concerning the spinel sta-bility region.First,it is very di?cult to distinguish between a mechanical mixture of two spinels and a complete solid solution in this region by X-ray di?raction,because the lattice parameter is so insensitive to composition.Previous work 20using calorimetry demonstrated a complete solid solu-tion in samples processed at 800°C,but the large enthalpy of mixing observed suggests that phase separation into two spinels may occur at lower temperatures.Further work would be needed to identify the location of a solvus within the spinel region.Second,it is interesting to consider the ori-gin of the retrograde solubility of Zn in the spinel phase.In previous work 23we related the spinel phase boundary com-positions to the formation enthalpies of antisite Zn Co and Co Zn defects and their corresponding concentrations versus temperature.It is not possible to make signi?cantly Zn-rich compositions (Zn 1+x Co 2àx O 4)in equilibrium owing to the high formation enthalpy of Zn Co (Zn on an octahedral site)compared with that of Co Zn antisite defects.
V.Conclusions
In this work,a combination of X-ray di?raction analysis and in situ electrical measurements were used to determine the phase equilibria in the ZnO –Co 3O 4/CoO system in air.The resulting temperature-composition phase diagram updates the earlier diagram by Robin.25At low temperatures,the diagrams are in good agreement,but at higher temperatures the stability ranges for various solid solutions are modi?ed;namely,there is an increase in the upper temperature limit of stability for the spinel phase,a slightly higher solubility of Co in wurtzite,and a lower solubility of Zn in rocksalt.Qualitatively,however,the two diagrams are similar.Both the wurtzite Zn 1àx Co x O and rocksalt Co 1ày Zn y O phases exhibit increasing solubility of Co and Zn,respectively,with increasing temperature,while the spinel Zn z Co 3àz O 4phase shows retrograde solubility for Zn with increasing tempera-ture.Further studies are warranted to determine whether the
300
500
700
9000
0.250.50.751T e m p e r a t u r e , °C
Composition, Co/(Zn+Co)
Lever Rule
Disappearing Phase Electrical Measurements Electrical Measurements
Fig.6.Phase diagram determined from lever rule and disappearing phase analysis of X-ray di?raction patterns,?rst-principles theory 23from our previous work (the S +W/S boundary),and in situ electrical measurements.W =wurtzite Zn
1àx Co x O;R =rocksalt Co 1ày Zn y O;S =spinel Zn z Co 3àz O 4.
Fig.7.Schematic of eutectoid region in temperature-composition
phase diagram from Fig.5(not to scale).Composition markers are determined by linear extrapolation:0.77from higher temperature data along the rocksalt/rocksalt +spinel phase boundary and 0.82from slightly lower temperatures along the spinel/spinel +wurtzite boundary.Temperatures were determined from the electrical measurements (uncertainty of ?3°C owing to thermal gradient).
Table https://www.360docs.net/doc/dc5121711.html,parison of Phase Boundaries Reported for Wurtzite (W),Spinel (S),and Rocksalt (R)Phases with Those in the Present Work.Data from Straumal et al.are for Grain
Sizes >1l m
Temperature,°C
Reference
W/W +S or W/W +R Boundary,Co/(Zn +Co)
W +S /S or W +R /R Boundary,Co/(Zn +Co)
500
Straumal et al.29~0.01
(extrapolated from 530°C)
Robin 25
0(dashed line)0.69
Present work 00.67800
Straumal et al.290.067Robin 250.020.79
(dashed line)Present work
0.025
0.7551000
Straumal et al.290.12Robin 250.150.68Present work 0.195
0.745
970Journal of the American Ceramic Society—Perry and Mason Vol.96,No.3
spinel region remains a complete solid solution at low temperatures (as it is at high temperatures)or whether it phase-separates into two spinels.
Acknowledgments
The authors would like to thank Alexandra Navrotsky,Chengcheng Ma,Alex Zunger,Tula Paudel,and the rest of the Center for Inverse Design team for helpful discussions pertaining to the thermodynamics and stoichiometry of the ZnCo 2O 4–Co 3O 4spinel phase.This work was supported by the “Center for Inverse Design,”an Energy Frontier Research Center funded by the O?ce of Basic Energy Sciences,U.S.Department of Energy,under Grant No.DE-AC36-08GO28308.The X-ray di?raction work was conducted in the J.B.Cohen X-Ray Di?raction Facility supported by the MRSEC program of the National Science Foundation (Grant No.DMR-1121262)at the Materials Research Center of Northwestern University.
References
1
K.Ellmer and A.Klein,“ZnO and Its Applications”;pp.1–34in Transpar-ent Conductive Zinc Oxide:Basics and Applications in Thin Film Solar Cells ,Edited by K.Ellmer,A.Klein,and B.Rech.Springer,Verlag,New York,2008.2
C.Y.Ma,Z.Mu,J.J.Li,Y.G.Jin,J.Cheng,G.Q.Lu,Z.P.Hao,and S.Z.Qiao,“Mesoporous Co 3O 4and Au/Co 3O 4Catalysts for Low-Temperature Oxidation of Trace Ethylene,”J.Am.Chem.Soc.,132,2608–13(2010).3
B.Chi,J.Li,X.Yang,H.Lin,and N.Wang,“Electrophoretic Deposition of ZnCo 2O 4Spinel and Its Electrocatalytic Properties for Oxygen Evolution Reaction,”Electrochim.Acta ,50[10]2059–64(2005).4
M.F.Irfan,J.H.Goo,and S.D.Kim,“Co 3O 4Based Catalysts for NO Oxidation and NO x Reduction in Fast SCR Process,”Appl.Catal.B ,78,267–74(2008).5
Y.-Z.Wang,Y.-X.Zhao,C.-G.Gao,and D.-S.Liu,“Preparation and Cat-alytic Performance of Co 3O 4Catalysts for Low-Temperature CO Oxidation,”Catal.Lett.,116[3–4]136–42(2007).6
F.Cheng,Z.Tao,J.Liang,and J.Chen,“Template-Directed Materials for Rechargeable Lithium-Ion Batteries,”Chem.Mater.,20,667–81(2008).7
Y.Li,B.Tan,and Y.Wu,“Mesoporous Co 3O 4Nanowire Arrays for Lith-ium Ion Batteries with High Capacity and Rate Capability,”Nano Lett.,8[1]265–70(2008).8
W.-Y.Li,L.-N.Xu,and J.Chen,“Co 3O 4Nanomaterials in Lithium-Ion Batteries and Gas Sensors,”Adv.Funct.Mater.,15[5]851–7(2005).9
K.Koumoto,N.Aoki,N.Kitaori,and H.Yanagida,“Enhancement of Electrical Conduction in ZnO by CoO Doping,”J.Am.Ceram.Soc.,65[6],C93–4(1982).10
K.Samanta,P.Bhattacharya,R.S.Katiyar,W.Iwamoto,P.G.Pagliuso,and C.Rettori,“Raman Scattering Studies in Dilute Magnetic Semiconductor Zn 1àx Co x O,”Phys.Rev.B ,73,245213,5pp (2006).11
M.Dekkers,G.Rijnders,and D.H.A.Blank,“ZnIr 2O 4,a p-Type Trans-parent Oxide Semiconductor in the Class of Spinel zinc-d 6-Transition Metal Oxide,”Appl.Phys.Lett.,90,021903,3pp (2007).12
Y.Sharma,N.Sharma,G.V.Subba Rao,and B.V.R.Chowdari,“Nanophase ZnCo 2O 4as a High Performance Anode Material for Li-Ion Bat-teries,”Adv.Funct.Mater.,17,2855–61(2007).13
C.Ai,M.Yin,C.Wang,and J.Sun,“Synthesis and Characterization of Spinel Type ZnCo 2O 4as a Novel Anode Material for Lithium Ion Batteries,”J.Mater.Sci.,39,1077–9(2004).14
B.Chi,J.Li,X.Yang,H.Lin,and N.Wang,“Electrophoretic Deposition of ZnCo 2O 4Spinel and Its Electrocatalytic Properties for Oxygen Evolution Reaction,”Electrochim.Acta ,50,2059–64(2005).15
C.Lin,Y.Li,M.Yu,P.Yang,and J.Lin,“A Facile Synthesis and Char-acterization of Monodisperse Spherical Pigment Particles With a Core/Shell Structure,”Adv.Funct.Mater.,17,1459–65(2007).16
A.Zakutayev,T.R.Paudel,P.F.Ndione,J.D.Perkins,https://www.360docs.net/doc/dc5121711.html,ny,A.Zunger,and D.S.Ginley,“Cation O?-Stoichiometry Leads to High p-Type Conductivity and Enhanced Transparency in Co 2ZnO 4and Co 2NiO 4Thin Films,”Phys.Rev.B ,85,085204,8pp (2012).
17
K.An,N.Lee,J.Park,S.C.Kim,Y.Hwang,J.-G.Park,J.-Y.Kim,J.-H.Park,M.J.Han,J.Yu,and T.Hyeon,“Synthesis,Characterization,and Self-Assembly of Pencil-Shaped CoO Nanorods,”J.Am.Chem.Soc.,128[30]9753–60(2006).18
M.Ghosh,E.V.Sampathkumaran,and C.N.R.Rao,“Synthesis and Magnetic Properties of CoO Nanoparticles,”Chem.Mater.,17[9]2348–52(2005).19
C. F.J.Flipse, C. B.Rouwelaar,and F.M. F.de Groot,“Magnetic Properties of CoO Nanoparticles,”Eur.Phys.J.D ,9[1–4]479–81(1999).20
N.H.Perry,T.O.Mason,C.Ma,A.Navrotsky,Y.Shi,J.S.Bettinger,M.F.Toney,T.R.Paudel,https://www.360docs.net/doc/dc5121711.html,ny,and A.Zunger,“Co 3O 4-Co 2ZnO 4Spi-nels:The Case for a Solid Solution,”J.Solid State Chem.,doi:10.1016/j.jssc.2012.02.022(2012).21
J.D.Perkins,T.R.Paudel,A.Zakutayev,P.F.Ndione,P.A.Parilla,D.L.Young,https://www.360docs.net/doc/dc5121711.html,ny,D.S.Ginley,A.Zunger,N.H.Perry,Y.Tang,M.Grayson,T.O.Mason,J.S.Bettinger,Y.Shi,and M.F.Toney,“Inverse Design Approach to Hole Doping in Ternary Oxides:Enhancing p-Type Conductivity in Cobalt Oxide Spinels,”Phys.Rev.B ,84,205207,8pp (2011).22
T.R.Paudel,A.Zakutayev,https://www.360docs.net/doc/dc5121711.html,ny,M.d’Avezac,and A.Zunger,“Dop-ing Rules and Doping Prototypes in A 2BO 4Spinels,”Adv.Energy Mater.,21,4493–501,doi:10.1002/adfm.201101469(2011).23
T.R.Paudel,https://www.360docs.net/doc/dc5121711.html,ny,M.d’Avezac,A.Zunger,N.H.Perry,A.R.Naga-raja,T.O.Mason,J.S.Bettinger,Y.Z.Shi,and M.F.Toney,“Asymmetric Cation Nonstoichiometry in Spinels:Site Occupancy in Co 2ZnO 4and Rh 2ZnO 4,”Phys.Rev.B ,84,064109,11pp,doi:10.1103/PhysRevB.84.064109(2011).24
M.Peiteado,A.C.Caballero,and D.Makovec,“Thermal Evolution of ZnCo 2O 4Spinel Phase in Air,”J.Ceram.Soc.Japan ,118[5]337–40(2010).25
J.Robin,“Recherches sur la constitution et la stabilit e de quelques solu-tions solides a base d’oxyde de cobalt,”Ann.Chim.(Paris),12[1]0(1955).26
J.Echigoya,T.Sato,A.Takano,M.Mitsuhashi,K.Nonaka,Y.Haya-saka,E.Aoyagi,and M.Nishijima,“Structure and Non-Equilibrium Phase Diagram of the Co-Sputtered and Post-Annealed Co-ZnO System,”https://www.360docs.net/doc/dc5121711.html,pd.,47[1]64–9(2009).27
V.Jayaram and B.S.Rani,“Soft Chemical Routes to the Synthesis of Extended Solid Solutions of Wurtzite ZnO-MO (M =Mg,Co,Ni),”Mater.Sci.Eng.,A ,304-306,800–4(2001).28
S.K.Mandal,A.K.Das,T.K.Nath,and D.Karmakar,“Temperature Dependence of Solubility Limits of Transition Metals (Co,Mn,Fe,and Ni)in ZnO Nanoparticles,”Appl.Phys.Lett.,89,144105,3pp (2006).29
B.B.Straumal,A.A.Mazilkin,S.G.Protasova,A.A.Myatiev,P.B.Strau-mal,and B.Baretzky,“Increase of Co Solubility With Decreasing Grain Size in ZnO,”Acta Mater.,56,6246–56(2008).30
C.H.Bates,W. B.White,and R.Roy,“The Solubility of Transition Metal Oxides in Zinc Oxide and the Re?ectance Spectra of Mn 2+and Fe 2+in Tetrahedral Fields,”J.Inorg.Nucl.Chem.,28,397–405(1966).31
G.D.Nipan,V.A.Ketso,T.N.Kol’tsova,A.I.Stognii,K.I.Yanushke-vich,V.V.Pan’kov,A.M Khoviv,and A.M.Solodukha,“Solid Solutions in the Zn-Co-O System:Physicochemical Properties,”Russ.J.Inorg.Chem.,51[12]1961–7(2006).32
B.D.Cullity and S.R.Stock,Elements of X-ray Di?raction ,3rd edition.Prentice Hall,New Jersey,2001.33
L.B.Duan,W.G.Chu,J.Yu,Y.C.Wang,L.N.Zhang,G.Y.Liu,J.K.Liang,and G.H.Rao,“Structural and Magnetic Properties of Zn 1-x Co x O (0 J.L.MacManus-Driscoll,N.Khare,Y.Liu,and M.E.Vickers,“Struc-tural Evidence for Zn Interstitials in Ferromagnetic Zn 1-x Co x O Films,”Adv.Mater.,19,2925–9(2007).35 R.He,R.K.Hocking,and T.Tsuzuki,“Co-Doped ZnO Nanopowders:Location of Cobalt and Reduction in Photocatalytic Activity,”Mater.Chem.Phys.,132,1035–40(2012).36 Z.Qi,A.Li,F.Su,S.Zhou,Y.Liu,and Z.Zhao,“X-ray Di?raction Analysis of Zn 0.85Co 0.15O Powder and Thin Films,”Mater.Res.Bull.,38,1791–6(2003).37H.Morkoc ?and U .€Ozg €u r,“Zinc Oxide:Fundamentals,Materials and Device Technology ”Wiley-VCH Verlag GmbH &Co.KGaA,Weinheim,Germany,2009.38 M.Chen,B.Hallstedt,and L.J.Gauckler,“Thermodynamic Assessment of the Co-O System,”J.Phase Equilib.,24[3]212–27(2003).h March 2013ZnO –CoO/Co 3O 4Phase Equilibria 971