Kang 2013 QI Extreme drought events
Extreme drought events in the years 1877e 1878,and 1928,in the southeast Qilian Mountains and the air e sea coupling system
Shuyuan Kang,Bao Yang *,Chun Qin,Jianglin Wang,Feng Shi,Jingjing Liu
Key Laboratory of Desert and Deserti ?cation,Cold and Arid Regions Environmental and Engineering Research Institute,Chinese Academy of Sciences,Gansu Province,Lanzhou 730000,China
a r t i c l e i n f o
Article history:
Available online 13March 2012
a b s t r a c t
Droughts events have long-lasting effects on economic and social activities,particularly in the semi-arid region of northern China.In this study,four tree ring-width chronologies were developed based on lived Qilian Juniper (Sabina przewalskii Kom.)trees in the southeast Qilian Mountains,China.The four chro-nologies were developed from 164cores (82trees)for the northern marginal of the Asian summer monsoon in China.Tree growth of this area is sensitive to moisture variability of the growth season.During the last 260years,there had been extreme growth depressions in the years 1877e 1878and 1928,indicating large-scale droughts had occurred in the study area.These extreme drought events had a devastating effect not only on hydrology and agriculture,but also on society and economics.Extreme droughts in 1877e 1878and in 1928occurring in the study region and most of China were triggered by different climate regimes.The former drought distribution pattern was probably attributable to El Ni?o events,while the latter was associated with warm and cold air masses.
ó2012Elsevier Ltd and INQUA.All rights reserved.
1.Introduction
The East Asian summer monsoon climate exerts a large impact on ecosystems,human society,and moisture conditions in China (Shen et al.,2007).The strength of East Asian monsoon can lead to moisture variability of transitional regions,such as severe droughts in north China.In extreme cases,a drought disaster can cause ?ourishing societies and highly developed civilizations to collapse abruptly (Bryson and Swain,1981;Fang,1999;deMenocal,2001;Weiss and Bradley,2001;Huang et al.,2003).The deep under-standing of these problems will help to reasonably utilize water resource and provide some insight for the development of regional economy and society.
In recent years,tree rings have been employed worldwide to study climate extremes (Liu et al.,2004,2005,2010a ;Gou et al.,2007,2008;Yang et al.,2009a,b ,2010a,b ),such as droughts (Stahle et al.,1998;Liang et al.,2006;Gou et al.,2007;Liu et al.,2009;Cheng et al.,2011),hurricanes (Drew,1998),and tropical cyclone activities (Miller et al.,2006;Rodgers et al.,2006).Radial growth of trees integrates the effects of climate conditions,local site conditions,and physiological mechanisms of tree species (Fritts,1976).In the semi-arid regions of China,radial growth has
a strong correlation to the Palmer Drought Severity Index (PDSI;Palmer,1965),which was used to investigate the combined effects of temperature,precipitation and soil moisture on tree growth.PDSI is used in tree-ring based drought reconstructions in the western United States (Cook et al.,2004),in East Asia (Cook et al.,2010)and in China in the Xionglong Mountains (Fang et al.,2009)and the Qilian Mountains (Tian et al.,2007).
This paper presents four new tree ring-width chronologies from the southeast Qilian Mountains at the northern fringe of the Asian summer monsoon in China.The relationship between the tree-growth reduction and extreme drought events and the air e sea coupling system was analyzed to attempt to understand the climate forces that might cause droughts during the past 260years.2.Materials and methods 2.1.Sampling sites and climate data
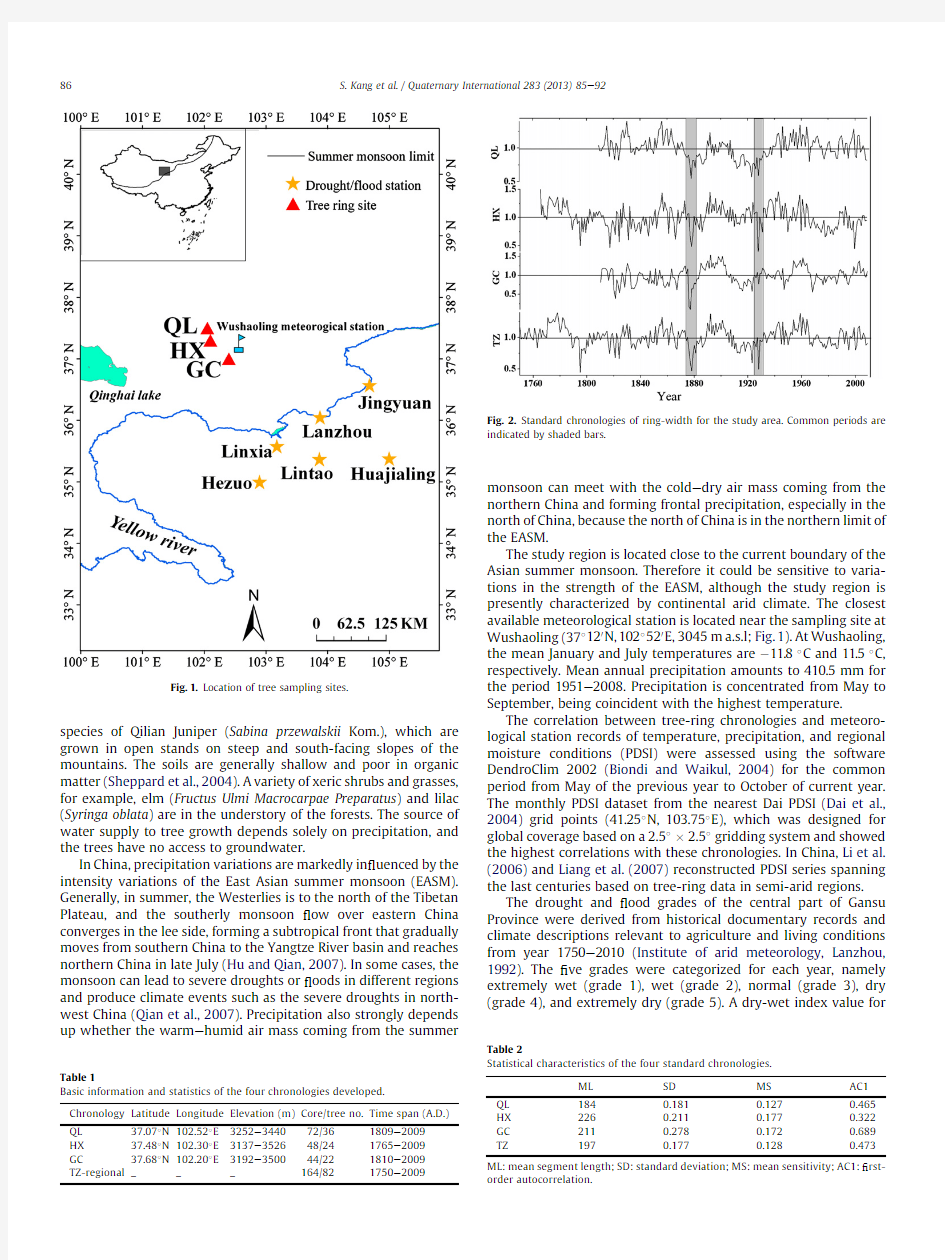
The Qilian Mountains run northwest to southeast for 800km,and the range ’s highest peak is 5808m above sea level (a.s.l.).Ring-width chronologies were developed in Tianzhu County of Gansu Province in the southeast part of the Qilian Mountains of China.From northwest to southeast of Tianzhu County,the three forest sites were selected for increment core sampling at the Qilian forest farm (hereafter QL),Haxi forest farm (hereafter HX),and Gucheng forest farm (hereafter GC)(Fig.1,Table 1).The trees are all of the
*Corresponding author.
E-mail address:yangbao@https://www.360docs.net/doc/ea8479855.html, (B.
Yang).
Contents lists available at SciVerse ScienceDirect
Quaternary International
journal h omepage:w ww.else
https://www.360docs.net/doc/ea8479855.html,/locate/quaint
1040-6182/$e see front matter ó2012Elsevier Ltd and INQUA.All rights reserved.doi:10.1016/j.quaint.2012.03.011
Quaternary International 283(2013)85e 92
species of Qilian Juniper (Sabina przewalskii Kom.),which are grown in open stands on steep and south-facing slopes of the mountains.The soils are generally shallow and poor in organic matter (Sheppard et al.,2004).A variety of xeric shrubs and grasses,for example,elm (Fructus Ulmi Macrocarpae Preparatus )and lilac (Syringa oblata )are in the understory of the forests.The source of water supply to tree growth depends solely on precipitation,and the trees have no access to groundwater.
In China,precipitation variations are markedly in ?uenced by the intensity variations of the East Asian summer monsoon (EASM).Generally,in summer,the Westerlies is to the north of the Tibetan Plateau,and the southerly monsoon ?ow over eastern China converges in the lee side,forming a subtropical front that gradually moves from southern China to the Yangtze River basin and reaches northern China in late July (Hu and Qian,2007).In some cases,the monsoon can lead to severe droughts or ?oods in different regions and produce climate events such as the severe droughts in north-west China (Qian et al.,2007).Precipitation also strongly depends up whether the warm e humid air mass coming from the summer
monsoon can meet with the cold e dry air mass coming from the northern China and forming frontal precipitation,especially in the north of China,because the north of China is in the northern limit of the EASM.
The study region is located close to the current boundary of the Asian summer monsoon.Therefore it could be sensitive to varia-tions in the strength of the EASM,although the study region is presently characterized by continental arid climate.The closest available meteorological station is located near the sampling site at Wushaoling (37 120N,102 520E,3045m a.s.l;Fig.1).At Wushaoling,the mean January and July temperatures are à11.8 C and 11.5 C,respectively.Mean annual precipitation amounts to 410.5mm for the period 1951e 2008.Precipitation is concentrated from May to September,being coincident with the highest temperature.
The correlation between tree-ring chronologies and meteoro-logical station records of temperature,precipitation,and regional moisture conditions (PDSI)were assessed using the software DendroClim 2002(Biondi and Waikul,2004)for the common period from May of the previous year to October of current year.The monthly PDSI dataset from the nearest Dai PDSI (Dai et al.,2004)grid points (41.25 N,103.75 E),which was designed for global coverage based on a 2.5 ?2.5 gridding system and showed the highest correlations with these chronologies.In China,Li et al.(2006)and Liang et al.(2007)reconstructed PDSI series spanning the last centuries based on tree-ring data in semi-arid regions.The drought and ?ood grades of the central part of Gansu Province were derived from historical documentary records and climate descriptions relevant to agriculture and living conditions from year 1750e 2010(Institute of arid meteorology,Lanzhou,1992).The ?ve grades were categorized for each year,namely extremely wet (grade 1),wet (grade 2),normal (grade 3),dry (grade 4),and extremely dry (grade 5).A dry-wet index value
for
Fig.1.Location of tree sampling sites.
Table 1
Basic information and statistics of the four chronologies developed.
Chronology Latitude Longitude Elevation (m)Core/tree no.Time span (A.D.)QL 37.07 N 102.52 E 3252e 344072/361809e 2009HX 37.48 N 102.30 E 3137e 352648/241765e 2009GC
37.68 N 102.20 E 3192e 350044/221810e 2009TZ-regional
_
_
_
164/82
1750e
2009
Fig.2.Standard chronologies of ring-width for the study https://www.360docs.net/doc/ea8479855.html,mon periods are indicated by shaded bars.
Table 2
Statistical characteristics of the four standard chronologies.
ML SD MS AC1QL 1840.1810.1270.465HX 2260.2110.1770.322GC 2110.2780.1720.689TZ
197
0.177
0.128
0.473
ML:mean segment length;SD:standard deviation;MS:mean sensitivity;AC1:?rst-order autocorrelation.
S.Kang et al./Quaternary International 283(2013)85e 92
86
the central Gansu Province during the extreme drought years (1877e 1878and 1928as discussed below)was determined by combining the drought/?ood grades from six stations of Lanzhou,Jingyuan,Lintao,Linxia,Huajialing and Hezuo (Fig.1).
The global surface sea temperature (SST)anomaly ?elds throughout the drought events were analyzed using the HadISST (Rayner et al.,2003)data-sets of the United Kingdom Meteoro-logical Of ?ce Hadley Centre.
2.2.Tree-ring data and chronology development
In April 2010,a total of 164cores were extracted with increment borers at breast height from 82living trees along an altitude ranging from 3137to 3500m.All the cores were air dried and mounted on grooved sticks with transverse surfaces facing up (Phipps,1985).Cores were prepared with razor blades to expose ring details to cellular level (Stokes and Smiley,1968).A LINTAB 6measuring system was used to register ring widths at a resolution of 0.01mm,and visual inspection facilitated crossdating of all series using the software package TSAP-Win (Rinn,2003).The quality of visual crossdating was further checked by the COFECHA program (Holmes,1983).These methods ensure the exact dating for each ring-width series.
The program ARSTAN (Cook,1985)was used to develop ring-width chronologies,and a data-adaptive power transformation was applied prior to standardization in order to remove bias caused by so-called heteroscedasticity (Cook and Peters,1997).There is a biological trend inherent in the raw data series,which is removed by a cubic spline function,subject to a 50percent frequency e response cutoff equal to 67percent of the series length.The residual (or difference)between the transformed ring-width measurements and the ?tted spline functions allows calculation of the ?nal tree-ring chronology.
The biweight robust mean is computed for each of the detrended series,which can then be averaged to chronologies (Cook and Kairiukstis,1990).To account for changes in variance attributable to the decline in sample size with time,variance stabilization (Osborn et al.,1997)was applied.The sample size was smaller for the early portion of the tree-ring chronology;thus the subsample signal strength statistic (SSS;Wigley et al.,1984)was calculated using a 30-year moving window with 15-year overlaps to determine the most reliable time span of the chronology.
As a result,the STD version was chosen for further analysis (Fig.2)based on the SSS threshold value exceeding 0.85,and several descriptive statistics were calculated for the standard chronologies (Table 2).3.Results and discussion
3.1.The growth depression in the 1877e 1878and 1928and climate signals recorded in tree rings
Some common patterns were observed from the tree-ring chronologies shown in Fig.2over the last 260years.The most signi ?cant growth decline in 1878and 1928is found compared with other periods in QL and HX chronologies.For the GC
Table 3
Inter-correlations of the four chronologies for the common period 1809e 2009.
QL
HX GC
TZ
QL 1.00HX 0.41 1.00GC 0.400.39 1.00TZ
0.83
0.75
0.73
1.00
Fig.3.Correlation function analysis of region ’s TZ chronology:to temperature (solid bars)and precipitation (light bars)measure at the Wushaoling meteorological station.The asterisks indicate the correlations at or over 95%con ?dence
levels.
Fig.4.Relationship of four chronologies and monthly PDSI of current year during 1951e 2004.
Table 4
Calculated lengths of non-soaking rain days in 1877e 1878recorded by historical documents (Zhang,2004b ;Zhang and Liang,2010).County,province
Length (1877)/days Length
(1877e 1878)/days Historical records
(in the lunar calendar)
Gaoping,Shanxi z 160>330No rain from June 1877to May 1878
Linyi,Shanxi >250e No rain after March
Kaifeng,Henan 170285No rain from June 1877to March 1878
Fangcheng,Henan >200>300No rain from May to following March
Mianchi,Henan 240>300No rain from spring to following March
Huayin,Shaanxi
250340No rain from April 1877to March 1878
Tianshui,Gansu
e
>200
No rain from May to the end of the year
S.Kang et al./Quaternary International 283(2013)85e 92
87
chronology,the growth depression is exhibited in 1877,which is earlier than that in QL and HX chronologies,and growth depression in 1928is not more signi ?cant than that two sites.
Inter-correlations among these chronologies are all signi ?cant at 0.01levels (Table 3),further suggesting strong coherence of large-scale tree growth in the Qilian Mountains.Among these common growth anomaly signals,chronologies of three sites were combined into one regional chronology by simple average and named TZ chronology (Fig.2,Table 3).The TZ chronology also has a signi ?cant correlation with the other three chronologies.The most striking feature is the tree-growth reductions in 1878and 1928.There is no doubt that the extremely narrow rings occurred in 1877e 1878and 1928in the study region.
As shown in Fig.3,signi ?cant correlations (at 95%con ?dent level)with temperature at Wushaoling were found in May of the previous year (r ?à0.242),March (r ?0.243)and May (r ?à0.32)
Table 5
Instrumental precipitation data from eight stations in western China for the year 1928(Tang et al.,2007).Stations
Xi ’an Lanzhou Tianshui Xifeng Wudu Wuwei Zhangye Jiuquan Annual precipitation in the 1928(mm)100100138112194231912Mean annual precipitation (mm)580.4326.6536.4555.3485.6115.3130.386.5Departures (%)
à83
à69
à74
à80
à60
à80
à85
à
86
Fig.5.Spatial drought patterns in 1877,1878(a)and 1928(b)of Asia,negative PDSI values indicate dry conditions and positive values indicate wet conditions.The black rectangle indicates the sampling area.
S.Kang et al./Quaternary International 283(2013)85e 92
88
of current year for the period 1951e 2008.The precipitation at Wushaoling in early growing season is positively correlated with tree growth,especially in February (r ?0.379),March (r ?0.314)and April (r ?0.34)for the time period 1951e 2004.The PDSI integrates rainfall and temperature records from prior to current growing seasons.
Moisture variation is the major limiting factor of tree growth in the study region.Tree rings showed a little stronger correlation with the PDSI than with meteorological records.The regional moisture availability and chronologies have signi ?cant correlations at the 95%con ?dent level (Fig.4).Relatively high correlations with the TZ chronology were found in May (r ?0.426)and April (r ?0.357)of current year,which indicate that early growing season moisture is signi ?cant impact factor on tree growth in the study area,while late growth season moisture availability is less
important.
Fig.6.SST anomalies in drought years,December e February of 1877e 1878(a)and 1928(b).Anomalies were calculated with respect to the 1870e 2009mean values,from the HadISST with 1 latitude e longitude grids.
S.Kang et al./Quaternary International 283(2013)85e 9289
https://www.360docs.net/doc/ea8479855.html,rge-scale severe droughts occurring in the1877e1878and 1928in northern China
Dry-wet grade values of the central part of Gansu Province are grade5,3and5in years1877,1878and in1928,respectively.In particular,a signi?cant correlation(r?à0.365,n?252,p<0.01) was found between the TZ chronology and the?rst principal component(PC1)derived from seven moisture-sensitive ring-width chronologies(Yang et al.,2010b).This PC1series was regarded as an indicator of regional precipitation variations on the northeastern Tibetan Plateau.Higher PC1values indicate dry conditions whereas lower values re?ect wet conditions.This signi?cant correlation suggests that the drought variations between these two regions have been closely connected over the past centuries.Evidence for these drought events in1877e1878 and1928has also been found in the Great Bend of the Yellow River region(Qian et al.,2011),North China area(Liang et al.,2003; Zhang,2004a;Hao et al.,2010;Liu et al.,2010),and Jiang-Huai area (Zheng et al.,2006).Therefore,the tree-growth anomalies of the study region are likely representative of the large-scale moisture change.
Statistically,abundant historical records are available in China. During the period1876e1878,13provinces were affected by drought,including Gansu Province(Zhang and Liang,2010).There are some descriptions of long-lasting non-soaking rainfall days during this period in Shanxi,Henan,Shaanxi and Gansu provinces (Zhang,2004b;Zhang and Liang,2010),as shown in Table4.These records represented the extreme drought event occurring in the northern China during1877e1878.The population decreased in Shanxi,Shaanxi,Henan,Zhili and Shandong provinces by more than22million people(Hao et al.,2010).
The sustained drought of the1920s(Yuan,1984;Liang et al., 2003,2006;Zhang et al.,2005)and simultaneous plague of locusts caused repeated crop failures,leading to a severe famine from1927through1929in northern China;34million people suffered,and10million died as a direct consequence of this event (Deng,1937).The hydrological records of Gansu Province showed that the stream?ow had a decline of64percent compared with the mean(The Editing Committee for“The Flood/Drought Hazards in Gansu Province”,1996),and the severe drought caused the drying up of wells and springs in1928(Deng,1937).In Gansu Province,the unprecedented drought took place in the spring and summer of 1928,with a spring loss of seeds,and crops not harvested in1929 (Liu,2010).As a consequence,the repeated crop failures occurred in Shaanxi,Ningxia,Gansu and Inner Mongolia(Liang et al.,2006).In particular,the1920s mega-drought was associated with two to three million deaths and low water levels in the Yellow River Basin (Xu et al.,1997).There are no available instrumental observations for the years1877e1878in China.However,some valuable precipitation data with respect to the year1928were recorded in several stations of northwestern China(Tang et al.,2007),as shown in Table5.These stations witnessed a large-scale drought event occurring in the year1928.Especially,annual total precipitation in Lanzhou station(capital of Gansu Province,close to the study region)was100mm in1928(Table5),which is69%less than mean annual precipitation(326.6mm).
3.3.Mechanism of regional drought regimes
Fig.5was derived based on PDSI gridded data-sets(Cook et al., 2010).Negative PDSI values indicate dry conditions and positive values indicate wet conditions.The patterns of these two drought events(1877e1878and1928)are not similar.The drought of 1877e1878was widely distributed in Asia,including the study region,most of China,India,and Southeast Asia near the tropics.It is interesting to note that this drought event had a considerable impact on almost all Asia,not only the study region and northern China.In contrast,the spatial extent of the year1928drought was not larger than that of the year1877e1878drought.The most obvious difference was that Southeast Asia near the tropic was in the wet condition,whereas most of China(especially northern China)and the study region had dry conditions.The drought of 1877e1878was more severe than that of1928within the study region.Similarly,the annual ring is narrower in1877and1878than that in1928in the GC and QL sites.
The SST anomalies of the tropical Paci?c Ocean for the two drought events in the years1877e1878and1928are shown in Fig.6.Positive SST anomalies spread and intensi?ed throughout the east tropical Paci?c during1877e1878(Fig.6a).In1877e1878,the major El Ni?o events occurred(Quinn and Neal,1992).In these two years,the event strengths and El Ni?o con?dence ratings are“very strong”and5(most credible),respectively.The most dramatic impacts of this typical El Ni?o event were associated with intense and long-lasting droughts in Asia,America,and other regions.Davis (2001)estimated that some15to25million people,mostly peas-ants and rural workers,died in India and northern China during 1876e1879as a result of famine and drought-related diseases. Jakarta(Indonesia)received less than one-third of its normal rainfall from May1877through February1878(Kiladis and Diaz, 1986).Droughts also plagued Americans,as the anomalously mild 1877e1878winter in the upper Midwest and south-central Canada is another feature typical of major El Ni?o episodes(Aceituno et al., 2009).Comparing the spatial drought patterns of Asia(Fig.5a)with SST anomalies of the tropical Paci?c Ocean in1877e1878(Fig.6a),it appears that the El Ni?o event resulted in the drought condition in Asia during1877and1878.
However,in1928,the SST anomalies of Middle East Paci?c were low(Fig.6b).In this non-El Ni?o year,there was also a drought event in the study region,as well as in northern China;conversely, there was a wet condition in the tropics of Southeast Asia.This indicates that the drought event of1928in the study region was not induced by an El Ni?o event.This drought event was probably the result of the air mass coming from the summer monsoon being unable to meet with the cold e dry air mass coming from northern China and,therefore,not forming frontal precipitation.
4.Conclusions
The tree-ring chronologies spanning the last260years were established in the semi-arid areas of the northern fringe of the Asian summer monsoon in China.Analysis showed that tree rings are sensitive records of extreme drought and tree growth reduced in the years1877e1878and1928.Tree-ring analysis with reference to historical records indicated that these periods were synchronous with natural and social disruptions in China.Paci?c SST was likely a factor driving the drought pattern in monsoon Asia in years 1877e1878,and the air mass frontal activity in?uenced the drought in northern China in year1928.This research provides new insights into the extreme drought events and the atmospheric circulation patterns over the northern fringe of the Asian summer monsoon in China.Thus,it is important to further study and extend the tree-ring network in China to assess characteristics of extreme drought events and others.
Acknowledgments
The authors extend many thanks to Guest Editor Eryuan Liang and two anonymous reviewers for their valuable comments and suggestions.The study was jointly funded by the Chinese Academy of Sciences(CAS)100Talents Project(29082762),the National Basic
S.Kang et al./Quaternary International283(2013)85e92 90
Research Program of China(973Program)(No.2010CB950104),the Chinese Academy of Sciences Visiting Professorship for Senior International Scientists(Grant No.2010T1Z31,2009S1-388),and the NSFC(Grant no.41071130,41002050).
References
Aceituno,P.,Prieto,M.R.,Solari,M.E.,2009.The1877e1878El Ni?o episode: associated impacts in south America.Climatic Change92,389e416.
Biondi, F.,Waikul,K.,2004.DENDROCLIM2002:a Cttprogram for statistical calibration of climate signals in tree-ring https://www.360docs.net/doc/ea8479855.html,puters&Geo-sciences30,303e311.
Bryson,R.A.,Swain,A.M.,1981.Holocene variations of monsoon rainfall in Rajas-than.Quaternary Research16,135e145.
Cheng,F.,Yuan,Y.J.,Wei,W.S.,Yu,S.L.,Zhao,Y.,2011.Variations of long-term palmer drought index in recent354year in yili based on tree-ring record.Plateau Meteorology30,355e362.
Cook,E.R.,Kairiukstis,A.,1990.Methods of Dendrochronology:Applications in the Environmental Sciences.Kluwer Academic Press,Dordrecht.
Cook,E.R.,Peters,K.,1997.Calculating unbiased tree-ring indices for the study of climatic and environmental change.The Holocene7,361e370.
Cook,E.R.,Woodhouse,C.A.,Eakin,C.M.,Meko,D.M.,Stahle,D.W.,2004.Long-term aridity changes in the western United States.Science306,1015.
Cook,E.R.,Anchukaitis,K.J.,Buckley,B.M.,D’Arrigo,R.D.,Jacoby,G.C.,Wright,W.E., https://www.360docs.net/doc/ea8479855.html,n monsoon failure and megadrought during the last millennium.
Science328,486e489.
Cook,E.R.,1985.A time-series analysis approach to tree-ring standardization.Ph.D.
Dissertation.The University of Arizona Press,Tucson.
Dai,A.,Trenberth,K.E.,Qian,T.,2004.A global dataset of palmer drought severity index for1870e2002:relationship with soil moisture and effects of surface warming.Journal of Hydrometeorology5,1117e1130.
Davis,M.,https://www.360docs.net/doc/ea8479855.html,te Victorian Holocausts:El Ni?o Famines and the Making of the Third World.Ed.Verso,London.
deMenocal,P.B.,2001.Culture responses to climate change during the late Holo-cene.Science292,667e673.
Deng,Y.T.,1937.History of Famine Relief in https://www.360docs.net/doc/ea8479855.html,mercial Press,China. Drew,A.P.,1998.Growth rings,phenology,hurricane disturbance and climate in Cyrilla racemi?ora L.,a rain forest tree of the Luquillo Mountains.Puerto Rico.
Biotropica30,35e49.
Fang,K.Y.,Gou,X.H.,Chen,F.H.,Yang,M.X.,2009.Drought variations in the eastern part of northwest China over the past two centuries:evidence from tree rings.
Climate Research38,129e135.
Fang,X.Q.,1999.Decline of pre-historical agriculture and formation of farming-grazing transitional zone in north China:a view from climatic changes.
Journal of Natural Resources14,212e218(In Chinese with English abstract).
Fritts,H.C.,1976.Tree Rings and Climate.Academic Press,London.
Gou,X.H.,Chen,F.H.,Cook,E.R.,Jacoby,G.C.,Yang,M.X.,Li,J.B.,2007.Stream?ow variations of the Yellow River over the past593years in western China reconstructed from tree rings.Water Resources Research43(6),W06434. Gou,X.H.,Chen, F.H.,Yang,M.X.,Jacoby,G.C.,Fang,K.Y.,Tian,Q.H.,Zang,Y., 2008.Asymmetric variability between maximum and minimum tempera-tures in northeastern Tibetan Plateau:evidence from tree rings.Science in China Series D:Earth Sciences51,41e55.
Hao,Z.X.,Zheng,J.Y.,Wu,G.F.,Zhang,X.Z.,Ge,Q.S.,2010.1876e1878severe drought in North China:facts,impacts and climatic background.Chinese Science Bulletin55,3001e3007.
Holmes,R.L.,https://www.360docs.net/doc/ea8479855.html,puter-assisted quality control in tree-ring dating and measurement.Tree Ring Bulletin43,69e95.
Hu,H.R.,Qian,W.H.,2007.Identi?cation of the northernmost boundary of East Asia summer monsoon.Progress in Natural Sciences17,812e820.
Huang,C.C.,Zhao,S.C.,Pang,J.L.,Zhou,Q.Y.,Chen,S.,Li,P.H.,Mao,L.J.,Ding,M., 2003.Climatic aridity and the relocations of the Zhou culture in the southern loess plateau of China.Climatic Change61,361e378.
Institute of arid meteorology of Lanzhou,1992.Historical Climate Drought Data of Gansu Province in Year1470e1990.
Kiladis,G.,Diaz,H.F.,1986.An analysis of the1877e78ENSO episode and comparison with1982e83.Monthly Weather Review114,1035e1047.
Li,J.B.,Gou,X.H.,Cook,E.R.,2006.Tree-ring based drought reconstruction for the central Tien Shan area in northwest China.Geophysical Research Letters33, L07715.doi:10.1029/2006GL025803.
Liang,E.Y.,Shao,X.M.,Kong,Z.C.,Lin,J.X.,2003.The extreme drought in the1920s and its effect on tree growth deduced from tree ring analysis:a case study in North China.Annals of Forest Science60,145e152.
Liang,E.Y.,Liu,X.H.,Yuan,Y.J.,Qin,N.S.,Fang,X.Q.,Huang,L.,Zhu,H.F.,Wang,L.L., Shao,X.M.,2006.The1920s drought recorded by tree rings and historical documents in the semi-arid and arid areas of northern China.Climatic Change 79,403e432.
Liang,E.Y.,Shao,X.M.,Liu,H.Y.,Eckstein,D.,2007.Tree-ring based PDSI recon-struction since AD1842in the Ortindag Sand Land,east Inner Mongolia.
Chinese Science Bulletin52,2715e2721.
Liu,Y.,Shi,J.F.,Shishov,V.,Vaganov,E.,Yang,Y.K.,Cai,Q.F.,Sun,H.M.,Wang,L., Djanseitov,I.,2004.Reconstruction of May e July precipitation in the north
Helan Mountain,Inner Mongolia since AD1726from tree-ring late-wood widths.Chinese Science Bulletin49,405e409.
Liu,Y.,Cai,Q.F.,Shi,J.F.,2005.Seasonal precipitation in the south-central Helan Mountain region,China,reconstructed from tree-ring width for the past224 years.Canadian Journal of Forest Research35,2403e2412.
Liu,Y.,Bao,G.,Song,H.M.,Cai,Q.F.,Sun,J.Y.,2009.Precipitation reconstruction from Hailar pine(Pinus sylvestris var.mongolica)tree rings in the Hailar region,Inner Mongolia,China back to1865AD.Palaeogeography,Palaeoclimatology,Palae-oecology282,81e87.
Liu,Y.,Tian,H.,Song,H.M.,Liang,J.M.,2010.Tree ring precipitation reconstruction in the Chifeng e Weichang region,China,and East Asian summer monsoon variation since A.D.1777.Journal of Geophysical Research115,D06103.
doi:10.1029/2009JD012330.
Liu,J.J.,Yang,B.,Qin,C.,2010a.Tree-ring based annual precipitation reconstruction since AD1480in south central Tibet.Quaternary International236,75e81. Liu,G.H.,2010.History of Gansu(in Chinese).The People’s Publishing company of Gansu province.
Miller,D.L.,Mora,C.I.,Grissino-Mayer,H.D.,Mock,C.J.,Uhle,M.E.,Sharp,Z.,2006.
Tree-ring isotope records of tropical cyclone activity.Proceedings of the National Academy of Sciences of the United States of America103, 4294e14297.
Osborn,T.J.,Briffa,K.R.,Jones,P.D.,1997.Adjusting variance for sample-size in tree-ring chronologies and other regional mean time series.Dendrochronologia15, 89e99.
Palmer,W.C.,1965.Meteorological Drought.Weather Bureau Res.Paper45.U.S.
Department of Commerce,Washington,DC,58pp.
Phipps,R.L.,1985.Collecting,Preparing,Crossdating,and Measuring Tree Incre-ment Cores,U.S.Geological Survey Water-Resources Investigations Report, 85e4148pp.
Qian,W.H.,Lin,X.,Zhu,Y.F.,Xu,Y.,Fu,J.L.,2007.Climatic regime shift and decadal anomalous events in China.Climatic Change84,167e189.doi:10.1007/s10584-006-9234-z.
Qian,W.H.,Shan,X.L.,Chen,D.L.,2011.Droughts near the northern fringe of the East Asian summer monsoon in China during1740e2003.Climate Change.
doi:10.1007/s10584-011-0096-7.
Quinn,W.H.,Neal,V.T.,1992.The historical record of El Ni?o events.In: Bradley,R.S.,Jones,P.D.(Eds.),Climate Since1500AD.Routledge,London, pp.623e648.
Rayner,N.A.,Parker,D.E.,Horton,E.B.,2003.Global analyses of SST,sea ice,and night marine air temperature since the late nineteenth century.Journal of Geophysical Research108,4407.doi:10.1029/2002JD002670.
Rinn,F.,2003.TSAP-Win:Time Series Analysis and Presentation for Dendrochro-nology and Related Applications.Version0.55User reference.Heidelberg, Germany.https://www.360docs.net/doc/ea8479855.html,.
Rodgers,J.C.,Gamble,D.W.,McCay,D.H.,Phipps,S.,2006.Tropical cyclone signals within tree-ring chronologies from Weeks Bay national estuary and research reserve,Alabama.Journal of Coastal Research22,1320e1329.
Shen,C.M.,Wang,W.C.,Hao,Z.X.,Gong,W.,2007.Exceptional drought events over eastern China during the last?ve centuries.Climatic Change85, 453e471.
Sheppard,P.R.,Tarasov,P.,Graumlich,L.,Heussner,K.,Wagner,M.,?sterle,H., 2004.Annual precipitation since515BC reconstructed from living and fossil juniper growth of Northeast Qinghai Province,China.Climate Dynamics23, 869e881.
Stahle,D.W.,Cleaveland,M.K.,Blanton,D.B.,Therell,M.D.,Gay,D.A.,1998.The lost colony and Jamestown droughts.Science280,564e567.
Stokes,M.A.,Smiley,T.L.,1968.An Introduction to Tree-Ring Dating.The University of Chicago Press,Chicago,London.
Tang,X.,Sun,G.W.,Qian,W.H.,2007.The Research of the Northern Fringe of Asian Summer Monsoon.China Meteorological Press,Beijing.
The Editing Committee for“The Flood/Drought Hazards in Gansu Province”,1996.
The Flood/Drought Hazards in Gansu Province.Yellow River Conservancy Press, Zhengzhou.
Tian,Q.H.,Gou,X.H.,Zang,Y.,Peng,J.F.,Wang,J.S.,2007.Tree-ring based drought reconstruction(A.D.1855e2001)for the Qilian Mountains,northwestern China.
Tree-ring Research63(1),27e36.
Weiss,H.,Bradley,R.S.,2001.Archaeology-what drives societal collapse?Science 291,609e610.
Wigley,T.,Briffa,K.R.,Jones,P.D.,1984.On the average value of correlated time series,with applications in dendroclimatology and hydrometeorology.Journal of Applied Meteorology23,201e213.
Xu,G.C.,Yao,H.,Li,X.M.,1997.Climate Change in Arid and Semiarid Regions of China.China Meteorological Press,Beijing.
Yang,B.,Kan,X.C.,Liu,J.J.,Br?uning,A.,Qin,C.,2009a.Annual temperature history in southwest Tibet during the last400years recorded by tree rings.Interna-tional Journal of Climatology30,962e971.doi:10.1002/joc.1956.
Yang,B.,Kang,X.C.,Br?uning,A.,Liu,J.,Qin,C.,Liu,J.J.,2009b.A622-year regional temperature history of southeast Tibet derived from tree rings.The Holocene 20,181e190.
Yang,B.,Qin,C.,Br?uning,A.,Burchardt,I.,Liu,J.J.,2010a.Rainfall history for the Hexi Corridor in the arid northwest China during the past620years derived from tree rings.International Journal of Climatology31,1166e1176.
Yang,B.,Qin,C.,Huang,K.,Fan,Z.X.,Liu,J.J.,2010b.Spatial and temporal patterns of variations in tree growth over the northeastern Tibetan Plateau during the period AD1450e2001.The Holocene20,1235e1245.
S.Kang et al./Quaternary International283(2013)85e9291
Yuan,L.,1984.The Northwestern Drought and History of the Famine(in Chinese).
The People’s Publishing Company of Gansu Province.
Zhang, D.E.,Liang,Y.Y.,2010.A long lasting and extensive drought event over China in1876e1878.Advances in Climate Change Research1, 91e99.
Zhang,Y.,Gou,X.H.,Hu,W.,Peng,J.,Liu,P.,2005.The drought events recorded in tree ring width in Helan Mountain over past100years.Acta Ecologica Sinica25, 2121e2125.Zhang,D.E.,2004a.Variation of dry-wet climate and severe drought events as revealed in the climate records of China over the past1000years.Science and Technology Review(in Chinese)22,47e49.
Zhang,D.E.,2004b.A Compendium of Chinese Meteorological Records of the Last 3,000Years(in Chinese).Jiangsu Education Press.
Zheng,J.Y.,Wang,W.,Ge,Q.S.,2006.Precipitation variability and extreme events in eastern China during the past1500years.Terrestrial Atmospheric and Oceanic Sciences17,579e592.
S.Kang et al./Quaternary International283(2013)85e92 92
2012年北京中考数学试卷(含答案)
2012年中考数学卷精析版——北京卷 (本试卷满分120分,考试时间120分钟) 一、选择题(本题共32分,每小题4分)下面各题均有四个选项,其中只有一个是符合题意的. 3.(2012北京市4分)正十边形的每个外角等于【】 A.18?B.36?C.45?D.60? 【答案】B。 【考点】多边形外角性质。 【分析】根据外角和等于3600的性质,得正十边形的每个外角等于3600÷10=360。故选B。4.(2012北京市4分)下图是某个几何体的三视图,该几何体是【】 A.长方体B.正方体C.圆柱D.三棱柱 【答案】D。 【考点】由三视图判断几何体。
【分析】主视图、左视图、俯视图是分别从物体正面、左面和上面看,所得到的图形,由于主视图和左视图为矩形,可得为柱体,俯视图为三角形可得为三棱柱。故选D。 5.(2012北京市4分)班主任王老师将6份奖品分别放在6个完全相同的不透明礼盒中,准备将它们奖给小英等6位获“爱集体标兵”称号的同学.这些奖品中3份是学习文具,2份是科普读物,1份是科技馆通票.小英同学从中随机取一份奖品,恰好取到科普读物的概率是【】 A.1 6 B. 1 3 C. 1 2 D. 2 3 【答案】B。 【考点】概率。 【分析】根据概率的求法,找准两点:①全部等可能情况的总数;②符合条件的情况数目;二者的比值就是其发生的概率。本题全部等可能情况的总数6,取到科普读物的情况是2。∴取到科普读物的概率是 21 63 =。故选B。 6.(2012北京市4分)如图,直线AB,CD交于点O,射线OM平分∠AOD,若∠BOD=760,则∠BOM 等于【】 A.38?B.104?C.142?D.144? 【答案】C。 【考点】角平分线定义,对顶角的性质,补角的定义。 【分析】由∠BOD=760,根据对顶角相等的性质,得∠AOC=760,根据补角的定义,得∠BOC=1040。 由射线OM平分∠AOD,根据角平分线定义,∠COM=380。 ∴∠BOM=∠COM+∠BOC=1420。故选C。 7.(2012北京市4分)某课外小组的同学们在社会实践活动中调查了20户家庭某月的用电量,如下表所示: 用电量(度)120 140 160 180 200 户数 2 3 6 7 2 则这20户家庭该月用电量的众数和中位数分别是【】 A.180,160 B.160,180 C.160,160 D.180,180 【答案】A。 【考点】众数,中位数。 【分析】众数是在一组数据中,出现次数最多的数据,这组数据中,出现次数最多的是180,故这组
2013-2014学年八年级数学上册期末测试题(2)
1 / 5 2013-2014八年级数学上册 期末测试题(2) 姓名 一.选择题( 3 ×10=30分) 1.下列各式由左边到右边的变形中,是分解因式的为( )。 A 、a (x + y) =a x + a y B 、x 2-4x+4=x(x -4)+4 C 、10x 2-5x=5x(2x -1) D 、x 2-16+3x=(x -4)(x+4)+3x 2.下列运算中,正确的是( )。 A 、 x x =x 336 ? B 、3x 2÷2x=x C 、x =x 235 () D 、x+y =x y 2224+() 3.下列图形中,不是轴对称图形的是( )。 4.已知△ABC 的周长是24,且AB=AC ,又AD ⊥BC ,D 为垂足,若△ABD 的周长是 20,则AD 的长为( )。 A 、6 B 、8 C 、10 D 、12 5.8.已知m 6x =,3n x =,则 2m n x -的值为 ( )。 A 、9 B 、34 C 、12 D 、4 3 6. 当分式3 x 1-有意义时,字母x 应满足( ) A. 0=x B. 0≠x C. 1=x D. 1≠x 7.已知等腰三角形一边长为4,一边的长为6,则等腰三角形的周长为( )。 A 、14 B 、16 C 、10 D 、14或16 8.已知m 6x =,3n x =,则 2m n x -的值为( )。 A 、9 B 、34 C 、12 D 、4 3 B C D A
9.若分式22 x 9x 4x 3--+的值为0,则x 的值为( ) A .3 B.3或-3 C.-3 D.0 10. 如果把分式y x xy +中的x 和y 都扩大2倍,则分式的值( ) A 、扩大4倍; B 、扩大2倍; C 、不变; D 缩小2倍 二.填空题 ( 3 ×10=30分) 11.已知a 1-b 1 =5,则b ab a b ab a ---+2232的值是 12.一个汽车牌在水中的倒影为 , 则该车牌照号码____________。 13.若分式方程x-3 =m x+31+有增根,则这个增根的值为___________ 。 14. 已知点A (l ,-2),若A 、B 两点关于x 轴对称,则B 点的坐标为________。 15.分解因式 3322x 2-+y x y xy = ________________________。 16.1纳米=0.000000001米,7.5纳米用科学记数法表示为_______________________。 17.若等腰三角形腰上的高是腰长的一半,则这个等腰三角形的底角是____________。 18. 多项式 24a 1+加上一个单项式后,使它能成为一个整式的完全平方,那么加上的单项式可以是____________________________。(填上一个你认为正 确的即可) 19.已知x +y =1,则2211 22 ++x xy y = _______________________。 20.如图EB 交AC 于M ,交FC 于D ,AB 交FC 于N ,∠E =∠F = 90°, ∠B =∠C ,AE =AF 。给出下列结论:①∠1=∠2;②BE =CF ; ③△ACN ≌△ABM ;④CD=DN 。其中正确的结论有____________(填序号) 三、简答题:(共60分) M N A B C D E F 1 2
浙江省义乌市中考数学试卷(解析版)
2018年浙江省义乌市中考数学试卷 一、选择题(共10小题) 1.(2018义乌市)﹣2的相反数是() A.2B.﹣2C.D. 考点:相反数。 解答:解:由相反数的定义可知,﹣2的相反数是﹣(﹣2)=2. 故选A. 2.(2018义乌市)下列四个立体图形中,主视图为圆的是() ABCD 考点:简单几何体的三视图。 解答:解:A、主视图是正方形,故此选项错误; B、主视图是圆,故此选项正确; C、主视图是三角形,故此选项错误; D、主视图是长方形,故此选项错误; 故选:B. 3.(2018义乌市)下列计算正确的是() A.a3a2=a6B.a2+a4=2a2C.(a3)2=a6D.(3a)2=a6 考点:幂的乘方与积的乘方;合并同类项;同底数幂的乘法。 解答:解:A、a3a2=a3+2=a5,故此选项错误; B、a2和a4不是同类项,不能合并,故此选项错误; C、(a3)2=a6,故此选项正确; D、(3a)2=9a2,故此选项错误; 故选:C. 4.(2018义乌市)一个正方形的面积是15,估计它的边长大小在()A.2与3之间B.3与4之间C.4与5之间D.5与6之间
考点:估算无理数的大小;算术平方根。 解答:解:∵一个正方形的面积是15, ∴该正方形的边长为, ∵9<15<16, ∴3<<4. 故选C. 5.(2018义乌市)在x=﹣4,﹣1,0,3中,满足不等式组的x值是() A.﹣4和0B.﹣4和﹣1C.0和3D.﹣1和0 考点:解一元一次不等式组;不等式的解集。 解答:解:, 由②得,x>﹣2, 故此不等式组的解集为:﹣2<x<2, x=﹣4,﹣1,0,3中只有﹣1、0满足题意. 故选D. 6.(2018义乌市)如果三角形的两边长分别为3和5,第三边长是偶数,则第三边长可以是() A.2B.3C.4D.8 考点:三角形三边关系。 解答:解:由题意,令第三边为X,则5﹣3<X<5+3,即2<X<8, ∵第三边长为偶数,∴第三边长是4或6. ∴三角形的三边长可以为3、5、4. 故选:C. 7.(2018义乌市)如图,将周长为8的△ABC沿BC方向平移1个单位得到△DEF,则四边形ABFD的周长为()
【解析版】2013年北京市中考数学试卷及答案
北京市2013年中考数学试卷 一、选择题(本题共32分,每小题4分。下列各题均有四个选项,其中只有一个是符合题意的。 1.(4分)(2013?北京)在《关于促进城市南部地区加快发展第二阶段行动计划(2013﹣2015)》中,北京市提出了共计约3960亿元的投资计划,将3960用科学记数法表示应为()A.39.6×102B.3.96×103C.3.96×104D.0.396×104 考点:科学记数法—表示较大的数. 分析:科学记数法的表示形式为a×10n的形式,其中1≤|a|<10,n为整数.确定n的值时,要看把原数变成a时,小数点移动了多少位,n的绝对值与小数点移动的位数相同.当原数绝对值>1时,n是正数;当原数的绝对值<1时,n是负数. 解答:解:将3960用科学记数法表示为3.96×10³. 故选B. 点评:此题考查科学记数法的表示方法.科学记数法的表示形式为a×10n的形式,其中1≤|a|<10,n为整数,表示时关键要正确确定a的值以及n的值. 2.(4分)(2013?北京)﹣的倒数是() A.B.C. ﹣D. ﹣ 考点:倒数. 分析:根据倒数的定义:若两个数的乘积是1,我们就称这两个数互为倒数. 解答: 解:∵(﹣)×(﹣)=1, ∴﹣的倒数是﹣. 故选D. 点评:本题主要考查倒数的定义,要求熟练掌握.需要注意的是: 倒数的性质:负数的倒数还是负数,正数的倒数是正数,0没有倒数. 倒数的定义:若两个数的乘积是1,我们就称这两个数互为倒数. 3.(4分)(2013?北京)在一个不透明的口袋中装有5个完全相同的小球,把它们分别标号为1,2,3,4,5,从中随机摸出一个小球,其标号大于2的概率为()A.B.C.D. 考点:概率公式. 分析:根据随机事件概率大小的求法,找准两点:①符合条件的情况数目,②全部情况的总数,二者的比值就是其发生的概率的大小. 解答:解:根据题意可得:大于2的有3,4,5三个球,共5个球, 任意摸出1个,摸到大于2的概率是.
2013年八年级上册数学期中复习试题
A D E B 八年级上册数学期中复习试卷 1、4的算术平方根是( ) A . 2± B .2 C . D 2 、下列图形中,不是轴对称图形的是( ) . 3、黄瑶拿一张正方形的纸按下图沿虚线连续对折后剪去带直角的部分,然后打开后的形状是( ) 4、下列语句: 4 ; 2=± ③平方根等于本身的数是0和1 ; ④ , 其中正确的有( )个 A .1 B. 2 C.3 D.4 5、已知等腰三角形的一边长为4cm ,另一边为8cm ,则它的周长是( ) A 16㎝ B 20㎝ C 12㎝ D 16㎝或20㎝ 6、能根据3 50≈1.710,求出近似值的是( ) A 35000 B 3005.0- C 305.0- D 3 500 7、下列数中,无理数的个数是( ) 31-,2,0.53, 2 π , 0 , —25, —2.171171117 , 33 . A 3 B 4 C 5 D 6 8、大于32-且小于23的整数的个数有( ) A.9 B.8 C.7 D.6 9、若∠AOP=∠BOP=15°,PC ∥OA, PD ⊥OA,PC=4,则PD=( ) 10、 10、如图,在Rt ABC △中, 90=∠B ,ED 是AC 的 垂直平分线,交AC 于点D , 交BC 于点E .已知 10=∠BAE ,则C ∠的度数为( ) A . 30 B . 40 C . 50 D . 60 11、下列说法正确的是( ) A. 带根号的数是无理数 B. 无限小数是无理数 C. 4 3 是分数 D. 数轴上的点与实数一一对应 122,那么2 x =( ). A 、4 B 、16 C 、±2 D 13.下列说法正确的是( ) . A 、±4的平方根是16 B 、1的平方根是1 C 3 D 、2是2 (2)-的算术平方根 二:填空题 14、16的平方根是 ,125-的立方根是 。 15、81的算术平方根是 ,0的平方根是 ,-1的立 方根是 。 16、36-的绝对值是______。2的相反数是______。 |3.14-π|=___________。 17、点A (3,2-)关于x 轴的对称点的坐标是 。 18、若 62255-++=-+-c b a a ,则a b c +的值 为 。 19、如图,△ABC 中,∠A =50°, 将其折叠,使点A 落在边CB 上 A ′处,折痕为CD , ∠D C B =48°,则∠DB A ' 的度数为 。 20、三角形三个内角度数之比是1:2:3,最大边长是8,则它的最小边的长 21.一辆汽车的车牌号在水中的倒影是: , 那 么它的实际车牌号是: ; 22.如果一个数的立方根是它本身,那么这个数是 :23.等腰三角形的顶角是120°,底边上的中线长为4cm,则它的腰长 ; 24.点M (x-1,y+1)与M ′(2x-2,3y –2)关于X 轴对称,则:x= ,y= ; 25、如图,已知点O 是 △ABC 内一点,且点O 到三边的距离相等, ∠A=40,则∠BOC= 三、解答题: 26、计算(1)81+(-6)-3 27 (2)322 22-+ (3 (4) 213222---+ (5) ()2334 1 22027.01044.152 3-+----?- A ' B D A D C B A C O A B
【解析版一】2013年浙江省义乌市中考数学试卷及答案
浙江省义乌市2013年中考数学试卷 考生须知: 1. 全卷共4页,有3大题,24小题. 满分为120分.考试时间120分钟. 2. 本卷答案必须做在答题纸的对应位置上,做在试题卷上无效. 3. 请考生将姓名、准考证号填写在答题纸的对应位置上,并认真核准条形码的姓名、准考证号. 4. 作图时,可先使用2B 铅笔,确定后必须使用0.5毫米及以上的黑色签字笔涂黑. 5. 本次考试不能使用计算器. 温馨提示:请仔细审题,细心答题,相信你一定会有出色的表现! 参考公式:二次函数y =ax 2 +bx +c (a ≠0)图象的顶点坐标是)442(2 a b ac a b --,. 卷 Ⅰ 说明:本卷共有1大题,10小题,每小题3分,共30分.请用2B 铅笔在“答题纸”上将 你认为正确的选项对应的小方框涂黑、涂满. 一、选择题(请选出各题中一个符合题意的正确选项,不选、多选、错选,均不给分) 1. 在2,-2,8,6这四个数中,互为相反数的是 A .-2与2 B .2与8 C .-2与6 D .6与8 答案:A 解析:互为相反数的两个数绝对值相等,符号相反,所以,2与-2互为相反数。 2.如图几何体的主视图是 答案:C 解析:从正面看,下面有三个小正方形,左上有一个小正方形,所以主视图是C 。 3.如图,直线a ∥b ,直线c 与a ,b 相交,∠1=55°,则∠2= A .55° B .35° C .125° D .65° 答案:A 解析:两直线平行,同位角相等,以及由对顶角相等, 得,∠2=∠1=55°,选A 。 4.2012年,义乌市城市居民人均可支配收入约为44500元,居全 省县级市之首,数字44500用科学计数法可表示为 A .31045.4? B .41045.4? C .51045.4? D .61045.4? 答案:B 解析:科学记数法的表示形式为a×10n 的形式,其中1≤|a|<10,n 为整数.确定n 的值时, 要看把原数变成a 时,小数点移动了多少位,n 的绝对值与小数点移动的位数相同.当原数绝对值>1时,n 是正数;当原数的绝对值<1时,n 是负数 44500=41045.4? 5.两圆半径分别为2和3,圆心距为5,则这两个圆的位置关系是
2013年北京中考西城一模数学(含答案)电子版
北京市西城区2013年初三一模试卷 数 学 2013. 5 一、选择题(本题共32分,每小题4分) 下面各题均有四个选项,其中只有一个..是符合题意的. 1.3-的相反数是 A .3 1 - B . 3 1 C .3 D .3- 2.上海原世博园区最大单体建筑“世博轴”被改造成一个综合性商业中心,该项目营业面积约130 000平方米,130 000用科学记数法表示应为 A .1.3×105 B .1.3×104 C .13×104 D .0.13×106 3.如图,AF 是∠BAC 的平分线,EF ∥AC 交AB 于点 E . 若∠1=25°,则BAF ∠的度数为 A .15° B .50° C .25° D .12.5° 4.在一个不透明的盒子中装有3个红球、2个黄球和1个绿球,这些球除颜色外,没有任何其他区别,现从这个盒子中随机摸出一个球,摸到黄球的概率为 A . 2 1 B . 3 1 C . 6 1 D .1 5.若菱形的对角线长分别为6和8,则该菱形的边长为 A .5 B .6 C .8 D .10 6 则该队队员年龄的众数和中位数分别是 A .16,15 B .15,15.5 C .15,17 D .15,16 7.由一些大小相同的小正方体搭成的一个几何体的三视图如图所示,则构成这个几何体 的小正方体共有 A .6个 B .7个 C .8个 D .9个
8.如图,在矩形ABCD 中,AB=2,BC=4.将矩形ABCD 绕点C 沿顺时针方向旋转90°后,得到矩形FGCE (点A 、B 、D 的对应点分别为点F 、G 、E ).动点P 从点B 开始沿BC-CE 运动到点E 后停止,动点Q 从点E 开始沿EF -FG 运动到点G 后停止,这两点的运动速度均为每秒1个单位.若点P 和点Q 同时开始运动,运动时间为x (秒),△APQ 的面积为y ,则能够正确反映y 与x 之间的函数关系的图象大致是 二、填空题(本题共16分,每小题4分) 9.函数y = x 的取值范围是 . 10.分解因式:3 2 816a a a -+= . 11.如图,在梯形ABCD 中,AD ∥BC ,BD ⊥DC ,∠C=45°. 若AD=2,BC=8,则AB 的长为 . 12.在平面直角坐标系xOy 中,有一只电子青蛙在点A (1,0)处. 第一次,它从点A 先向右跳跃1个单位,再向上跳跃1个单位到达点A 1; 第二次,它从点A 1先向左跳跃2个单位,再向下跳跃2个单位到达点A 2; 第三次,它从点A 2先向右跳跃3个单位,再向上跳跃3个单位到达点A 3; 第四次,它从点A 3先向左跳跃4个单位,再向下跳跃4个单位到达点A 4; …… 依此规律进行,点A 6的坐标为 ;若点A n 的坐标为(2013,2012), 则n = . 三、解答题(本题共30分,每小题5分) 13.计算:10345sin 2)13(8-+?--+. 14.解不等式组 4(1)78,2 5,3x x x x +≤-?? -?-
2013北京中考数学试题、答案解析版
2013年北京市高级中等学校招生考试数学试卷 一、选择题(本题共32分,每小题4分) 下面各题均有四个选项,其中只有一个是符合题意的。 1. 在《关于促进城市南部地区加快发展第二阶段行动计划(2013-2015)》中,北京市提出了总计约3 960亿元的投资计划。将3 960用科学计数法表示应为 ( ) A. 39.6×10² B. 3.96×10³ C. 3.96×10⁴ D. 3.96×10⁴ 考点:科学记数法—表示较大的数 分析:科学记数法的表示形式为a×10n 的形式,其中1≤|a|<10,n 为整数.确定n 的值时,要看把原数变成a 时,小数点移动了多少位,n 的绝对值与小数点移动的位数相同.当原数绝对值>1时,n 是正数;当原数的绝对值<1时,n 是负数. 解答:将3960用科学记数法表示为3.96×10³.故选B . 点评:此题考查科学记数法的表示方法.科学记数法的表示形式为a×10n 的形式,其中1≤|a|<10,n 为整数,表示时关键要正确确定a 的值以及n 的值. 2. 43 - 的倒数是 ( ) A. 34 B. 43 C. 43- D. 34 - 考点:倒数 分析:据倒数的定义:若两个数的乘积是1,我们就称这两个数互为倒数 解答:D 点评:本题主要考查倒数的定义,要求熟练掌握.需要注意的是: 倒数的性质:负数的倒数还是负数,正数的倒数是正数,0没有倒数. 倒数的定义:若两个数的乘积是1,我们就称这两个数互为倒数 3. 在一个不透明的口袋中装有5个完全相同的小球,把它们分别标号为1,2,3,4,5,从中随机摸出一个小球,其标号大于2的概率为() A. 51 B. 52 C. 53 D. 54 考点:概率公式 分析:根据随机事件概率大小的求法,找准两点:①符合条件的情况数目,②全部情况的总数,二者的比值就是其发生的概率的大小. 解答:C 点评:本题考查概率的求法与运用,一般方法:如果一个事件有n 种可能,而且这些事件的可 能性相同,其中事件A 出现m 种结果,那么事件A 的概率 n m A P = )(,难度适中。 4. 如图,直线a ,b 被直线c 所截,a ∥b ,∠1=∠2,若∠3=40°,则∠4等于() A. 40° B. 50° C. 70° D. 80° 考点:平行线的性质 分析:根据平角的定义求出∠1,再根据两直线平行,内错角相等解答. 解答: 点评:本题考查了平行线的性质,平角等于180°,熟记性质并求出∠1是解题的关键
全国高考历年各省录取分数线比较与分析
全国高考历年各省录取分数线比较与分析 (2012-01-12 18:02:09) 转载▼ 分类:杂谈 标签: 全国高考 各省 分数 比较 分析 山东 河北 北京 上海 湖北 江苏 浙江 甘肃 陕西 主要以时间序列来考察中央部属大学分省招生的公平性问题,本节主要考察恢复高考以来各省分数线的整体演变趋势,这也是被社会各界广泛关注的焦点问题。具体来说,依据分省招生的数量、基础教育的水平和高等教育资源的丰富程度三个因素来揭示其演变的动因。首先,高考分数线的变化与招生名额的投放有很大关系,即在相同的条件下,招生数量越多,录取分数线就越低;其次,基础教育水平的高低决定了该省生源的优劣程度,在同等条件下,基础教育水平越高,分数线也相应越高;最后,高等教育资源的丰富程度决定了招生数量的多寡,也会影响到分数线的变化,其中,高校的数量,特别是“211工程”院校和“985”工程院校的数量在很大程度上决定了本科一批分数线的高低。本节主要选取这三个因素来反映各省高考录取分数线的变化情况。 一、恢复高考以来各省分数线的变化趋势 高考建制之初,由于招生数在整体上多于高中毕业生数,所以录取分数线也较低,并且实行以大行政区为主的招生体制,所以当时的分数线没有太多实质的意义。1958 年高考制度暂时中断,次年旋即恢复,并从此确立了分省录取制度,至此才出现了分省的高考录取分数线。但因 20 世纪 60 年代强烈的**因素的干扰,高考制度经历了较大的反复,科目改革频
仍,且相关数据散佚难以获取。 故此,只研究恢复高考以来各省分数线的变化情况。笔者选取 1980 年、1991 年和 1999 年的三个时间点的分省高考录取分数线来研究其基本的走势,之所以选取这三个时间点,出于以下考虑: 其一,1977 年到 1979 年考生众多、竞争激烈,属于特殊时期,从 1980 年开始,各项教育事业和高考制度逐步趋于正常; 其二,1999 年除广东实行“3+X”改革和上海单独命题之外,其他省区均采用全国卷,分数易于比较,之后因“3+X”改革方案在全国推广,试卷纷繁多样而难以比较;其三,1991 年大致处于两者之间,且大多数省区采用全国卷,分数易于比较。故此,选取以上三个年份的数据。大体而言,三个时段的分数线基本能够反应各省分数线变化的趋势。 将 1977年至 1999 年的各省录取分数线整理如下
2013年第一学期期末八年级数学试卷(含答案)
2012—2013学年度第一学期期末试题 科目:数学年级:八年级 (考生注意:本卷满分100分,考试时间为100分钟) 一、选择题(每小题只有一个正确答案。每小题3分,共30分。) 1、将具有下列长度的三条线段首尾顺次相连,能组成直角三角形的是() A、1,2,3 B、5,12,13 C、4,5,7 D、9,80,81 2、在实数 7 22 -、0、3 -、506、π、327 - -、 . . 101.0中,无理数的个数是 ( ) A.1个 B.2个 C.4个 D.5个 3、-8的立方根是() A 2 ± B 2 C-2 D 24 4、在平面直角坐标系中,点A(1,-3)在() A 第一象限 B 第二象限 C 第三象限 D 第四象限 5、点P(-1,2)关于y轴对称的点的坐标为() A、(1,-2) B、(-1,-2) C、(1,2) D、(2,1) 6、观察下列图形,既是轴对称图形,又是中心对称图形的是() A B C D 7、下列说法中错误的是() A 四个角相等的四边形是矩形 B 对角线互相垂直的矩形是正方形 C 对角线相等的菱形是正方形 D 四条边相等的四边形是正方形 8、下列各组数值是二元一次方程4 3= -y x的解的是() (A) ? ? ? - = = 1 1 y x (B) ? ? ? = = 1 2 y x (C) ? ? ? - = - = 2 1 y x (D) ? ? ? - = = 1 4 y x 9、某商场对上周末某品牌运动服的销售情况进行了统计,如下表所示: 经理决定本周进货时多进一些红色的,可用来解释这一现象的统计知识是 () A 平均数 B 中位数 C 众数 D 平均数与中位数 10、一支蜡烛长20厘米, 点燃后每小时燃烧5厘米,燃烧时剩下的高度h(厘米)与燃烧时间t(时) 的函数关系的图象是() A B C D 二、填空题(每空3分,共24分) 1、如右图,数轴上点A表示的数是; 2、绝对值是 7 的数是,38 1 -的倒数是。 3、菱形ABCD的边长为5cm,其中一条对角线长为6cm,则菱形ABCD的面积 为 cm2. 4、如右图;在等腰梯形ABCD中,AD=2,BC=4,DC=5
2008义乌市中考数学卷
第 1 页 共 13 页 浙江省2008年初中毕业生学业考试(义乌市卷) 数学试题卷 考生须知: 1. 全卷共4页,有3大题,24小题. 满分为150分,考试时间120分钟. 2. 本卷答案必须做在答题纸的对应位置上,做在试题卷上无效. 3. 请考生将姓名、准考证号填写在答题纸的对应位置上.并认真核对答题纸上粘贴的条 形码的“姓名、准考证号”与考生本人姓名、准考证号是否一致. 4. 作图时,可先使用2B 铅笔,确定后必须使用0.5毫米及以上的黑色签字笔涂黑. 温馨提示:请仔细审题,细心答题,相信你一定会有出色的表现! 参考公式:二次函数 y =ax 2+bx +c 图象的顶点坐标是)44,2(2 a b a c a b --. 试 卷 Ⅰ 说明:本卷共有1大题,10小题,每小题4分,共40分.请用2B 铅笔在“答题纸”上将你认为正确的选项对应的小方框涂黑、涂满. 一、选择题(请选出各题中一个符合题意的正确选项,不选、多选、错选,均不给分) 1. 计算-2+3的结果是 A .1 B .-1 C .-5 D .-6 2.据统计,2007年义乌中国小商品城市场全年成交额约为348.4亿元,连续第17次蝉联全国批发市场榜首.近似数348.4亿元的有效数字的个数是 A.3个 B. 4个 C.5个 D .6个 3.国家实行一系列惠农政策后,农村居民收入大幅度增加.下表是2003年至2007年我市农村居民年人均收入情况(单位:元),则这几年我市农村居民年人均收入的中位数是 A .6969元 B .7735元 C .8810元 D .10255元 4.下列四个几何体中,主视图、左视图、俯视图都是圆的几何体是 A.正方体 B.圆锥 C.球 D .圆柱 5.不等式组312840 x x ->??-?, ≤的解集在数轴上表示为 A . B . C . D .
北京市2014年中考数学试题及答案
2014年北京市高级中等学校招生考试 数学试卷 学校 姓名 准考证号 下面各题均有四个选项,其中只有一个..是符合题意的. 1.2的相反数是 A .2 B .2- C .1 2 - D . 12 2.据报道, 某小区居民李先生改进用水设备,在十年内帮助他居住小区的居民累计节水 300 000 吨.将300 000 用科学记数法表示应为 A .60.310? B .5310? C .6310? D .43010? 3.如图,有6张扑克处于,从中随机抽取一张,点数为偶数的概率是 A . 16 B . 14 C .13 D . 12 4.右图是几何体的三视图,该几何体是 A.圆锥 B .圆柱 C .正三棱柱 D .正三棱锥 5.某篮球队12名队员的年龄如下表所示: A .18,19 B .19,19 C .18 ,19.5 D .19,19.5 6.园林队在某公园进行绿化,中间休息了一段时间.已知绿化面积S (单位:平方米)与工作时间t (单位:小时)的函数关系的图象如图所示,则休息后园林队每小时绿化面积为 A .40平方米 B .50平方米 C .80平方米 D .100平方米
O E D C B A 7.如图.O e 的直径AB 垂直于弦CD ,垂足是E ,22.5A ∠=?, 4OC =,CD 的长为 A . B .4 C . D .8 8.已知点A 为某封闭图形边界上一定点,动点P 从点A 出发,沿其边界顺时针匀速运动一周.设点P 运动的时间为x ,线段AP 的长为y .表示y 与x 的函数关系的图象大致如右图所示,则该封闭图形可能是 A A D C B A A 二、填空题(本题共16分,每小题4分) 9.分解因式:429______________ax ay -=. 10.在某一时刻,测得一根高为1.8m 的竹竿的影长为3m ,同时测得一根旗杆的影长为25m ,那么这根旗杆的高度为 m . 11.如图,在平面直角坐标系xOy 中,正方形OABC 的边长为2.写 出一个函数(0)k y k x =≠,使它的图象与正方形OABC 有公共 点,这个函数的表达式为 . 12.在平面直角坐标系x Oy 中,对于点()P x y , ,我们把点(11)P y x '-++,叫做点P 的伴随点,已知点1A 的伴随点为2A , 点2A 的伴随点为3A ,点3A 的伴随点为4A ,…,这样依次得到点1A ,2A ,3A ,…,n A ,….若点1A 的坐标为(3,1),则点3A 的坐标为 ,点2014A 的坐标为 ;若点1A 的坐标为(a ,b ),对于任意的正整数n ,点n A 均在x 轴上方,则a ,b 应满足的条件为 . 三、解答题(本题共30分,每小题5分) 13.如图,点B 在线段AD 上, BC DE ∥,AB ED =,BC DB =. 求证:A E ∠=∠. E C B A D
广东省东莞市2013-2014学年八年级上期末数学试卷及答案
广东省东莞市2013-2014学年八年级(上)期末 数学试卷 一、选择题(每小题2分,共20分) 1.下列运算正确的是() A.(ab)3=ab3B.a3?a2=a5C.(a2)3=a5D.(a﹣b)2=a2﹣b2 2.使分式有意义的x的取值范围是() A.x>﹣2 B.x<2 C.x≠2 D.x≠﹣2 3.某种生物孢子的直径为0.000 63m,用科学记数法表示为() A.0.63×10﹣3m B.6.3×10﹣4m C.6.3×10﹣3m D.6.3×10﹣5m 4.一个等边三角形的对称轴共有() A.1条B.2条C.3条D.6条 5.已知三角形的两边长分别为4和9,则下列数据中能作为第三边长的是() A.13 B.6C.5D.4 6.如图1,AB∥CD,∠A=40°,∠D=45°,则∠1的度数为() A.5°B.40°C.45°D.85° 7.如图2,△ABC中,∠ACB=90°,CD⊥AB,∠A=30°,BD=2,则AD的长度是()A.6B.8C.12 D.16 8.如图3,△ABC≌△DEC,∠ACB=90°,∠DCB=20°,则∠BCE的度数为() A.20°B.40°C.70°D.90° 9.如图,图中含有三个正方形,则图中全等三角形共有多少对() A.2B.3C.4D.5 10.如图,则图中的阴影部分的面积是() A.12πa2B.8πa2C.6πa2D.4πa2
二、填空题(每小题3分,共15分) 11.分解因式:2a2﹣4a+2=_________. 12.点(﹣3,﹣5)关于y轴对称的点的坐标是_________. 13.计算:(a﹣b)2=_________. 14.分式方程﹣=0的解是_________. 15.如图,点A、D、B、E在同一直线上,△ABC≌△DEF,AB=5,BD=2,则AE=_________. 三、解答题(每小题5分,共25分) 16.(5分)计算:(a﹣1)(a2+a+1) 17.(5分)计算:(+)÷(﹣) 18.(5分)如图,在直角坐标系中,已知点A(0,3)与点C关于x轴对称,点B
浙江省义乌市中考数学试卷(解析版)
浙江省义乌市2013年中考数学试卷 一、选择题(共10小题,每小题3分,满分30分)请选出各题中一个符合题意的 1.(3分)(2013?义乌市)在2,﹣2,8,6这四个数中,互为相反数的是() 2.(3分)(2013?义乌市)如图几何体的主视图是() B C D. 3.(3分)(2013?义乌市)如图,直线a∥b,直线c与a,b相交,∠1=55°,则∠2=()
4.(3分)(2013?义乌市)2012年,义乌市城市居民人均可支配收入约为44500元,居全省县级市之首,数字44500用科学记数法可表示为()
5.(3分)(2013?义乌市)两圆的半径分别为3和5,圆心距为7,则两圆的位置关系是() 6.(3分)(2013?义乌市)已知两点P1(x1,y1)、P2(x2、y2)在反比例函数y=的图象上,当x1>x2>0时,下列结论正确的是()
7.(3分)(2013?义乌市)下列图形中,既是轴对称图形又是中心对称图形的有() 8.(3分)(2013?义乌市)已知圆锥的底面半径为6cm,高为8cm,则这个圆锥的母线长为() ==10
9.(3分)(2013?义乌市)为支援雅安灾区,小慧准备通过爱心热线捐款,她只记得号码的前5位,后三位由5,1,2,这三个数字组成,但具体顺序忘记了,他第一次就拨通电话的概率是() B C D. ∴他第一次就拨通电话的概率是:. 10.(3分)(2013?义乌市)如图,抛物线y=ax2+bx+c与x轴交于点A(﹣1,0),顶点坐标为(1,n),与y轴的交点在(0,2)、(0,3)之间(包含端点),则下列结论: ①当x>3时,y<0;②3a+b>0;③﹣1≤a≤﹣;④3≤n≤4中, 正确的是()
2016年北京市中考数学试卷(解析版)
2016年北京市中考数学试卷 一、选择题(本题共30分,每小题3分) 1.(3分)(2016?北京)如图所示,用量角器度量∠AOB,可以读出∠AOB的度数为() A.45°B.55°C.125°D.135° 2.(3分)(2016?北京)神舟十号飞船是我国“神州”系列飞船之一,每小时飞行约28000公里,将28000用科学记数法表示应为() A.2.8×103B.28×103C.2.8×104D.0.28×105 3.(3分)(2016?北京)实数a,b在数轴上的对应点的位置如图所示,则正确的结论是() A.a>﹣2 B.a<﹣3 C.a>﹣b D.a<﹣b 4.(3分)(2016?北京)内角和为540°的多边形是() A. B.C. D. 5.(3分)(2016?北京)如图是某个几何体的三视图,该几何体是() A.圆锥 B.三棱锥C.圆柱 D.三棱柱 6.(3分)(2016?北京)如果a+b=2,那么代数(a﹣)?的值是() A.2 B.﹣2 C.D.﹣ 7.(3分)(2016?北京)甲骨文是我国的一种古代文字,是汉字的早期形式,下列甲骨文中,不是轴对称的是()
A.B.C.D. 8.(3分)(2016?北京)在1﹣7月份,某种水果的每斤进价与出售价的信息如图所示,则出售该种水果每斤利润最大的月份是() A.3月份B.4月份C.5月份D.6月份 9.(3分)(2016?北京)如图,直线m⊥n,在某平面直角坐标系中,x轴∥m,y轴∥n,点A的坐标为(﹣4,2),点B的坐标为(2,﹣4),则坐标原点为() A.O1B.O2C.O3D.O4 10.(3分)(2016?北京)为了节约水资源,某市准备按照居民家庭年用水量实行阶梯水价.水价分档递增,计划使第一档、第二档和第三档的水价分别覆盖全市居民家庭的80%,15%和5%,为合理确定各档之间的界限,随机抽查了该市5万户居民家庭上一年的年用水量(单位:m3),绘制了统计图.如图所示,下面四个推断合理的是() ①年用水量不超过180m3的该市居民家庭按第一档水价交费; ②年用水量超过240m3的该市居民家庭按第三档水价交费; ③该市居民家庭年用水量的中位数在150﹣180之间; ④该市居民家庭年用水量的平均数不超过180.
2013年秋八年级上数学期末测试题
2013八年级数学上期末测试题 一 .选择题(共12小题,满分36分,每小题3分) 1 . (3分)(2012?宜昌)在以下永洁环保、绿色食品、节能、绿色环保四个标志中,是轴 对称图形是() A . 2. (3分)(2011?绵阳)王师傅用4根木条钉成一个四边形木架,如图.要使这个木架不变 3. (3分)如下图,已知△ ABE ACD,/仁/2,/ B= / C,不正确的等式是( 2 9. (3分)(2012?安徽)化简L的结果是( B . x—1 形,他至少还要再钉上几根木条?( A . 0根 20131224 A . AB=AC B . / BAE= / CAD C. BE=D C D. AD=DE ax ax (4)(6) 4. (3分)(2012?凉山州)如图,一个等边三角形纸片,剪去一个角后得到一个四边形, 则图中/ a+ / B的度数是() A . 180°B. 220°C. 240°D. 300° 5. (3分)(2012?益阳)下列计算正确的是 ( A. 2a+3b=5ab (x+2) 2=x2+4 C. (ab3) 2=ab60 D. ( —1) =1 6 .(3分)(2012 ?柳州)如图,给出了正方形ABCD的面积的四个表达式,其中错误的是() A . 2 2 B. x +a +2ax 2 & ( 3分)(2012?宜昌)若分式二有意义,则a的取值范围是( a+1 (x+a) (x+a)(x —a) (x —a) (x+a) a+ (x+a) x A . a=0 B . a=1 C . a z—1 A . x+1 (3)
10 . (3 分)(2011?鸡西)下列各式:①a°=1;② a2?a3=a5;③ 2 2=-二 4 4 2 2 2 ④—(3 - 5)+ (- 2)七X (- 1)=0 ;⑤ x +x =2x ,其中正确的是() A .①②③ B .①③⑤C.②③④ D .②④⑤ 11. (3分)(2012?本溪)随着生活水平的提高,小林家购置了私家车,这样他乘坐私家车上学比乘坐公交车上学所需的时间少用了15分钟,现已知小林家距学校8千米,乘私家车平均速度是乘公交车平均速度的 2.5倍,若设乘公交车平均每小时走x千米,根据题意可列方程为() A . 尹5“B. 岂1出 R 2. 5 C. 8 1 S I R 4_2. D. 8 S 1 门.5K 4 12. (3分)(2011?西藏)如图,已知/ 1 = / 2,要得到△ ABD ◎△ ACD,还需从下列条件中补选一个,则错误的选法是() A . AB=AC B. DB=DC C. / ADB= / ADC D. / B= / C 二.填空题(共5小题,满分20分,每小题4分) 3 2 13. (4 分)(2012?潍坊)分解因式:x - 4x - 12x= _____________ . 1 — kx 1 14. (4分)(2012?攀枝花)若分式方程:_______ ^ . 有增根,则k= ________________________ . X _ Z Z _ X 15. (4分)(2011?昭通)如图所示,已知点A、D、B、F在一条直线上,AC=EF , AD=FB , 要使△ ABC ◎△ FDE ,还需添加一个条件,这个条件可以是 _______________ .(只需填一个即可) 16. (4 分)(2012?白银)如图,在厶ABC 中,AC=BC , △ ABC 的外角/ ACE=100 ° 则/A= _________ 度. A
义乌市中考数学试题及答案
浙江省2009年初中毕业生学业考试(义乌卷) 数 学 试 题 卷 考生须知: 1.全卷共4页,有3大题,24小题。满分为120分。考试时间120分钟. 2.本卷答案必须做在答题纸的对应位置上,做在试卷上无效。 3.请考生将姓名、准考生号填写在答题纸的对应位置上,并认真核准条形码的姓名、准考证号。 4.作图时,可先使用2B 铅笔,确定后必须使用0.5毫米及以上的黑色签字笔涂黑。 温馨提示:请仔细审题,细心答题,相信你一定会有出色的表现! 参考公式:二次函数2 y ax bx c =++图像的顶点坐标是24,24b ac b a a ??-- ??? 试卷Ⅰ 说明:本卷共有1大题,10小题,每小题3分,共30分.请使用2B 铅笔在“答题纸”上将你认为正确的选项对应的小方框涂黑、涂满。 一、选择题(请选出各题中一个符合题意的正确选项,不选、多选、错选,均不给分) 1.在实数0,1,0.1235中,无理数的个数为 A.0个 B.1个 C.2个 D.3个 2.尽管受到国际金融危机的影响,但义乌市经济依然保持了平稳增长。据统计,截止到今年4月底,我市金融机构存款余额约为1193亿元,用科学计数法应记为 A .101.19310?元 B. 111.19310?元 C .121.19310?元 D. 131.19310?元 3.如图,在ABC 中,90C ∠=。,EF//AB,150∠=。,则B ∠的度 数为 A .50。 B. 60。 C.30。 D. 40。 4.下列由若干个单位立方体搭成的几何体中,左视图是图1的 为 5.在中华经典美文阅读中,小明同学发现自己的一本书的宽与长之比为黄金比。已知这本书的长为20cm ,则它的宽约为
北京市2015年中考数学试题及答案
2015年北京市高级中等学校招生考试 数学试卷 一、选择题 下面各题均有四个选项,其中只有一个 ..是符合题意的。 1.截止到2015年6月1日,北京市已建成34个地下调蓄设施,蓄水能力达到1 40 000立方平米。将1 40 000用科学记数法表示应为 A.14×104B.1.4×105 C.1.4×106 D.0.14×106 2.实数a,b,c,d在数轴上的对应点的位置如图所示,这四个数中,绝对值最大的是 A.a B.b C.c D.d 3.一个不透明的盒子中装有3个红球,2个黄球和1个绿球,这些球除了颜色外无其他差别,从中随机摸出一个小球,恰好是黄球的概率为 A.B.C.D. 4.剪纸是我国传统的民间艺术,下列剪纸作品中,是轴对称图形的为 5.如图,直线l1,l2,l3交于一点,直线l4∥l1,若∠1=124°,∠2=88°, 则∠3的度数为 A.26°B.36° C.46°D.56° 6.如图,公路AC,BC互相垂直,公路AB的中点M与点C被湖隔开,若测得AM的长为1.2km,则M,C两点间的距离为 A.0.5km B.0.6km C.0.9km D.1.2km 7.某市6月份日平均气温统计如图所示,则在日平均气温这组数 据中,众数和中位数分别是 A.21,21 B.21,21.5 C.21,22 D.22,22 8.右图是利用平面直角坐标系画出的故宫博物院的主要建
筑分布图。若这个坐标系分别以正东、正北方向为x轴、y轴的正方向。表示太和门的点坐标为(0,-1),表示九龙壁的点的坐标为(4,1),则表示下列宫殿的点的坐标正确的是 A.景仁宫(4,2) B.养心殿(-2,3) C.保和殿(1,0) D.武英殿(-3.5,-4) 9.一家游泳馆的游泳收费标准为30元/次,若购买会员年卡,可享受如下优惠: 会员年卡类型办卡费用(元)每次游泳收费(元) A类50 25 B类200 20 C类400 15 例如,购买A类会员卡,一年内游泳20次,消费50+25×20=550元,若一年内在该游泳馆游泳的次数介于45~55次之间,则最省钱的方式为 A.购买A类会员年卡B.购买B类会员年卡 C.购买C类会员年卡D.不购买会员年卡 10.一个寻宝游戏的寻宝通道如图1所示,通道由在同一平面内的AB,BC,CA,OA,OB,OC组成。为记录寻宝者的进行路线,在BC的中点M处放置了一台定位仪器,设寻宝者行进的时间为x,寻宝者与定位仪器之间的距离为y,若寻宝者匀速行进,且表示y与x的函数关系的图象大致如图2所示,则寻宝者的行进路线可能为 A.A→O→B B.B→A→C C.B→O→C D.C→B→O 二、填空题 11.分解因式:5x2-10x2=5x=_________. 12.右图是由射线AB,BC,CD,DE,组成的平面图形,则∠1+∠2+∠3+∠4+∠5=_____.