近断层浅层盆地地震动响应

SEISMIC RESPONCE OF A SHALLOW BASIN FROM
EARTHQUAKE ON A BLIND ACTIVE FAULT BENEATH
X. X. Tao
School of Civil Engineering, Harbin Institute of Technology, China.
Institute of Engineering Mechanics, China Earthquake Administration, China.
X. D. Sun H.M. Liu P. Li
School of Civil Engineering, Harbin Institute of Technology, China
ABSTRACT:
Many cities in the world are located in basins. Basin can amplify ground motion
significantly by the soft sediment, buried rock topography and edge effect in it. Hundreds
of papers have been published on this effect for decades. Seismic waves are adopted as
inputs in the analysis. Near field ground motion is governed predominantly by earthquake
source. A hybrid source model is introduced in this paper, which combines Asperity
model and K square model to take into account the physical nature and ignorance on the
slip distribution on the faulting plane. The ground motion in short period range is
synthesized by a random method in which dynamic corner frequency is applied in each
sub-source model. The ground motion in the basin is further calculated by means of 1D
equivalent linearization procedure. Two steps are carried out for the long period motion.
Firstly, the displacement field at the top of buried crystal base rock surface is calculated
by analytical Green Function method. Then the ground motion at ground surface is
calculated by 3D wave propagation finite element method with input from the first step.
The two parts of ground motion are finally superposed. For illustration, the result of a
shallow basin from an earthquake with magnitude 6 on the blind fault beneath is shown
and the distribution pattern of the response motion is summarized.
1 INTRODUCTION
With the developments of modern cities, more and more structures with large horizontal dimensions such as long span structures, over crossing bridges and buried pipelines have been built up in urban area. Damages of these structures in earthquake will cause severe loss to the city. Therefore, earthquake disaster risk assessments and reductions for cities, especially for those located near to active fault become a stress in earthquake engineering. The problem must be complicated if the city locates on a basin since it can amplify ground motion significantly by the soft sediment, buried rock topography and edge effect. In this paper, a case study is presented for seismic response of a shallow basin from an earthquake with magnitude 6 on blind active fault just beneath the basin. A hybrid finite fault source model is adopted to describe the slip distribution on the faulting plane. Stochastic synthesis procedure and numerical Green function are applied to generate ground motion in high frequency range (1Hz f >) and low frequency (1Hz f <) range respectively.
2 HYBRID SOURCE MODEL
Finite fault model (FFM) is currently adopted in strong ground motion simulation to describe near-fault rupture directivity effect and hanging wall effect. It is convenient to describe the inhomogeneous distribution of the dislocation on the rupture surface. In the model, the faulting plane is divided into many sub-sources, and the specified dislocation energy is assigned to each one of them, as point source. Tao and Wang (2004) developed a hybrid finite fault source model. The main idea of the
https://www.360docs.net/doc/775991048.html,
Keywords: stochastic model ;numerical Green function;equivalent linearization;shallow basin
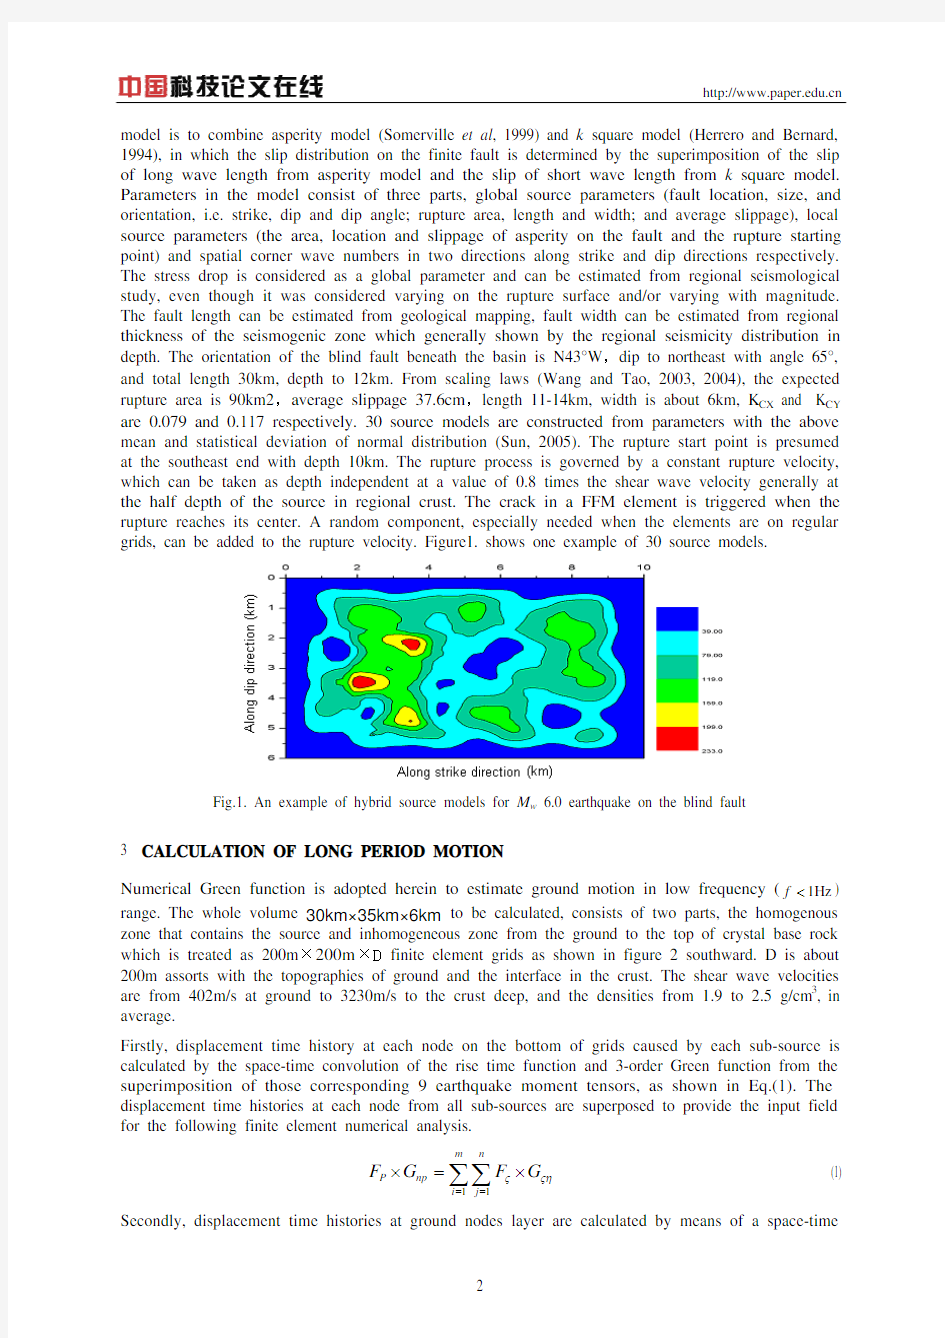
model is to combine asperity model (Somerville et al , 1999) and k square model (Herrero and Bernard, 1994), in which the slip distribution on the finite fault is determined by the superimposition of the slip of long wave length from asperity model and the slip of short wave length from k square model. Parameters in the model consist of three parts, global source parameters (fault location, size, and orientation, i.e. strike, dip and dip angle; rupture area, length and width; and average slippage), local source parameters (the area, location and slippage of asperity on the fault and the rupture starting point) and spatial corner wave numbers in two directions along strike and dip directions respectively. The stress drop is considered as a global parameter and can be estimated from regional seismological study, even though it was considered varying on the rupture surface and/or varying with magnitude. The fault length can be estimated from geological mapping, fault width can be estimated from regional thickness of the seismogenic zone which generally shown by the regional seismicity distribution in depth. The orientation of the blind fault beneath the basin is N43°W ,dip to northeast with angle 65°, and total length 30km, depth to 12km. From scaling laws (Wang and Tao, 2003, 2004), the expected rupture area is 90km2,average slippage 37.6cm ,length 11-14km, width is about 6km, K CX and K CY are 0.079 and 0.117 respectively. 30 source models are constructed from parameters with the above mean and statistical deviation of normal distribution (Sun, 2005). The rupture start point is presumed at the southeast end with depth 10km. The rupture process is governed by a constant rupture velocity, which can be taken as depth independent at a value of 0.8 times the shear wave velocity generally at the half depth of the source in regional crust. The crack in a FFM element is triggered when the rupture reaches its center. A random component, especially needed when the elements are on regular
grids, can be added to the rupture velocity. Figure1. shows one example of 30 source models.
Fig.1. An example of hybrid source models for M w 6.0 earthquake on the blind fault
3 CALCULATION OF LONG PERIOD MOTION
Numerical Green function is adopted herein to estimate ground motion in low frequency (1Hz f <) range. The whole volume 30km×35km×6km to be calculated, consists of two parts, the homogenous zone that contains the source and inhomogeneous zone from the ground to the top of crystal base rock which is treated as 200m ×200m ×D finite element grids as shown in figure 2 southward. D is about 200m assorts with the topographies of ground and the interface in the crust. The shear wave velocities are from 402m/s at ground to 3230m/s to the crust deep, and the densities from 1.9 to 2.5 g/cm 3, in average.
Firstly, displacement time history at each node on the bottom of grids caused by each sub-source is calculated by the space-time convolution of the rise time function and 3-order Green function from the superimposition of those corresponding 9 earthquake moment tensors, as shown in Eq.(1). The displacement time histories at each node from all sub-sources are superposed to provide the input field for the following finite element numerical analysis.
11m n
P np i j F G F G ??η==×=×∑∑ (1) Secondly, displacement time histories at ground nodes layer are calculated by means of a space-time
https://www.360docs.net/doc/775991048.html,
decoupling explicit finite element calculation with the second-order local artificial transmitting
boundary (Liao et al, 1984, 2001, 2002).
Fig.2. Computing model for numerical Green function
4 SYNTHESIS OF SHORT PERIOD MOTION
In high frequency range, the ground motion is synthesized by stochastic procedure (Boore, 1983, 1987; Anderson, 1984; Atkinson, 1984, 1997, 2000). The acceleration Fourier spectrum of ground motion caused by a sub-source can be written as following.
()00(,,),()(,)()()FA M f R S M f G R D R f A f P f =???? (2)
where ()0,S M f is source spectrum; ()G R represents geometric attenuation; (,)D R f stands for inelastic attenuation; ()A f is surface amplification factor; ()P f is a high pass filter. The acceleration time history at a given site are summed by those from all sub-sources with time delays in time domain.
()()1W
L N N ij ij i j a t a t t ==?∑∑ (3)
where L N and W N are numbers of sub-sources along strike and dip directions respectively; ij t is the time delay of the ij th sub-source determined by the distances from sub-source to the rupture start point and to the site. In order to eliminate the effects of sub-fault size on high frequency radiant energy, dynamic corner frequency (Motazedian and Atkinson, 2005) is adopted, which makes the acceleration spectrum from the ij th sub-source have the following form.
()()202021ij ij ij ij CM H f A f f f π=????+?????????? (4)
where C is a coefficient independent on frequency, 0ij M is the moment of the ij th sub-source, ij H is a compensative factor to keep the high frequency radiant energy conservation, 0ij f is dynamic corner frequency which depends on the rupture area at some time and changes as the rupture propagates. 5 SEISMIC RESPONSE OF THE SHALLOW BASIN
The seismic response of a basin may be obtained from finite element simulation with a smaller element size to meet the frequency resolution and to describe the complexity of 3-D velocity structure of the basin. However, the minification of element size must result in the increase of computing
https://www.360docs.net/doc/775991048.html,
amount. The maximum thickness of soil in the basin is less than 40m and the area taken into account is 13.6km ×16.6km, as shown in figure 3. Even the element with size less than 10 meters also may not able to describe the variation of shear wave velocity in shallow soil layer, and the complexity of sediment in the basin sufficiently. So small element size will result in unacceptable computing amount. Therefore, 1D equivalent linearization analysis is applied instead of more detailed finite element simulation in the seismic response analysis of the basin. The progress is as follows:
(1) Zone the basin according to some given depth intervals.
(2) Calculate the transfer function for each zone by means of 1D equivalent linearization analysis with shear wave velocity profile in the zone.
(3) Multiply ground motions at 50 m deep beneath the basin by the corresponding transfer function instead of the surface amplification factor ()A f in Eq.(2) to get the ground motions at the same notes of 200m ×200m grid in the basin.
Finally, the ground motions are superposed with low frequency ground motions in time domain, after the high and low pass filtered respectively.
Fig.3. The contour map of soil depth in the basin and its vicinity
The location of the blind reverse fault is shown in figure 5. Figure 4 shows the zonation of soil condition in the basin (left) and the corresponding average transfer functions (right). The zone I is
referred as rock site in which the short period ground motions are calculated from Eg.(2) directly.
A m p l i f i c a t i o n Period Fig.4. Zonation of soil condition and the corresponding transfer functions in the basin and its vicinity As a result, the PGA zoning map is worked out, as shown in figure 5. Those with subscript 1 are at
https://www.360docs.net/doc/775991048.html,
近断层浅层盆地的地震动响应
SEISMIC RESPONCE OF A SHALLOW BASIN FROM EARTHQUAKE ON A BLIND ACTIVE FAULT BENEATH X. X. Tao School of Civil Engineering, Harbin Institute of Technology, China. Institute of Engineering Mechanics, China Earthquake Administration, China. X. D. Sun H.M. Liu P. Li School of Civil Engineering, Harbin Institute of Technology, China ABSTRACT: Many cities in the world are located in basins. Basin can amplify ground motion significantly by the soft sediment, buried rock topography and edge effect in it. Hundreds of papers have been published on this effect for decades. Seismic waves are adopted as inputs in the analysis. Near field ground motion is governed predominantly by earthquake source. A hybrid source model is introduced in this paper, which combines Asperity model and K square model to take into account the physical nature and ignorance on the slip distribution on the faulting plane. The ground motion in short period range is synthesized by a random method in which dynamic corner frequency is applied in each sub-source model. The ground motion in the basin is further calculated by means of 1D equivalent linearization procedure. Two steps are carried out for the long period motion. Firstly, the displacement field at the top of buried crystal base rock surface is calculated by analytical Green Function method. Then the ground motion at ground surface is calculated by 3D wave propagation finite element method with input from the first step. The two parts of ground motion are finally superposed. For illustration, the result of a shallow basin from an earthquake with magnitude 6 on the blind fault beneath is shown and the distribution pattern of the response motion is summarized. 1 INTRODUCTION With the developments of modern cities, more and more structures with large horizontal dimensions such as long span structures, over crossing bridges and buried pipelines have been built up in urban area. Damages of these structures in earthquake will cause severe loss to the city. Therefore, earthquake disaster risk assessments and reductions for cities, especially for those located near to active fault become a stress in earthquake engineering. The problem must be complicated if the city locates on a basin since it can amplify ground motion significantly by the soft sediment, buried rock topography and edge effect. In this paper, a case study is presented for seismic response of a shallow basin from an earthquake with magnitude 6 on blind active fault just beneath the basin. A hybrid finite fault source model is adopted to describe the slip distribution on the faulting plane. Stochastic synthesis procedure and numerical Green function are applied to generate ground motion in high frequency range (1Hz f >) and low frequency (1Hz f <) range respectively. 2 HYBRID SOURCE MODEL Finite fault model (FFM) is currently adopted in strong ground motion simulation to describe near-fault rupture directivity effect and hanging wall effect. It is convenient to describe the inhomogeneous distribution of the dislocation on the rupture surface. In the model, the faulting plane is divided into many sub-sources, and the specified dislocation energy is assigned to each one of them, as point source. Tao and Wang (2004) developed a hybrid finite fault source model. The main idea of the https://www.360docs.net/doc/775991048.html, Keywords: stochastic model ;numerical Green function;equivalent linearization;shallow basin
小断层
Research on Development Character of Middle and Small Size Fault Structure in DongPang Mine Field on Fractal Theory Sun Xue-yang School of Geology and Environment Xi’an University of Science and Technology Xi’an, China sunxy02211@https://www.360docs.net/doc/775991048.html, Xia Yu-cheng School of Geology and Environment Xi’an University of Science and Technology Xi’an China xiayc@https://www.360docs.net/doc/775991048.html, Abstract—Middle and small size fault structure is the key geological factor affecting the safety production of DongPang mine field.Finding out development character of middle and small fault structure in DongPang mine field is to provide the geological premise for mining design of coal mine and working face layout. Based on the analysis of real data, 20 factors affecting the development of middle and small fault structure are summarized. And on the fractal theory, the fault fractal dimension value is worked out ;and then the key factors affecting the development of middle and small fault structure are filtrated by means of regression analysis, finally the relation of fault fractal dimension and the key factors affecting fault structure development is analyzed by using the grey relational analysis method. The results showed that fault fractal dimension can be used as comprehensive index of quantity, scale, combination form, horizontal extending length and inhomogeneity of distribution of fault structure. And the bigger its value is, the more fault structure is developed. Hence, fault fractal dimension is a reliable index denoting development degree of middle and small fault structure in DongPang mine field. Keywords: fault fractal dimension; middle and small size fault structure; fractal theory; DongPang mine field of China I.I NTRODUCTION A lot of researches have indicated that the distribution of fault structure and geometric shape have the fractal structures[1-2]. Fractal feature of fault structure with different scales of crust has been studied respectively by Turcotte, Li Ben-liang, Lu Xin-wei, Shen Zhong-min etc, it was pointed out that the spatial distribution characteristics and self-similarity of fault structure can be described quantitatively by fractal value, Berry and Lewis hold that the size of fractal value of fault system is a comprehensive embodiment of quantity, scale, combination form of fault and dynamic mechanism.[3-6] Fault structure in DongPang mine field developed very well, according to statistics there are nearly 200 faults. Middle and small fault structure is the key geological factor affecting coal production. According to the data of the districts where the middle and small fault structure had been disclosed, influencing factors of fault development are analyzed and summarized; in unmined districts, the degree of medium feature. And so analyzing the feature of middle and small fault structure development is very important and basic work. Based on Fractal Theory in the paper, research shows that fault reference cone is reliable index denoting development degree of middle and small fault structure. II.T HE FACTORS BEING fault development will be forecast by structural LIKELY TO AFFECT THE S ng mine itions of the factors affecting the d ture easures(Mxhd):the total ormality of the thickness of coal mea Mxhd_pjz ?In the equation of co ness of main mine of the thickness of coal seam Mchd_pjz ?In the equat of co overlying strata (Jyh DEVELOPMENT OF MIDDLE AND SMALL FAULT TRUCTURE AND QUANTIZATION OF ITS INDEXES Proceed from the actual conditions of DongPa field, the factors which are likely to affect middle and small fault structure development are fined for 14 indexes, and the features of fault development are fined to 6 indexes. A.The defin evelopment of middle and small fault struc and the method of quantization (1)The thickness of coal m of thickness of shanxi formation and taiyuan formation (2)Abn sures(Mxhdyc): The difference between borehole thickness of coal measures and average thickness of coal measures in DongPang mine field Mxhdyc˙Mxhdˉ ? , Mxhd_pjz is average thickness al measures in DongPang mine field (3)coal seam thickness(Mchd): thick able coal seam (4)Abnormality (Mchdyc): the difference between borehole or unit thickness of coal seamand average thickness of coal seam in DongPang mine field Mchdyc˙Mchdˉ ion?, Mchd_pjz is average thickness al seam in DongPang mine field (5)Bedrock thickness of coal d):Total thickness of strata above main mineable coal seam, namely not including thickness of overlying strata series of main mineable coal seam of loose overburden layer 2010 International Conference on Computing, Control and Industrial Engineering
近断层地震动对结构抗震设计的影响研究
28国 际 地 震 动 态 2011年 近断层地震动对结构抗震设计的影响研究 李 明 (中国地震局工程力学研究所,哈尔滨 150080) 中图分类号: T U352.1; 文献标识码: A; doi:10.3969/j.issn.0235 4975.2011.02.012 地震是危害人类生命财产安全最严重的突发式自然灾害之一。尤其是近10年来几次主要大地震,造成的城市基础设施破坏、人员伤亡和财产损失令世人触目惊心。历经50余年的研究,各国学者已达成共识,一致认为近断层(也称近场或近源)地震动呈现了较一般远场地震动更复杂的特征是引起工程结构破坏的一个重要原因,并围绕近断层地震动,开展了大量研究,主要包括近断层地震动的模拟、近断层地震动参数衰减关系、近断层地震动对工程结构的破坏作用分析及针对近断层地震动的隔震与消能减震措施研究等。但迄今也没有形成系统的可供实际工程应用的考虑近断层地震动影响的结构设计或加固理论,尤其是在我国。 在工程设计或加固时,首先需要判断拟建或已建建筑是否位于近断层区域,其次需要确定采用哪种结构设计方案,最后需要确定采用哪种设计谱和符合哪些条件的输入地震动。为解决这些问题,本研究主要完成了以下几方面工作:划分了近断层区域;提出了我国抗震规范设计谱在考虑近断层地震动时的调整建议;给出了近断层脉冲型地震动的合成方法;分析了近断层脉冲型地震动各要素对结构破坏作用的影响;指出了考虑近断层脉冲地震动影响的结构设计方案,提出了近断层脉冲型地震动作为输入地震动的选择方法。研究的主要内容和结论如下: (1)提出了基于破坏势参数划分近断层区域的方法。在划分近断层区域时,提出了相对断层距的概念,即断层距和矩震级的比值(dr/M W)。基于PEER数据库中的强震数据,充分分析了以往用于表征近断层地震动潜在破坏势参数随相对断层距的变化,并以其中适合划分近断层区域的破坏势参数划分了近断层区域。以体现方向性效应和上/下盘效应地震记录的分布范围旁证了划分结果的合理性。 (2)比较了近断层脉冲型、近断层非脉冲型、远场脉冲型和远场非脉冲型4类地震动的弹性和非弹性反应谱,分析了其对我国抗震规范设计谱和非弹性位移计算的影响。结果表明:近断层脉冲型地震动对我国抗震规范设计谱的影响主要体现于动力系数谱的特征周期,对谱函数形式和最大值取值无明显影响;当考虑近断层脉冲型地震动影响时,我国抗震规范规定的非弹性位移简化计算方法偏于危险。给出了考虑近断层脉冲型地震动影响的动力系数谱调整建议,建议采用时程分析法补充计算我国抗震规范规定的可采用非弹性位移简化计算方法计算的结构。 (3)分析了以往等效速度脉冲模型存在的不足之处,提出了新的等效速度脉冲模型;分析了已有脉冲周期和脉冲速度峰值识别方法的局限性,提出了首先采用汉宁窗平滑脉冲型地震记录,再通过平滑后的地震记录,识别脉冲周期和脉冲速度峰值的方法,并验证了识别方法的合理性;改进了近断层脉冲型地震动的合成方法。 (4)系统、深入地分析了近断层脉冲型地震动各要素对弹性、非弹性反应谱及框架和框架剪力墙结构破坏作用的影响,从本质上分析了前人提出的能量密度(E )、最大增量速度
小江断裂带简介
小江断裂带简介 云南省境内的小江断裂是川滇活动地块和稳定的扬子地块边界,它北起滇川边界金沙江的巧家县北,向南经东川、宜良、通海、建水,最后并入红河断裂,走向近南北,平均水平滑移速率10 mm/s。自东川小江村起,小江断裂分东西两支,近乎平行向南延伸。小江断裂是一条构造成熟度较低的断裂带,带内有多条次级断层,彼此雁行排列,形态复杂,不仅断裂阶区多,断层面陡且转弯亦多,这些部位常处于闭锁状态, 应力易强烈集中而引发强震,1500年以来仅在小江断裂的云南段上就发生10多次大于6级的地震。 例如: 1500年1月4日宜良7.5级地震, 1571年 9月9日通海6.3级地震, 1588年6月18日曲江7.75级地震, 1713年寻甸6.76级地震, 1725年万寿山6.75级地震, 1733年东川7.75级大地震, 1763年12月30日江川6.5级地震, 1789年6月7日华宁西北7.0级地震, 1799年石屏宝秀7.0级地震, 1833年9月6日嵩明8.0级大地震, 1887年12月16日石屏7.0级地震, 1909年5月11日华宁6.5级地震, 1966年2月5日东川6.5级地震, 1970年1月4日通海7.7级地震。 1500年以前小江断裂上也曾发生过许多次大地震,例如,1377年 (明洪武十年) 江川地震,明星弯子沟一个村在地震陷落入湖中 (云南省江川县志) 。历史上俞元古城可能在北魏至唐代之间一次大地震中沉入抚仙湖。 历史上对1833年9月6日 (清道光十三年) 云南嵩明州杨林8级地震有较详细的记载。“计十余州县相次厄,或裂或坟,或高者谷,或渊者陵,滇池水腾,震延千里。嵩明等州县计倒瓦草房八万七千六百二十余间,压死六千七百余人”。