雅思 图表作文写作技巧范文
Task1图表作文写作技巧(一)
一、 认识图表作文
20分钟150单词,占写作考试总分值的三分之一,描述一个或几个图表。
线性图(line graph/chart );柱状图(bar graph/chart );饼状图(pie graph/chart );表格(table );流程图(process diagram )
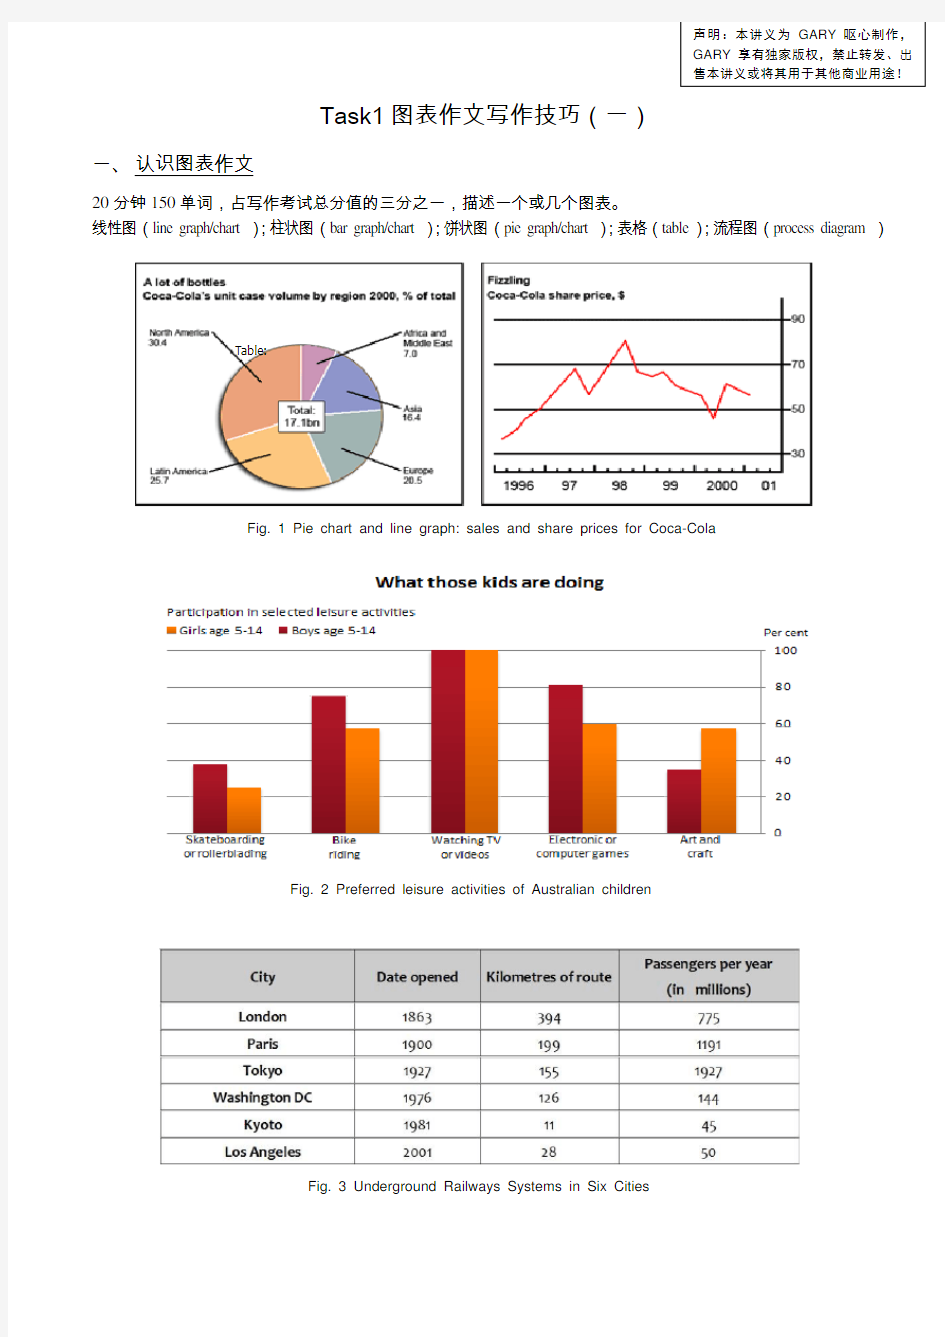
Table:
Fig. 1 Pie chart and line graph: sales and share prices for Coca-Cola
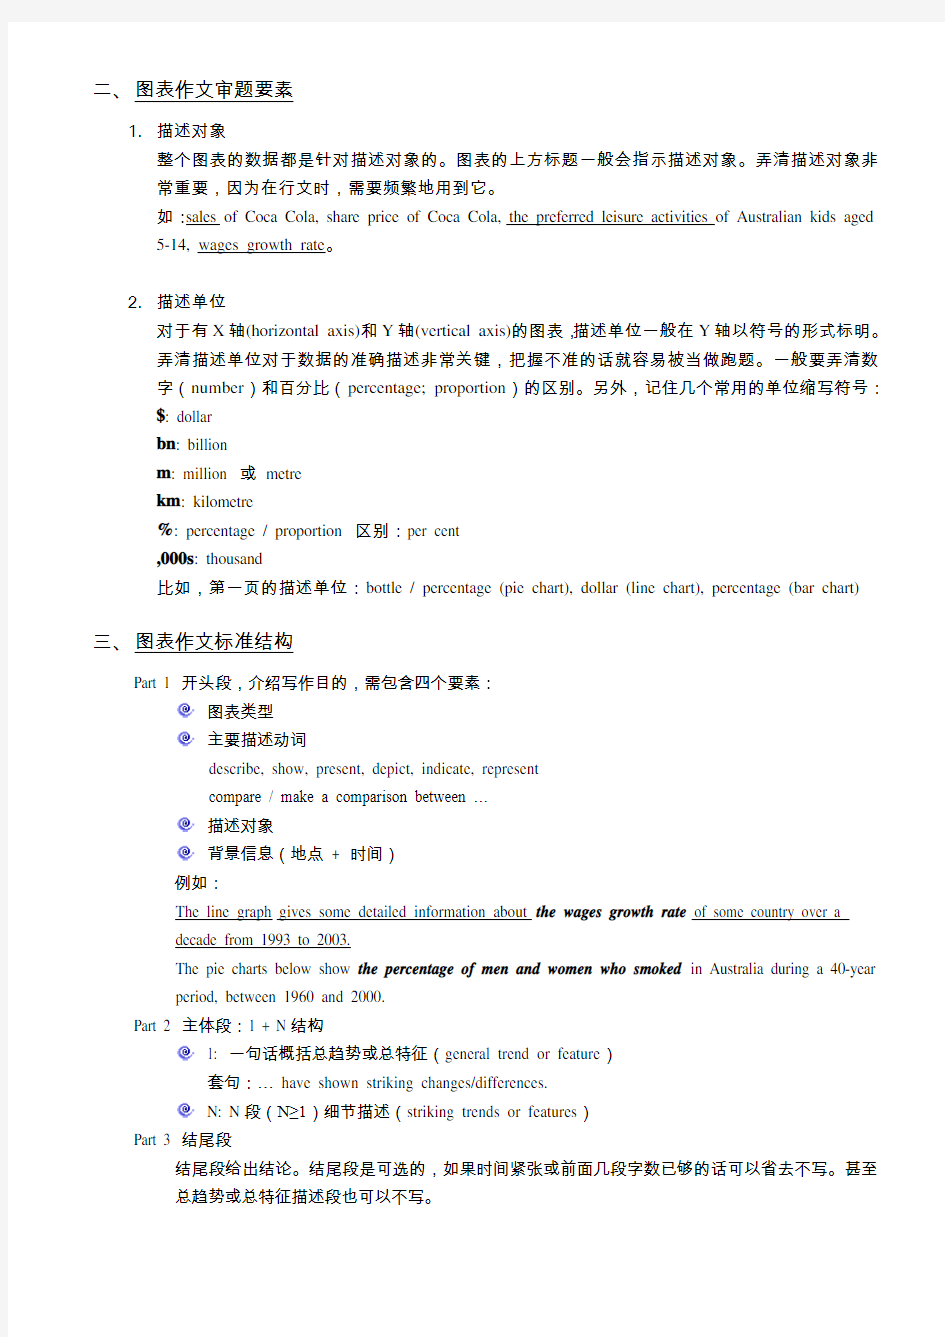
Fig. 2 Preferred leisure activities of Australian children
Fig. 3 Underground Railways Systems in Six Cities
二、图表作文审题要素
1.描述对象
整个图表的数据都是针对描述对象的。图表的上方标题一般会指示描述对象。弄清描述对象非常重要,因为在行文时,需要频繁地用到它。
如:sales of Coca Cola, share price of Coca Cola, the preferred leisure activities of Australian kids aged 5-14, wages growth rate。
2.描述单位
对于有X轴(horizontal axis)和Y轴(vertical axis)的图表,描述单位一般在Y轴以符号的形式标明。
弄清描述单位对于数据的准确描述非常关键,把握不准的话就容易被当做跑题。一般要弄清数字(number)和百分比(percentage; proportion)的区别。另外,记住几个常用的单位缩写符号:$: dollar
bn: billion
m: million 或metre
km: kilometre
%: percentage / proportion 区别:per cent
,000s: thousand
比如,第一页的描述单位:bottle / percentage (pie chart), dollar (line chart), percentage (bar chart) 三、图表作文标准结构
Part 1 开头段,介绍写作目的,需包含四个要素:
图表类型
主要描述动词
describe, show, present, depict, indicate, represent
compare / make a comparison between …
描述对象
背景信息(地点+ 时间)
例如:
The line graph gives some detailed information about the wages growth rate of some country over a
decade from 1993 to 2003.
The pie charts below show the percentage of men and women who smoked in Australia during a 40-year
period, between 1960 and 2000.
Part 2 主体段:1 + N结构
1: 一句话概括总趋势或总特征(general trend or feature)
套句:… have shown striking changes/differences.
N: N段(N≥1)细节描述(striking trends or features)
Part 3 结尾段
结尾段给出结论。结尾段是可选的,如果时间紧张或前面几段字数已够的话可以省去不写。甚至
总趋势或总特征描述段也可以不写。
示例:
The graph below gives information on wages of some country over a ten-year period. Write a report for a university tutor describing the information shown.
The line graph describes the growth rate of wages in some country from year 1993 to year 2003.
As can be seen from the graph, the wage growth rate shows a feature of significant fluctuation within the decade.
The growth starts at two per cent in 1993, but it doesn’t stay there very long before it rapidly doubles in 1994. Further on, the percentage declines to three per cent in 1995, stays steady for a year, before it starts to rise slowly and ends up at just under four per cent in 1997. 1998 is the best year where the wages rate peaks at six per cent.
However, after 1998 the wages rate declines nearly every year. Only a year after, the percentage drops to well under three per cent, stays there at roughly three per cent till 2000. In 2002 the wages rate reaches the lowest point of just one per cent growth. Luckily the growth rises in 2003 to just under two per cent.
Overall, the growth rate in wages in some country has shown striking changes through the ten years. (183 words)
1.时间段的表达(例:1993—2003)
between 1993 and 2003
from 1993 to 2003
over / during the years / period between 1993 and 2003
over / during the years / period from 1993 to 2003
over / during the years / period spanning from 1993 through 2003
over + 一段时间
2.1+N中的1(总趋势或总特征)的引出结构:
As can be seen, …
As can be seen from the graph, …
According to the graph, …
The graph leads us to the fact that …
- 3 -
We can see from the graph that … 3. Task1中的时态问题
Task1对时态的要求也没有Task2那么严格。不论发生在过去还是现在的数据,都可以用一般现在时态;当然,也可以根据图表中的具体数据选择时态。如:如果图表中既有过去的数据,又有将来的数据,我们的处理方式有两种。第一种:全部用一般现在时态。第二种:发生在过去的数据用一般过去时,发生在现在的用一般现在时态,发生在将来的用一般将来时态。
四、 图表作文单项写作技巧
line graph: 3456N 技巧
三大核心趋势描述句型及衍生句型、四大趋势、五个关键点、六组核心介词、N 个程度词
1. 四大趋势
趋势与关键点是折线图写作的基本构成元素,之后的介词、程度词、趋势描述句型都是围绕着二者展开的。
注:分别需记住各自的动词和名词形式,因为不同的词性要用在不同的趋势描述句型之中; 根据词性的不同,分别叫做“趋势动词”和“趋势名词”;
趋势描述名词前一般要加上不定冠词a/an 。
2. 五个关键点
即starting point 起点, ending/closing point 终点, peak(highest point)最高点/最大值, bottom(lowest point)最低点/最小值, intersection/crossing point 交叉点(常出现于多条线时)。
3.六组关键介词
图表写作专用介词,与趋势动词或名词搭配,是准确描述趋势的基础与关键!
AT 在某一点(静态概念)
搭配:
begin / start at 以……值开始
end (up) / wind up / close at 以……值结束
peak at 达到最高值/点
bottom at 降到最低值/点
level out at 维持在……
stabilise at 维持在……
remain stable / steady at 维持在……
stay constant at 维持在……
stand / dwell at 在(任意的某一点)
句型:In 2040, the percentage of Japan’s senior citizens aged 65 and above will be the highest, at about 27%.
(at前的逗号可省略)
TO 上升或下降到某一点(动态概念)
搭配:趋势动词/名词+ to;趋势动词/名词+ from A to B
例如:
The wages growth rate rises to 6%. (趋势动词短语)
The wages growth rate shows a rise to 6%. (趋势名词短语)
The wages growth rate rises from 2% to 6%. (趋势动词短语)
The wages growth rate shows a rise from 2% to 6%. (趋势名词短语)
BY上升或下降的幅度(相当于汉语的“了”,一般作为附加结构放在主要趋势描述句的后面)例如:The wages growth rate rises from 2% to 6%, an increase by/of 4%. 或:
The wages growth rate rises by 4%. (这里不能用of)
AROUND在某个点上下
搭配:fluctuate / oscillate / sway / waver / sway around
例如:The wages growth rate fluctuates around 3 per cent.
BETWEEN在某个区间内
搭配:fluctuate / oscillate / sway / waver / sway between A and B
例如:The wages growth rate fluctuates between 2% and 4%.
ABOVE/OVER, UNDER/BELOW 在某个点之上或之下
例如:The wages growth rate drops to under 3% in 1999.
(在图表作文里,像to和under两个介词堆砌在一起的情况是正常的,因为under和3%一起表示一个具体的点)
- 5 -
4.N个程度词
程度词用于修饰趋势动词或名词,使趋势描述更加精确。下框加粗的部分为重点掌握字汇。
e xactl y
precisely
5.三大核心趋势描述句型
456N所涉及知识点都是为三大核心句型做准备。我们先从最基本的而趋势描述句型入手。
例句一:工资增长率从3%上升到6%。
句型一:描述对象+ 趋势动词短语
The wages growth rate rises from 3% to 6%.
句型二:描述对象+ SEE / SHOW / EXPERIENCE + 趋势名词短语
The wages growth rate sees / shows / experiences a rise from 3% to 6%. (又见see结构!) 句型三:THERE IS + 趋势名词短语+ IN + 描述对象
There is a rise from 3% to 6% in the wages growth rate.
例句二:某个国家的工资增长率从1996年的约3%明显地增长到1998年的6%
注意到没?例句二在例句一的基础上增加了描述对象修饰语、时间(年份)、程度词等元素,在使用的时候需要注意把他们放在合适的位置。请看翻译:
句型一:
The wages growth rate of some country rises remarkably from roughly 3% in 1996 to 6% in 1998.
句型二:
The wages growth rate of some country shows a remarkable rise from roughly 3% in 1996 to 6% in 1998.
句型三:
There is a remarkable rise from roughly 3% in 1996 to 6% in 1998 in the wages growth rate of some country.
6.趋势描述句型的衍生表达
三大基本句型是把起始值和结束值用一个趋势短语结合起来。在实际写作中,为了使句子富有变化,描述更加灵活,经常也会把趋势描述句型打散。另外,折线图经常以多线结合的形式出现,如果出现两条或多条线交叉的情况,还需要用相应的句型表达把交叉点前后各条线之间数值对比的变化描述出来。以下图为例。
A)打散一个完整的趋势表达
例:美国65岁及以上人口比例从1940年的约8%明显地上升到2040年的约23%。
基本表达:The percentage of the USA’s citizens aged 65 and over grows significantly from around 8% in 1940 to approximately 23% in 2040.
衍生表达一:
The percentage of the USA’s citizens aged 65 and over starts at around 8%, and then grows significantly to approximately 23% in 2040.
衍生表达二:
The percentage of the USA’s citizens aged 65 and over starts at around 8%, grows significantly thereafter (从那之后), and finally closes at approximately 23% in 2040.
B)描述一个总趋势里面的小趋势
- 7 -
例:美国65岁及以上人口比例从1940年的约8%明显地上升到2040年的约23%,但是在1980年到2020年之间有一个微小的下跌。
表达示例一:
The percentage of the USA’s citizens aged 65 and over grows significantly from around 8% in 1940 to approximately 23% in 2040. However, over the period between 1980 and 2020, the figure sees an insignificant downward trend. (注意:however在表达小趋势时的应用,另外,特别注意the figure 经常用在图表作文里面用于替代重复、冗长的描述对象)
表达示例二:
The percentage of the USA’s citizens aged 65 and over grows significantly from around 8% in 1940 to approximately 23% in 2040, except over the period between 1980 and 2020, when the figure sees an insignificant downward trend. (注意:except和when引导的定语从句在表达小趋势时的应用)
C)描述交叉点
对于两条线的交叉点,一般的处理方式是把交叉点前后的数值对比变化描述出来。有时也会交叉点所对应的具体数值。
例:
在1940年,瑞典65+的人口比例约7%, 比美国略低。之后,这个数值开始显著上升,并在2000年之后超过美国的65+人口比例。最后,这个数值在2040年以约25%结束。
注:这个范例实际上反映了多条折线写作(或者说是所有图标类型写作)的一个基本理念,即要多比较(如:比美国略低、超过美国65+人口比例)。
表达示例:
In 1940, the percentage of Sweden’s citizens aged 65 and over stands at around 7%, which is slightly lower than that of the USA. Afterwards, the figure begins to go up strikingly until it surpasses that of the USA after 2000, and finally closes at roughly 25% in 2040.
(注意:afterwards …until …and finally closes at 将整个交叉数据完整地描述出来。另外注意:surpass表示“超过”的意思)
D)将B)小趋势和C)交叉点结合起来
对于示例中的瑞典曲线,光把它跟美国的曲线对比还是不够的,还需要把前者内部的小波动趋势指出来。
例:
在1940年,瑞典65+的人口比例约7%, 比美国略低。之后,这个数值开始显著上升,并在2000年之后超过美国的65+人口比例。最后,这个数值在2040年以约25%结束。值得注意的一点是,在1980到1990,以及2010到2030年之间,瑞典的这个数值呈现出略微的下降。(或:值得一提的是,在1980到2030年间,瑞典的这个数值呈现出略微的波动。)
表达示例:
In 1940, the percentage of Sweden’s citizens aged 65 and over stands at around 7%, which is slightly lower than that of the USA. Afterwards, the figure begins to go up strikingly until it surpasses that of the USA after 2000, and finally closes at roughly 25% in 2040. One noteworthy point is that the
figure for Sweden shows slight declines between 1980 and 1990, as well as between 2010 and 2030.
(OR: One noteworthy point is that the figure for Sweden shows a slight fluctuation between 1980 and 2030.)
E)before表示“然后”
The proportion of Japan’s population aged 65 and over drops from exactly 5% in 1940 to about 3% in the 1980s, before it rises steadily to 10% in 2030. After that, …
F)替代词:that of …. / the figure for …
The wages growth rate of the US keeps growing, while the figure for / that of Japan shows a continuous downward trend during the same period.
G)关联词
while / whereas / whilst 而
例:The wages growth rate of the US keeps growing, while the figure for Japan shows a continuous downward trend during the same period.
specifically, to be specific 具体来讲
on the contrary, i n/by contrast, on the other hand, unlike…, 与之相反
稍带主观性的关联词:interestingly 有趣地是surprisingly, staggeringly 令人惊讶的是
alarmingly 值得警醒的是unnervingly 令人担忧的是
五、翻译练习
1.某个国家的工资增长率从1993年的2%上升到了1994年的4%.
The rate of wage growth in some country rises from 2% in 1993 to 4% in 1994.
2.可口可乐的股票价格(share price)从1998年的80%跌到了1999年的55%.
The share price of Coca-cola drops from 80% in 1998 to 55% in 1999.
3.上世纪60年代到90年代澳大利亚男性烟民的数量呈波动特点。
The number of male smokers in Australia from 1960s to 1990s shows the feature of fluctuation.
4.可口可乐的股票价格在1998年第三季度达到80%的峰值。
The share price of Coca-cola peaks at 80% in the third quarters of 1998.
5.加拿大的小麦出口量在1989年跌倒1,400万吨的最低值。
The wheat exports in Canada bottoms at 14 million tons in 1989.
6.伦敦地铁站的乘客数量从上午8点的400人陡然降到10点的180人,减少了220人。
The number of passengers in London Underground Station falls dramatically from 400 at 8 a.m. to 180 at 10 a.m., a decline by/of 220.
7.澳大利亚日本游客的比例从1985年的2%迅速增长到1989年的7%,增加了5%。
The percentage of Japanese tourists in Australia booms from 2% in 1985 to 7% in 1989, an increase by/of 5%.
8.某国十年间的工资增长率大致在3%上下波动。
The rate of wage growth of some country fluctuates around 3% within the decade.
9.某国的工资增长率从2002年的1%爬升到2003年的2%以上。
The rate of wage growth in some country climbs from 1% in 2002 to above 2% in 2003.
10.欧盟的小麦出口量在2007年大致维持在3,200万吨的水平。
The wheat exports of EU level out approximately at 32 million tons.
- 9 -
六、 写作训练
1. 填空题
The
graph
shows
changes
in
households ’ car ownership in Great Britain by _percentage_ _over_ a period of 36 years.
Overall, car
ownership in Britain
increased _between_ 1971 and 2007. In particular, the number of households with two cars rose, while the number of households _with_ a car fell.
In 1971, _nearly_ half of all British households did not have regular use of a car.
Around 44% of households had one car, but only about 7% had two cars. It was uncommon for families to own three or more cars, _with_ around 2% of households falling into this category.
The one-car household was the most common type from the late 1970s _on_, although there was little change in the _percentage_ for this category. The biggest change was seen in the proportion of households without a car, which fell steadily over the 36-year period _to_ around 25% in 2007. In contrast, the proportion of two-car families rose steadily, reaching about 26% in 2007, and the proportion of households with more than two cars rose _to_ around 5%.
2. 写作训练
You should spend about 20 minutes on this task. The line graph below shows changes in the amount and type of fast food consumed by Australian teenagers from 1975 to 2000. Summarize the information by selecting and reporting the main features and make comparisons where relevant. Write at least 150 words.
pizza
fish and chips
hamburgers
雅思小作文柱状图Bar类解析
雅思小作文柱状图Bar类解析 关于柱状图我们主要分两种写法: 1.如果横轴有明显的时间推移的话,烤鸭们应连接柱子顶点,重在描述柱子的升降起伏,写法类似于线状图。 2.如果无时间推移,则写法和饼状图一样。即按照各比较对象所占比例的高低写,同时要注意各所占比例之间的比较。 可以用到的词汇有: 1.表示“占多少”的动词 Account for Take up Make up Contribute to Have Represent 2.表示“最高级”和“比较级” 第一/最小the largest/biggest proportion of 第二the second/next largest/expensive(+ 形容词的最高级) 第三followed closely by 最低/最小the smallest percent of all 3.表示“相同比例” 即在饼状图中遇到了比例相同或者差不多的饼,如有A B两个比较对象。 A accounts for the same percentage as B . The proportion of A is as high as B A and B contributed equally/evenly to (all ) 在观察柱形图的时候首先要留意横轴的数据,若横轴为时间轴或者是年龄趋势,那么我们在主体段写作时候的基本思路就为从左到右;若横轴数据为具体专有名词诸如地点,交通工具等时,主体段的写作思路就可能是按照柱形的长度排列。本文根据上述的分析做以下的总结: 一、按照横轴从左到右排列数据: 1. 两根柱且趋势截然相反 在这种写法中,我们要注意观察2根柱的上升/下降的幅度。以下我们就来看一个例子:
雅思小作文地图题
雅思小作文题型多样,其中就包括地图题,本文将详细讲解雅思小作文地图题写作技巧。评分标准 ?TA – Task Achievement 任务完成情况 ?CC – Coherence and Cohesion 意合与形合 ?LR – Lexical Resource 词汇资源 ?GRA – Grammatical Range and Accuracy 语法广度与精确度 审题 The map below shows the development of the village of Ryemouth between 1995 and present. 文章结构 第一段 交待写作目的 第二段 描述1995年的地图 第三段
拿现在的地图和95年的做对比 第四段 总结全文 第一段 This report compares how the village of Ryemouth has developed and changed since the year of 1995. 题目:The map below shows the development of the village of Ryemouth between 1995 and present. 第二段 As is clearly described in the first picture, Ryemouth was a coastal city which was divided into three parts by two roads. In the southern part, there was a fishing port on the sea, with a fish market located in the north and a coffee shop in the north-east. A block of shops was situated on the opposite side of the market… 第三段 In the second picture, the village changed a lot. The fishing port has been removed and the fish market is replaced by apartments. Several restaurants also occupy the place of the shops on the roadside. Moreover, a parking lot is newly built on the east of the hotel. In addition, … 第四段 Overall, based on the brief description above, it is clear that the general layout of the village does not change a lot, while some newly-built facilities and housing has ornamented the small village.
雅思小作文之图表作文
二.雅思图表作文 1.企业垃圾(线性图) 题目:The graph below shows the amounts of waste produced by three companies over a period of 15 years. 范文:The line graph compares three companies in terms of their waste output between the years 2000 and 2015. It is clear that there were significant changes in the amounts of waste produced by all three companies shown on the graph. While companies A and B saw waste output fall over the 15-year period, the amount of waste produced by company C increased considerably. In 2000, company A produced 12 tonnes of waste, while companies B and C produced around 8 tonnes and 4 tonnes of waste material respectively. Over the following 5 years, the waste output of companies B and C rose by around 2 tonnes, but the figure for company A fell by approximately 1 tonne. From 2005 to 2015, company A cut waste production by roughly 3 tonnes, and company B reduced its waste by around 7 tonnes. By contrast, company C saw an increase
雅思经典图表作文范文
# 43. You should spend about 20 minutes on this task. The table below shows CO2 emissions for different forms of transport in the European Union. The Pie Chart shows the percentage of European Union funds being spent on different forms of transport. You should write at least 150 words.
model answer: The chart shows CO2 emissions per passenger kilometre for variuos methods of transport in the European Union while the pie chart shows European Union spending on transport. Flying by air produces by far the greatest CO2 emissions, approximately three times as much as passenger cars which are the next largest producers. Very little is spent by the EU on air travel while roads make up more than half of the EU transport budget. Trains produce about three times less CO2 emissions per passenger kilometre than passenger cars and eight times less than air travel. Nearly a third of EU transport funds are spent on railways. Ships are a clean form of transport and produce about the same amount of CO2 per passenger kilometre as trains do. However, only 2 percent of EU funds are spent on ports. A further one percent is spent on inland waterways. Coaches are the cleanest form of transport. Emissions of CO2 per passenger kilometre from coaches are half those of buses. Buses emit less than half as much CO2 per passenger kilometre as cars. The European Union spends 10 percent of its transport budget on public transport, such as buses and coaches. (197 words)
雅思7分大作文范文批改和解析
雅思7分大作文范文批改和解析 距离雅思写作7分你大概还有3个步骤要走,是的,不是谁都可以轻轻松松活动雅思高分的。今天给大家带来了雅思7分大作范文批改和解析,希望能够帮助到大家,一起来学习吧。 雅思7分大作范文批改和解析 雅思写作提高第一步:结构(5.0 - 5.5) 问题:出国留学的优点(the advantages of disadvantages of study abroad) 同学:One reason for those who decide to go overseas to get a higher degree is that they believe they can get better education in certain fields. That is to say, different universities in different countries have their specialized courses and rich resources can be provided according to their needs and requirements. Another reason is that they can learn a foreign language in a more efficient way. There is no denying that living in an all-round English environment and being affected by local culture make people quick learners. 解析:出国留学和高学历完全是两回事(出去读初中和高中都算出国);出国就是better education,在国内就不是better? 出
雅思图表作文TASK1精讲精练
雅思图表作文TASK1精讲精练
雅思图表作文TASK1精讲精练 A理论部分: 雅思小作文概论 1、文章结构:主要分三部分:i。introductory sentence;ii。body paragraph;iii。Concluding sentence 具体讲:第一段introductory sentence只要写一句话,交待图形(如the line graph, pie chart等等),描述对象(如图表描述的是the number of tourists visiting England),地点(如the US, the UK等)以及时间(如between 1988 and 1997等等);另外要注意的就是第一段不能和图表上方已给的句子太过相似!否则,会失分的! 第二部分一般写1~3段,这要视情况而定。这部分主要就是对比不同的数据,如相似或相同的数据;某个数据是另一个数据的2倍;某个数据所占比例最大或最小等等。 最后一段concluding sentence也只要写一句话,
主要是总结图表的整个趋势。 2。文章的效果。很多学生会发现小作文的例文特别简单(特别是剑桥书里提供的)。原因很简单,这个report的目的就是要让university lecturer了解某个事物的发展趋势,因此写出来的文章必须结构清晰、易懂,绝对不能太复杂,也不要把每个数据都描写出来,只要描写有代表性的,重要的数据即可。 以下为雅思小作文的四个基本步骤 第一步:改写题目 经过同义词转换在短短的1分钟内就写好作文的第一段。 举例:The graph below shows the percentage of people unable to find work in three major countries from 1983 to 1992. 题目中划线的单词都能够进行同义转换: graph—figure, show—illustrate, percentage—proportion, major—key, from…to…—between…and…, 第二步:分析时态
英语考试作文-9分雅思图表写作范文全集之地图篇 滨海村庄
英语考试作文 9分雅思图表写作范文全集之地图篇滨海 村庄 9分雅思图表小作文范文全集之地图滨海村庄The map below shows the development of a seaside village between 1995 and present.Write a short report for a university lecturer describing the information shown below.Write at least 150 words. 范文集结:全部9篇9分雅思写作地图范文汇总放送 参考范文: The two maps show the layout of the same seaside village in 1995 and at present. Overall, it is evident that the infrastructure for housing and recreation has increased at the expense of agricultural land and commercial fishing. The most notable changes are the disappearance of the fishing port and adjacent fish market, as well as the creation of a golf course and tennis courts in the north-east, where
farmland and a forest park were still found in 1995. furthermore, a new housing development containing apartments is now found on the waterfront at the former site of the fish market, and a number of restaurants have been built on the opposite side of the road where shops used to be. There was also an increase in the total number of houses, from 12 in 1995 to 16 at present. In addition, the road encircling a small housing development west of the main road has been extended further westward. The hotel and cafe in the south-east have remained as is. A new car park has been added next to the hotel. Total Words: 180 Task Achievement: 9 Coherence & Cohesion: 9 Lexical resources: 9 Grammar: 9 Overall Score: Band 9
G类雅思7分作文范文
G类雅思7分作文范文 Topic Some people say that older people should live with their adult children. Others say that they shouldn't. Which do you think is good practice. TEXT(257 Words) One of the topics in daily life is whether or not the older people should live with their adult children. My answer is the question is that it is better for them not to. Firstly, people of different ages have different ways of life. The old people like a quiet, peaceful and regular life whereas the young prefer noises, activities and unrestrained enjoyment. If they live together, old may feel that they are always disturbed and the young may feel that they are often handicapped. Secondly, people of different generations have different views and values. What is quite normal to the parents may seem to be old-fashioned or wrong to the children. When they live together, they may disagree on matters ranging from minor domestic matters to national and international issues. Consequently, family life may be unpleasant or even unbearable to both the old and the young. Last but not the least, adult children, like their parents, love independence and freedom, but their parents still take them as children and unintentionally interfere in their affairs. The situation will be worse if the adult children are already married. In this case, the children have already built a new and closed world and any outside interference may lead to conflicts. From what has been discussed above, we may safely draw the conclusion that if the parents and their adult children do not live together, both the old and the young can enjoy complete independence and freedom, live a life they like, and keep intact their affections for each other 雅思范文:电脑是否现代教育所必须? 成因 You should spend about 40 minutes on this task. Present a written argument or case to an educated non-specialist audience on the following topic. Are computers an essential feature of modern education? What subjects can be better taught using computers? Are there aspects of a good education that cannot be taught using computers? You should write at least 250 words. 提示 You should you your own ideas, knowledge and experience and support your arguments with examples and relevant evidence. Topic words: Computers Essential features / absolutely necessary Modern education / good education Task words: There are no specific task words. Three separate questions are given. Questions I should ask myself: Do I think computers are essential for education? What subjects do I think are best be learnt using computers? What do I think are the features of a good education, and are computers important in it?
英语考试作文-9分雅思图表写作范文全集之混合图篇 英国移民
英语考试作文 9分雅思图表写作范文全集之混合图篇英 国移民 9分雅思图表小作文范文全集之混合图题型:英国移民The chart below shows long-term international migration in UK. 范文集结:全部9篇9分雅思写作混合图范文汇总放送 真题传送门:2017全年雅思写作真题范文大汇总(第一时间更新) 范文: The chart gives information about UK immigration, emigration and net migration between 1999 and 2008. Both immigration and emigration rates rose over the period shown, but the figures for immigration were significantly higher. Net migration peaked in 2004 and 2007. In 1999, over 450,000 people came to live in the UK, while the number of people who emigrated stood at just under 300,000. The figure for net migration was around 160,000, and
it remained at a similar level until 2003. From 1999 to 2004, the immigration rate rose by nearly 150,000 people, but there was a much smaller rise in emigration. Net migration peaked at almost 250,000 people in 2004. After 2004, the rate of immigration remained high, but the number of people emigrating fluctuated. Emigration fell suddenly in 2007, before peaking at about 420,000 people in 2008. As a result, the net migration figure rose to around 240,000 in 2007, but fell back to around 160,000 in 2008.(159)
雅思小作文图表作文数据写法
1.介词 From..to.. - The number of divorces increased from 1m in 1970 to almost 1.5m. by, of(表示数值变化差,搭配from/to) 趋势动词+by -The proportion of married people decreased by 11% to about 59%. 趋势名词+of -The proportion of married people underwent a decrease of 11%. at(表示在某一点) -The number of marriages leveled off at 2.5 million during the first decade. -The minutes of local fixed line calls reached the peak at around 90 billion. With(带一个或几个静止的数值) - In 1979, beef was the most popular of these food, with about 225 grams per person per week. - Three of these countries shared similar figures with6.63% in Turkey, 6.51% Spain and 6.43% in Ireland. 2.括号 带静止数据 - Specifically, deforestation was the number one murder (9.8%), followed by over-cultivation and over-grazing (7.7% and 5.5% respectively). 带动态数据 - There was an overall slight increase in both nuclear and solar/wind (up by 3q and 2q respectively). - Both nuclear power and oil went up during the period, although the rise of oil was not as dramatic as that of nuclear power (from 15, 20 to 126, 25 respectively). 3.从句
作文范文之雅思小作文table
作文范文之雅思小作文table
雅思小作文table 【篇一:雅思小作文表格图实例分析】 雅思小作文表格图实例分析 朗阁海外考试研究中心 表格图是雅思小作文的常考图形之一,也是烤鸭们在备考时必须要准备的一类题型。那么烤鸭们具体应该如何准备表格图呢?下面,朗阁海外考试研究中心的专家将以一道具体的实例,就这一题型的解题思路和步骤做出详尽的分析和解答。 the table below shows personal savings as a percentage of personal income for selected countries in 1989, 1999 and 2009. personal savings as a percentage of personal income 一、审题,决定大体写作方式 首先,读题目,了解到这幅表格图是关于“几个国家的人民个人收入中存款的百分比”以及三个时间点(据此,正文部分描述存款率是时态基调为过去时)。表格上方的title和题目表述一样,没有额外信息,因此,读一遍即可。 然后,审具体表格,决定大致写作方向和方式,即分段方式。表格的审图需要注意以下几个方面:横轴,纵轴和总体数据特征。此图中的横纵轴分别是时间和7个研究对象——7个国 家。横纵轴中间有一栏为时间,那说明,此图原则上应该按曲线图原理来写——即,描述7个国家存款率上升或下降趋势;但是,经过下一步对表格中数据总体特征的总结发现:7个国家的存款率在这一段时间内总体呈现下降趋势。这一发现说明,如果继续按照曲线图原理描述,文章会非常单调,而且对比的空间也不大;相反,同一年份里,
雅思经典图表作文范文
#45. The charts below show the percentage of their food budget the average family spent on restaurant meals in different years. The graph shows the number of meals eaten in fast food restaurants and sit-down restaurants. You should write at least 150 words. Give reasons for your answer and include any relevant examples from your own knowledge or experience.
Over the past 30 years, the average family has dramatically increased the number of meals that they eat at restaurants. The percentage of the family's food budget spent on restaurant meals steadily climbed. Just 10 percent of the food budget was spent on restaurant meals in 1970, and 15 percent in 1980. That percentage more than doubled in 1990, to 35 percent, and rose again in 2000 to 50 percent. Where families eat their restaurant meals also changed during that 30-year period. In 1970, families ate the same number of meals at fast food and sit-down restaurants. In 1980, fam?ilies ate slightly more frequently at sit-down restaurants. However, since 1990, fast food restaurants serve more meals to the families than do the sit-down restaurants. Most of the restaurant meals from 2000 were eaten at fast food restaurants. If this pattern continues, eventually the number of meals that families eat at fast food restaurants could double the number of meals they eat at sit-down restaurants. (164 words)
2016.12.17雅思真题大作文7分范文
Task:Some people think getting old is entirely bad. However, others think that life of the elderly in modern world is much easier than in the past. Discuss both views and give your own opinion. 思路解析: 2016年雅思收官之战的作文来了一道新题,问当今社会老年人的生活是不是很 糟糕?说是新题,因为本题以前从未原题出现过,但关于年龄的话题却不缺少。 比如2010年7月10日“年轻人是否适合担任政府要职”,2012年3月10日“老 龄化现象的原因及解决方法”,2012年3月31日“年轻人和老年人谁的价值更 高?”,2013年6月8日“政府是否应该对老年人养老提供财政支持?”,2015 年1月1日“年轻人当领导,行不行?”,2015年4月11日“老年人与年轻人 争夺工作职位,怎么办?”等等。 本题需要论证的对立观点是:年老很糟糕 vs. 当今社会年老没有那么糟糕。那 么,变老有哪些坏处呢?首先,当然是身体条件没有以前好了,甚至可能出现多 种疾病(物质层面);其次,不工作了,与人的联系少了,心里可能会感觉孤单, 甚至感觉没有价值了(精神层面);最后,变老后对社会的依赖程度更高,给社会 增加了压力(社会层面)。那么,这些问题在当今社会是不是得到了解决呢?首先, 医疗条件的改善有助于保持老年人的身体状况;互联网的出现有助于缓解老年人 的心理孤单问题;物质水平的提高也降低了老年人给社会造成的压力。如此观之, 现代社会老年人的生活的确容易多了,但我的观点是:外部条件只是改善老年人 生活的一个方面,最重要的还是老年人自己要积极调整心态,努力适应退休后的 生活,从而过一个更幸福更祥和的晚年。 Sample answer: Getting old is a natural process that nobody really likes. When you reach a certain age, your physical conditions will inevitably deteriorate, and you may suffer from various kinds of diseases. When you retire, you will feel isolated because your previous work contacts may be all gone, then you may feel useless to the world. Furthermore, when you get too old, you’ ll have to rely heavily on the support from others, either physically or emotionally, and your life will become a great pressure to your family and the whole society as well. For all these bad things about getting old, many people argue that the life of the elderly today is much easier than in the past. In the first place, medical advances nowadays have made it possible for the old people to stay sound and healthy for quite a long while even after they retire. Diseases such as diabetes, hypertension and heart attack which might have
雅思大作文5分与7分范文各项指数对比分析
雅思大作文5分与7分范文各项指数对比分析 Let’s compare two answers to a question.The topic is as follows: International tourism has brought enormous benefit to many places. At the same time, there is concern about its impact on local inhabitants and the environment. Do the advantages of international tourism outweigh the disadvantages? A Poor Essay – The following is a band 5 essay. International tourism has brought enormous benefit to many places. At the same time, there is concern about its impact on local inhabitants and the environment. Do the disadvantages of international tourism outweigh the advantages? In my opinion advantages outweight the disadvantages. Firstly, many countries like Egypt or Tailand live from tourism Lots of people work there as a seilsmens or tourist guides. These countries without support of tourists wouldn’t be able to funtcion properly. Secondly, in countries visited by tourists are plenty of places where people just can’t pass because of rare animals or plant s. Another thing is that people like traveling and seeing new exotic places. They like lie on the beach or swim in ocean. Furthermore, tourism is now more growing industry highering tousands of people. There are makeing new places to work and to have fun. But on the other hand, people often for get that they aren’t the only beings on the planet. Many tourists are living garbage just anywhere. Some of them wan’t an exotic souvenir so they pay for illegal things like dea d or live animals or some sculpture. To sum up I think international traveling is a good thing but people must realise that there is something else besides them. They need to know that flora and fauna needs to be protected. People have to enjoy their holidays but alsow protect environment. Below is an analysis of this essay. Task Response The essay question has been copied and used as the introduction (paragraph 1). Once these 34 words are taken off the word count, the response is underlength at 194 words and so loses marks. Nevertheless, the topic is addressed and a relevant position is expressed, although there are patches – as in the third paragraph – where the development is unclear. Other ideas are more relevant but are sometimes insufficiently developed.