香港统计年鉴2020:3.14按主要来源地划分的服务输入
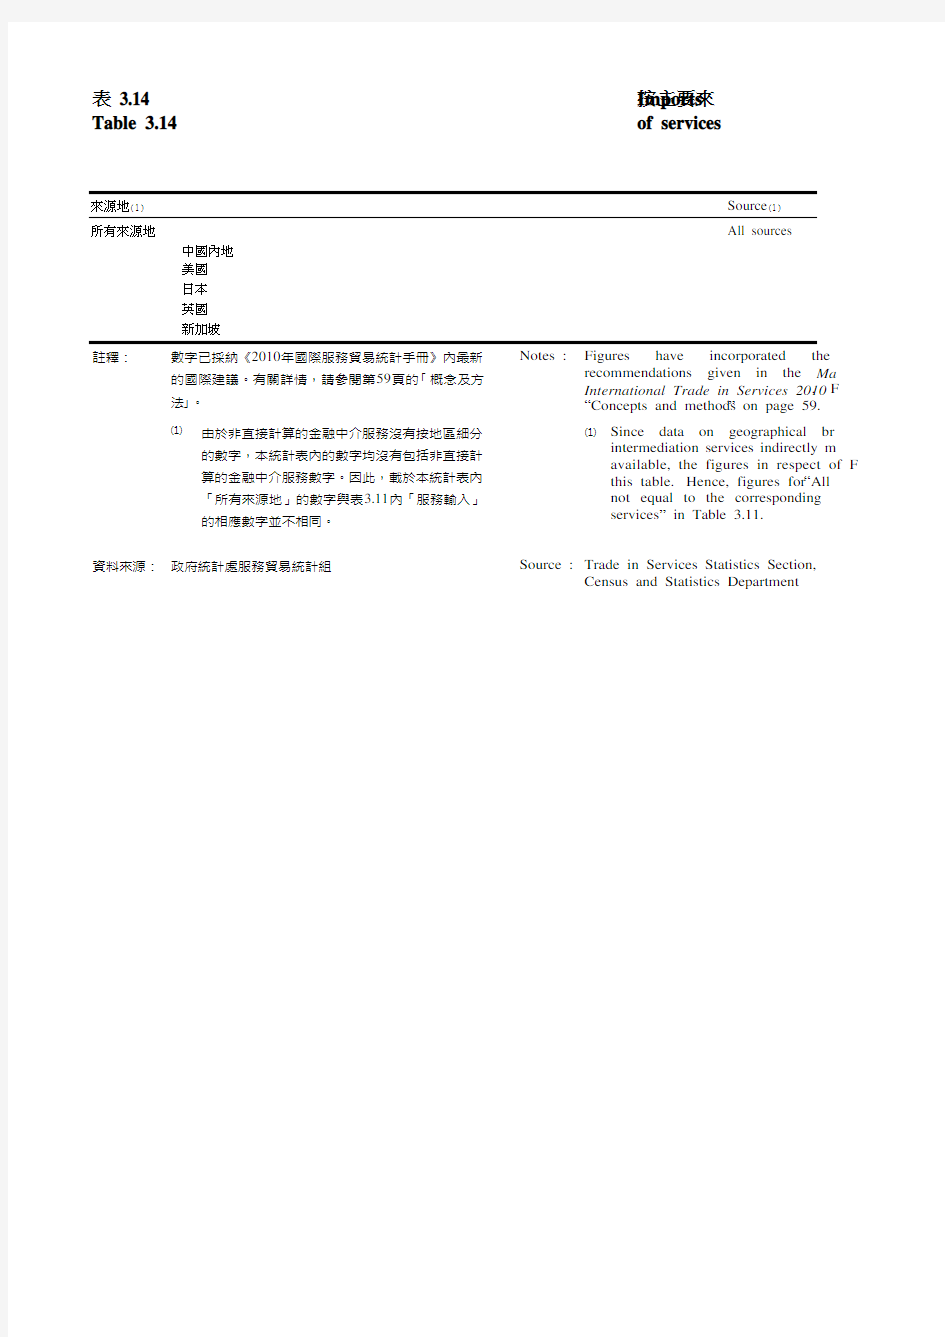

表 3.14按主要來Table 3.14Imports of services
來源地(1)Source (1)所有來源地
All sources
中國內地美國日本英國新加坡
註釋:
數字已採納《2010年國際服務貿易統計手冊》內最新的國際建議。有關詳情,請參閱第59頁的? 概念及方法?。
Notes :
Figures have incorporated the recommendations given in the Ma International Trade in Services 2010. F “Concepts and methods ” on page 59.
(1)
由於非直接計算的金融中介服務沒有按地區細分的數字,本統計表內的數字均沒有包括非直接計算的金融中介服務數字。因此,載於本統計表內「所有來源地」的數字與表3.11內「服務輸入」的相應數字並不相同。
(1)
Since data on geographical br intermediation services indirectly m available, the figures in respect of F this table. Hence, figures for “All not equal to the corresponding services ” in Table 3.11.
資料來源: 政府統計處服務貿易統計組
Source : Trade in Services Statistics Section,
Census and Statistics Department
2008
562,963 The mainland291,550 United States54,329 Japan30,494 United26,421 Singapore21,227 the latest international
e Manual on Statistics of
10. For details, please see the
9.
al breakdowns of financial
ctly measured (FISIM) are not
t of FISIM are not included in
“All sources” in this table are
ding figures for “Imports of
,
20132014201520162017
579,725569,724570,435574,520597,191*
* 235,908216,521221,651220,991228,311*
* 62,78363,12063,78765,57866,265*
* 39,26442,69744,55745,88749,922*
* 32,46033,62133,42133,32934,853*
* 26,61928,19125,48624,35325,662
百萬元$ million
2018 627,373 237,543 69,906 51,952 37,624 27,243