worldview3辐射定标的使用方法
Radiometric Use of WorldView-3 Imagery
Technical Note
Date: 2016-02-22
Prepared by: Michele Kuester
This technical note discusses the radiometric use of WorldView-3 imagery. The first two sections briefly describe the WorldView-3 instrument and general radiometric performance including the WorldView-3 relative spectral radiance response and relative radiometric correction of WorldView-3 products. Section 3 covers conversion to top-of-atmosphere spectral radiance and conversion to top-of-atmosphere spectral reflectance. WorldView-3 imagery MUST be converted to spectral radiance at a minimum before radiometric/spectral analysis or comparison with imagery from other sensors in a radiometric/spectral manner. The information contained in this technical note applies to the raw WorldView-3 sensor performance and linearly scaled top-of-atmosphere spectral radiance products. Caution is advised when applying the equations provided here to pan-sharpened products, dynamic range adjusted (DRA) products, or WorldView-3 mosaics with radiometric balancing because the generation of these products may apply non-linear transformations to the pixel DN values.
1 WorldView-3 Instrument
The WorldView-3 high-resolution commercial imaging satellite was launched on August 13, 2014, from Vandenberg Air Force Base. The satellite is in a nearly circular, sun-synchronous orbit with a period of 97 minutes, an altitude of approximately 617 km, and with a descending nodal crossing time of approximately 10:30 a.m. The revisit is 4.5 days at a greater than 20-deg off nadir angle. WorldView-3 acquires 11-bit data in 9 spectral bands covering panchromatic, coastal, blue, green, yellow, red, red edge, NIR1, and NIR2. An additional shortwave infrared (SWIR) sensor acquires 14-bit data in eight bands covering the 1100 to 2500 nm spectral region. See Table 1 for details. At nadir, the collected nominal ground sample distance is 0.31 m (panchromatic), 1.24 m (multispectral) and 3.7 m (SWIR). Commercially available products are resampled to 0.3 m (panchromatic), 1.2 m (multispectral) and 7.5 m (SWIR). The nominal swath width is 13.1 km (slightly less for the SWIR sensor). The WorldView-3 instrument is a pushbroom imager, which constructs an image one row at a time as the focused image of the Earth through the telescope moves across the linear detector arrays, which are located on the focal plane.
1.1 WorldView-3 Relative Radiance Response
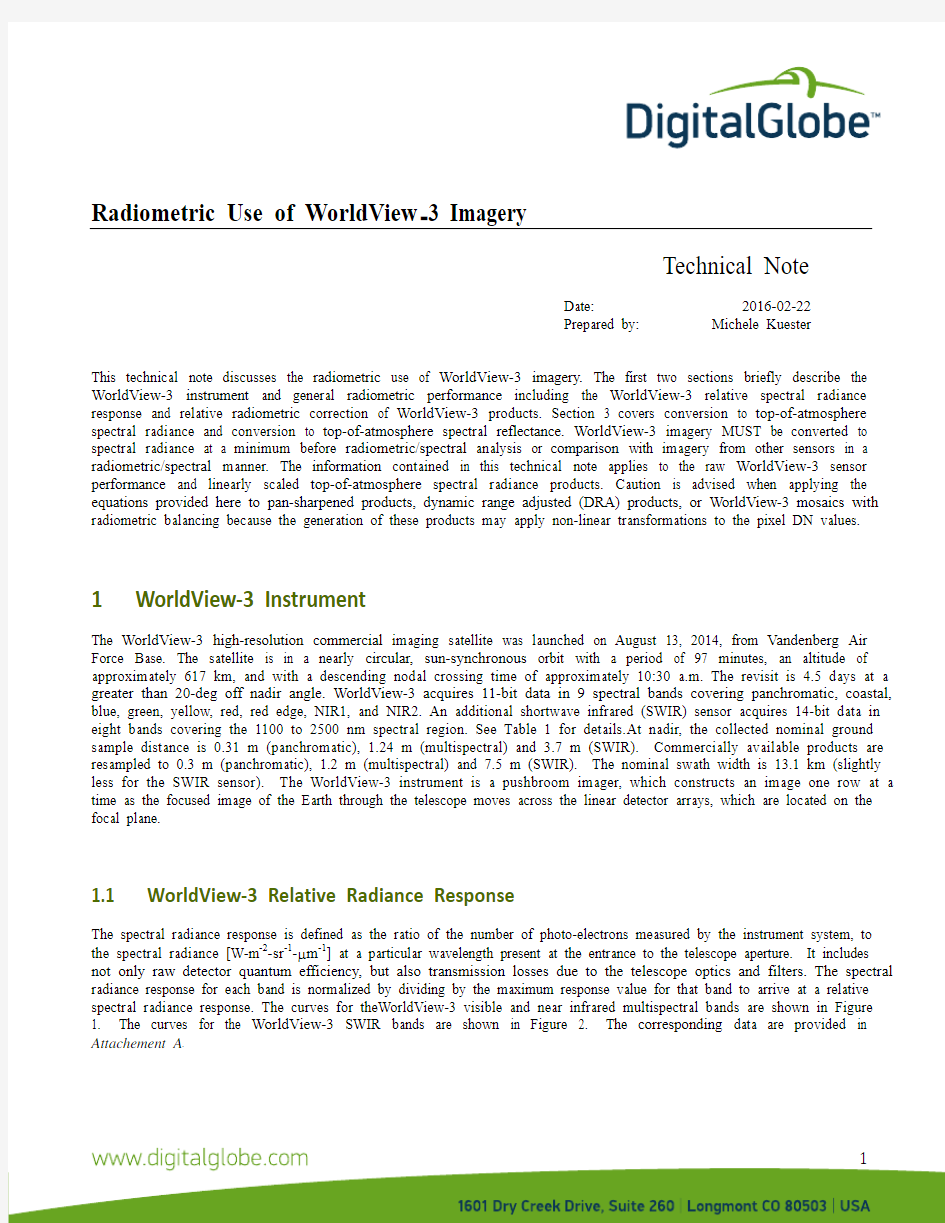
The spectral radiance response is defined as the ratio of the number of photo-electrons measured by the instrument system, to the spectral radiance [W-m-2-sr-1- m-1] at a particular wavelength present at the entrance to the telescope aperture. It includes not only raw detector quantum efficiency, but also transmission losses due to the telescope optics and filters. The spectral radiance response for each band is normalized by dividing by the maximum response value for that band to arrive at a relative spectral radiance response. The curves for theWorldView-3 visible and near infrared multispectral bands are shown in Figure 1. The curves for the WorldView-3 SWIR bands are shown in Figure 2. The corresponding data are provided in Attachement A.
Figure 1: WorldView-3 Relative Spectral Radiance Response (nm) for the VNIR bands.
Figure 2: WorldView-3 Relative Spectral Radiance Response (nm) for the SWIR bands.
1.2 WorldView-3 Effective Bandwidth
The effective bandwidth for each band of the WorldView-3 system is defined as:
∞
Δλ=∫R′(λ)dλ
where ?λ is the effective bandwidth in μm for a given band, and R'(λ) is the relative spectral radiance response for a given band. The effective bandwidths should be used in the conversion to top-of-atmosphere spectral radiance for each band
and are listed in Table 1. For reference, the center wavelength for each band is also given. The effective bandwidths are also included in the image metadata (.IMD file extension) accompanying the image product.
2 Relative Radiometric Correction of WorldView-
3 Products
Relative radiometric calibration and correction are necessary because a uniform scene does not create a uniform image in terms of raw digital numbers (DNs). Major causes of non-uniformity include variability in detector response, variability in electronic gain and offset, lens falloff, and particulate contamination on the focal plane. These causes manifest themselves in the form of streaks and banding in imagery. In the case of a pushbroom system focal plane containing linear arrays, the data from every pixel in a given image column comes from the same detector. Any differences in gain or offset for a single detector show up as a vertical streak in raw imagery. Differences in gain and offset for a single readout register show up as vertical bands as wide as the number of detectors read out by the register. Relative radiometric correction minimizes these image artifacts in WorldView-3 products.
A relative radiometric correction is performed on raw data from all detectors in all bands during the early stages of WorldView-3 product generation. This correction includes a dark offset subtraction and a non-uniformity correction (e.g. detector-to-detector relative gain).
It is important to note that, after radiometric correction, the corrected detector data are spatially resampled to create a specific WorldView-3 product that has relative radiometrically corrected image pixels. Once spatial resampling is performed, the radiometric corrections are not reversible. Data from all WorldView-3 detectors are relative radiometrically corrected and used to generate WorldView-3 products. To date, no detectors have been declared as non-responsive detectors. The WorldView-3 VNIR instrument collects data with 11 bits of dynamic range. These 11 bits are either stored as 16 bit integers or are scaled down to 8 bits to reduce the file sizes of WorldView-3 products and for use with specific COTS tools that can
only handle 8-bit data. The same is done for the 14 bit SWIR data. Whether the final bit depth is 16 or 8 bits, the goal of the relative radiometric correction, other than minimize image artifacts, is to scale all image pixels to top-of-atmosphere spectral radiance so that one absolute calibration factor can be applied to all pixels in a given band.
3 Absolute Radiometric Correction of WorldView-3 Products and Conversion to Top-of-Atmosphere Spectral Radiance
WorldView-3 products are delivered to the customer as relative radiometrically corrected image pixels. Their values are a function of how much spectral radiance enters the telescope aperture and the instrument conversion of that radiation into a digital signal. That signal depends on the spectral transmission of the telescope and filters, the throughput of the telescope, the spectral quantum efficiency of the detectors, and the analog to digital conversion. Therefore, image pixel data are unique to WorldView-3 and should not be directly compared to imagery from other sensors in a radiometric/spectral sense. In addition, bands taken at different TDI levels may give misleading spectral information if left in digital number space. Image pixels should be converted to top-of-atmosphere spectral radiance at a minimum.
A pre-flight calibration has been performed and these data are provided in the .IMD metadata file that is delivered with the imagery. Since launch, DigitalGlobe has performed an extensive vicarious calibration campaign to provide an adjustment to the pre-launch values. The top-of-atmosphere radiance, L, in units of Wμm-1 m-2 sr-1, is then found from the DigitalGlobe image product for each band by converting from digital numbers (DN) using the equation,
The TDI and scan direction specific abscalfactor and effectiveBandwidth are delivered with the imagery in the metadata file. The digital number, DN, is the pixel value found in the imagery. The Gain and Offset are the absolute radiometric calibration band dependent adjustment factors that are given in Table 2. Note that these are not necessarily static values and they are revisited annually.
Table 2. Absolute radiometric Calibration Adjustment Factors for WorldView-3 as of 1/29/2016. It is recommended that these values are used for more accurate at sensor radiance values. Updates will be made available to the public online alongside this technical paper or by request.
The absolute radiometric calibration factor and effective bandwidth values for each band are delivered with every WorldView-3 product and are located in the image metadata files (extension .IMD). An excerpt from a product .IMD file shows the absolute radiometric calibration factor (absCalFactor) and the effective bandwidth (effectiveBandwidth), for example:
BEGIN_GROUP = BAND_C
…
absCalFactor = 9.295654e-03;
effectiveBandwidth = 4.730000e-02;
END_GROUP = BAND_C
This example is for the coastal band. There are sections for each band, in particular: BAND_C = Coastal; BAND_B = Blue; BAND_G = Green; BAND_Y = Yellow; BAND_R = Red; BAND_RE = Red Edge; BAND_N = NIR1; BAND_N2= NIR2. Note that the values are provided in scientific notation.
The absolute radiometric calibration factor is dependent on the specific band, as well as the TDI exposure level, line rate, pixel aggregration, and bit depth of the product. Based on these parameters, the appropriate value is provided in the .IMD file. For this reason, care should be taken not to mix absolute radiometric calibration factors between products that might have different collection conditions.
4 Conversion to Top-of-Atmosphere Reflectance
For many multispectral analysis techniques such as band ratios, Normalized Difference Vegetation Index (NDVI), matrix transformations, etc., it is common practice to convert multispectral data into reflectance before performing the analysis. In addition, techniques for removal of atmospheric effects range from a simple dark object subtraction or empirical line method, to more robust radiative transfer approaches. These methods require that first the imagery be normalized for solar irradiance and sensor radiance by conversion to top of atmosphere reflectance, ρ(TOA)λ.
ρ(TOA )λ=L λd 2π
E λcos θS
where L λ is the at-sensor radiance for the spectral band λ in W/m 2/μm/sr found in the previous section above, d is the Earth-Sun distance in astronomical units, E λ is the band-averaged solar exoatmopsheric irradiance in W/m 2/μm, and θS is the solar zenith angle.
Top-of-atmosphere reflectance does not account for topographic, atmospheric, or BRDF differences. Consult the references by Schott or Schowengerdt for further discussion on correction for topographic or atmospheric effects. Typically a dark object subtraction technique is recommended at a minimum to reduce atmospheric effects due to the upwelling path radiance (Richards, p. 46, 1999 or Schowengerdt, p. 315, 1997) followed by atmospheric modeling.
4.1 Solar Exoatmospheric Irradiance
The WorldView-3 instrument is sensitive to wavelengths of light in the visible through shortwave-infrared portions of the electromagnetic spectrum as shown in Figure 1 and Figure 2. In this region, top-of-atmosphere radiance measured by WorldView-3 is dominated by reflected solar radiation. Spectral irradiance is defined as the energy per unit area falling on a surface as a function of wavelength. Because the Sun acts like a blackbody radiator, the solar spectral irradiance can be approximated using a Planck blackbody curve at 5900 degrees Kelvin, corrected for the solar disk area and the distance between the Earth and the Sun (Schowengerdt, pp. 36-37, 1997). However, a model of the solar spectral irradiance is better used for this purpose. The solar spectral irradiance curve peaks around 450 nm in the coastal and blue bands and slowly decreases at longer wavelengths. The WRC Solar Spectral Irradiance Curve is shown in Figure 3 as an example. Thuillier 2003 is used for the vicarious calibration work at DigitalGlobe and is our recommended curve. The ChKur and WRC band averaged values are also given as they are also widely used and accepted in the remote sensing community. NOTE: the curves are given for an Earth-Sun distance of 1 Astronomical Unit (AU) normal to the surface being illuminated.
In general, band-averaged solar spectral irradiance is defined as the weighted average of the peak normalized effective irradiance value over the detector bandpass as shown in the following equation:
where Esun λBand is the band-averaged solar spectral irradiance [W-m -2-μm -1] for a given band, Esun(λ) is the solar spectral irradiance curve [W-m -2-μm -1] (WRC shown in Figure 3), and R '(λ)Band is the relative spectral radiance response for a given band.
??∞
∞
?'?'?=
Band
Band
Band d )
(R d )
(R )Esun(Esun λ
λλ
λλλ
Figure 3: WRC Solar Spectral Irradiance Curve
Specific to WorldView-3, the band-averaged solar spectral irradiance values for an Earth-Sun distance of 1 AU, normal to the surface being illuminated, are listed in Table 3.
Table 3: WorldView-3 Band-Averaged Solar Spectral Irradiance
4.1.2 Earth-Sun Distance
In order to calculate the Earth-Sun distance for a given product, the customer must first use the image acquisition time to calculate the Julian Day. The acquisition time for a product is contained in the image metadata file (.IMD file extension). Acquisition time uses the UTC time format and in the relevant section of the .IMD files looks like:
Basic Product:
BEGIN_GROUP = IMAGE_1 … firstLineTime = YYYY_MM_DDThh:mm:ss:ddddddZ; …
END_GROUP = IMAGE_1
Standard (projected) Product:
BEGIN_GROUP = MAP_PROJECTED_PRODUCT …
earliestAcqTime = YYYY_MM_DDThh:mm:ss:ddddddZ; …
END_GROUP = MAP_PROJECTED_PRODUCT
From the UTC time format, retrieve the year, month, day and calculate the Universal Time (UT) from the hours, minutes, and seconds:
3600.0
ss.dddddd
60.0mm hh UT DD day MM month YYYY year ++
====
If the customer has an algorithm that can calculate the Julian Day, that value can also be used. Otherwise use the equations listed below (Meeus, p. 61, 1998). The word “int” listed in the equations means to truncate the decimals and only use the integer part of the number. If the image was acquired in January or February, the year and month must be modified as follows:
12month month 1year year +=-=
Next, calculate the Julian Day (JD):
[][]1524.5B 24.0
UT
day )1month (30.6001int )4716year (365.25int JD 4A int A 2B 100year int A -++
++?++?=?
?
?
??+-=?
?? ??=
As an example, the WorldView-2 launch date of October 8, 2009 at 18:51:00 GMT corresponds to the Julian Day 2455113.285. Once the Julian Day has been calculated, the Earth-Sun distance (d ES ) can be determined using the following equations (U.S. Naval Observatory):
)
cos(2g 0.00014cos(g)0.016711.00014d D
0.98560028357.529g 2451545.0
JD D ES ?-?-=?+=-=
NOTE: g is in degrees but most software programs require radians for cosine calculations. Conversion may be necessary for g from degrees to radians. The Earth-Sun distance will be in Astronomical Units (AU) and should have a value between 0.983 and 1.017. For the WorldView-2 launch date, the Earth-Sun distance is 0.998987 AU. At least six decimal places should be carried in the Earth-Sun distance for use in radiometric balancing or top-of-atmosphere reflectance calculations.
4.1.2 Solar Zenith Angle
The solar zenith angle does not need to be calculated for every pixel in an image because the sun angle change is very small over the 13.4 km image swath and the along-track image acquisition time. The average solar zenith angle for the image is sufficient for every pixel in the image. The average sun elevation angle [degrees] for a given product is calculated for the center of the scene and can be found in the .IMD files:
BEGIN_GROUP = IMAGE_1 …
meanSunEl = 68.7; …
END_GROUP = IMAGE_1
The solar zenith angle is simply:
sunEl S -=0.90θ
This example is for a sun elevation angle of 68.7 degrees, which corresponds to a solar zenith angle of 21.3 degrees.
5 Radiometric Balancing for Multiple Scene Mosaics
For many customers, it may be desirable to create large area mosaics from multiple WorldView-3 scenes. Ignoring geometric effects, adjacent areas might appear to have different brightness values leaving a visible seam between scenes. As stated earlier, WorldView-3 pixel digital numbers are a function of the spectral radiance entering the telescope aperture at the WorldView-3 altitude of 617 km. This top-of-atmosphere spectral radiance varies with Earth-Sun distance, solar zenith angle, topography (the solar zenith angle is calculated for flat terrain so topography adds an extra geometry factor for each spot on the ground), bi-directional reflectance distribution function (BRDF-the target reflectance varies depending on the illumination and observation geometry), and atmospheric effects (absorption and scattering).
Topography, BRDF, and atmospheric effects can be ignored for simple radiometric balancing. Consequently, the major difference between two scenes of the same area is the solar geometry. The solar spectral irradiance values listed in Table 4 correspond to the values for the mean Earth-Sun distance, normal to the surface being illuminated. The actual solar spectral irradiance for a given image varies depending on the Earth-Sun distance and the solar zenith angle during the individual image acquisition. This variation will cause two scenes of the same area (or adjacent areas) taken on different days to have different radiances and hence different image brightnesses. The difference can be minimized by correcting imagery for Earth-Sun distance and solar zenith angle or simply converting to top-of-atmosphere solar reflectance as described in this technical document.
6 Summary
Raw WorldView-3 imagery undergoes a relative radiometric correction process to reduce visible banding and streaking in WorldView-3 products. The products are linearly scaled to absolute spectral radiance. Various types of spectral analysis can be performed on this radiometrically corrected WorldView-3 imagery. Depending on the application, WorldView-3 products may need to be converted to top-of-atmosphere spectral radiance or spectral reflectance. These transformations are performed using the equations listed in this technical note. In the case of large area mosaics, Top-of-atmosphere reflectance is
recommended as a starting point. Additional radiometric balancing may help match the brightness of the scenes used in the mosaic. For customers interested in comparing WorldView-3 products with imagery from other sensors, keep in mind the spectral response curves and gain settings which are specific to WorldView-3. Many of the differences in analysis results can be explained by the differences in the sensors themselves.
7 References
Meuss, Jean. "Astronomical algorithms, 2nd Ed.." Richmond, VA: Willmann-Bell(1998).
Richards, John A. and Xiuping Jia. “Remote Sensing Digital Image Analysis: An Introduction 3rd ed.,” Springer, Berlin, 1999.
Schott, John R. “Remote Sensing: The Image Chain Approach,” Oxf ord University Press, New York(1997). Schowengerdt, Robert A. “Remote Sensing: Models and Methods for Image Processing 2nd e d.,” Academic Press, San Diego(1997).
Thuillier, G., et al. "The solar spectral irradiance from 200 to 2400 nm as measured by the SOLSPEC spectrometer from the ATLAS and EURECA missions." Solar Physics 214.1 (2003): 1-22.
Wehrli, C. “Extraterrestrial Solar Spectrum,” Publication 615, Physikalisch-Metrologisches Observatorium Davos and World Radiation Center, Davos-Dorf, Switzerland, pp. 23(1985).
实验二 遥感图像的辐射定标
实验二遥感图像的辐射定标 1.实验目的与意义: (1)了解辐射定标原理 (2)使用ENVI软件自带的定标工具定标 (3)学习波段运算进行辐射定标 2.为什么要进行辐射定标,定标的原理是什么? 目的:消除传感器本身的误差,确定传感器入口处的准确辐射值。 原理:辐射定标是将传感器记录的电压或数字量化值(DN)转换为绝对辐射亮度值(辐射率)的过程,或者转换为与地表(表观)反射率、表面温度等物理量有关的相对值的处理过程。 3.辐射定标过程 一般有两种方式: 第一种:利用计算公式,在ENVI中利用band math计算福亮度和反射率。 第二种:利用ENVI自带的定标工具进行定标,获取福亮度或反射率。 第一种方法:用波段运算得到Radiance和Reflectance (1)表观辅亮度radiance的计算 radiance=((lmax-lmin)/(qcalmax-qcalmin)*(qcal-qcalmin)+lmin 其中:radiance –表观辐亮度 qcal-----DN(也就是影像数据本身); lmax 和lmin是从参数表中查询; qcalmax 是DN值的最大值,对于TM是8bit来说,qcalmax=255; Qcalmin 是DN值的最小值,一般为0 即 (2)表观反射率的计算 ρ=π*L*d2/(ESUN*cos(θ)) 其中ρ为表观反射率; L为上一步计算出来的表观辐亮度; d为日地距离,这个数据通过下面的表格中获取; ESUN为大气层外的太阳辐射,也可以说是传感器接收处的太阳辐射; θ为太阳天顶角。(这个可以通过影像的元数据获取)在本次实验的数据中radiance=(193+1.52)/255*b1-1.52 Reflectance=3.14*(b1)*1.0128^2/(1957*0.7381)步骤如下:打开文件L5120036_03620100819_MTL.txt ,点击Band Math,输入(193+1.52)/255*b1-1.52,之后即可计算出辐射度,文件保存为radiance1。
绝对辐射定标系数
国产陆地观测卫星2013年外场绝对辐射定标系数 1、 资源三号(ZY-3)卫星绝对辐射定标系数见表2 表2 ZY-3卫星在轨绝对辐射定标系数 卫星载荷 波段 光谱范围(μm ) Gain 资源三号 多光谱相机 Band-1 0.45 ~ 0.52 0.2551 Band-2 0.52 ~ 0.59 0.2353 Band-3 0.63 ~ 0.69 0.1944 Band-4 0.77 ~ 0.89 0.2107 注:利用绝对定标系数将ZY-3卫星CCD 图像DN 值转换为辐亮度图像的公式为: ()e e L Gain DN Bias λ=?+ 式中:式中()e e L λ为转换后辐亮度,单位为211W m sr m μ---???,DN 为卫星载荷观测值;Gain 为定标斜率,单位为211W m sr m μ---???,Bias 为定标截距,单位为211W m sr m μ---???。
2、 资源一号02C (ZY-1 02C )卫星绝对辐射定标系数见表3 表3 ZY-1 02C 星CCD 相机的定标系数 卫星载荷 波段号 Gain Bias ZY-1-02C-PMS Band1(P) 0.6208 -13.826 Band2 0.7397 -22.246 Band3 0.6904 -15.438 Band4 0.6369 -14.201 注:利用绝对定标系数将ZY-1 02C 卫星CCD 图像DN 值转换为辐亮度图像的公式为: ()e e L Gain DN Bias λ=?+ 式中:式中()e e L λ为转换后辐亮度,单位为211W m sr m μ---???,DN 为卫星载荷观测值;Gain 为定标斜率,单位为211W m sr m μ---???,Bias 为定标截距,单位为211W m sr m μ---???。
Landsat系列辐射定标参数整理
辐射定标参数整理 1.亮度温度计算 亮度温度是一个常用的温度概念,是在卫星高度上传感器探测波段范围内普朗克黑体辐射函数与传感器响应函数乘积积分得到的辐射值.亮度温度包含有大气和地表对热辐射传导的影响,不是真正意义上的地表温度。 计算公式: 其中,Lλ为传感器探孔处光谱辐射强度,即星上辐射亮度值,实现像素DN值转化为绝对辐射亮度值。 1.1.星上辐射亮度(Lλ) 遥感影像的亮度值(DN值)都是经过量化和纠正过的以8bit编码的数字影像,为了精确反演地物特性,有必要将DN值转化为星上辐射亮度值。 https://www.360docs.net/doc/1c12350551.html,ndsat8 Lλ= M L*Q cal + A L 通过查看影像的头文件,可以获取偏差参数:M L(RADIANCE_MULT_BAND_x)和A L(RADIANCE_ADD_BAND_x)为图像的增益和偏置。 1.1. https://www.360docs.net/doc/1c12350551.html,ndsat5/7
QCAL为经过辐射校正的图像灰度值即DN值;L max为探测器可检测到的最大辐射亮度,也是最大灰度值所相应的辐射亮;L min为探测器可检测到的最小辐射亮度,也是最小灰度值所相应的辐射亮度。 表 1 Landsat5 TM的Lmin和Lmax值 表 2 Landsat7 ETM+的Lmin和Lmax值 QCAL max为传感器接收到的最大灰度值,QCAL min为传感器接收到的最小灰度值。(1)如
果没有元数据信息,QCAL MIN默认值1(TM和ETM+1)或者0(MSS);QCAL MAX取默认值255(TM 和ETM+)或者127(MSS)。(2)如果有元数据信息,QCAL MIN取值如下:对于LPGS Products(The level 1 product generation system)取值为1,对于NLAPS Products(National Landsat Archive Production System)在04 April 2004之前取值为0,在04 April 2004之后取值为1;QCAL MAX 取值为127(MSS), 255(TM、ETM)。 注:LPGS和NLAPS分别是两种数据处理系统得到的产品,从2008年12月份开始,L7 ETM+ 和L5都是以LPGS系统处理,L4 TM和MSS以NLAPS系统处理。 表 3 Landsat5/7的QCALmin和QCALmax的值 1.2.预设常量K K1和K2是发射前预设的常量,具体值如下表所示。 2.大气顶层反射率(表观发射率) https://www.360docs.net/doc/1c12350551.html,ndsat 5/7(TM/ETM) ρ= π?Lλ?d2 ESUN?cosθ 其中:ρ——地面相对反射率;D——日地天文单位距离;Lλ——传感器光谱辐射值,即大气顶层的辐射能量;ESUN——大气顶层的太阳平均光谱辐射,即大气顶层太阳辐照度;1注:Landsat7热红外波段(Band 6)在格式1时总设置为低增益(6L),格式2时总设置为高增益(6H)
最新版ENVI5.3下高分二号(GF2)数据预处理
ENVI5.3下高分二号(GF2)数据预处理 以一景2015年1月23日获取的GF2-PMS1数据为例介绍在ENVI5.3下GF2数据预处理的详细操作步骤。GF2数据预处理基本流程如下: 图:GF2数据预处理流程 说明:1. 针对不同的应用,有不同的处理流程,上图中列出了两种常用的预处理流程。流程一主要针对高精度的定量遥感应用,也就是对大气校正精度要求
比较高应用,比如:植被参数定量反演等;流程二主要针对定性遥感或者对大气校正精度要求比较低的遥感应用,比如:土地利用类型分类等。本文介绍的主要是流程二的详细操作步骤,流程一的实现可参考日志:ENVI5.2下高分二号数据FLAASH大气校正;另外,中国资源卫星应用中心网站已经公布了最新的GF2数据绝对辐射定标系数和两个传感器的波谱响应函数,大家可以下载使用。2. 本例中所有操作都是在ENVI5.3版本下进行的,除NNDiffuse Pan Sharpening 图像融合(ENVI5.2新增,ENVI5.1中可以使用G-S融合方法)外,其他操作在ENVI5.1/5.2下同样可以完成。 1. 数据打开 启动ENVI5.3,在菜单栏中,选择File > Open,弹出Open对话框,找到GF2数据文件夹所在位置,选中扩展名为.tiff的两个文件,点击打开。 图2 打开GF2多光谱和全色数据
在左侧图层管理Layer Manager面板中,选择多光谱或全色数据图层,右键View Metadata查看其元数据信息,可以看到ENVI很好地识别了数据的RPC 信息。 图3 ENVI自动识别GF2数据RPC信息 2. 正射校正 有了RPC信息之后,下面我们就可以基于这些RPC信息分别对多光谱和全色数据进行正射校正。这里我们以多光谱数据正射校正为例,全色数据正射校正操作完全相同。
HKN婴儿辐射保暖台操作流程及维护保养
操作流程及维护保养 类别医学装备科一设备操作流程及保养编号YXZB HKN-9010婴儿辐射保暖台操作流程及 生效日期2017-01-01 名称 维护保养 制定单位医学装备科责任人晁岱明修订日期2017-07-01 定期更新每一年总页码2版本第1版制定目的 完善科室设备使用流程,规范设备操作,确保设备运行的可靠、安全,降低故障率,延长设备使用寿命。 二适用范围 使用科室 三操作流程 1、检查线缆有无破损,有机玻璃挡板是否安装牢固、有无裂缝和锐边,辐射箱顶部是 否有杂物,脚轮是否锁定,婴儿床是否处在水平位置,若均正常,连接皮肤温度传感器; 1、连接电源线,打开总开关电源,操作校验程序; 待预热模式改变,轻轻放入患者,根据患者情况设置参数、模式和报警值。一般情况 下使用肤温模式,休克或发热时禁止使用肤温模式,使用肤温模式需将皮肤温度传感 器探头正确连接患者皮肤表面并用医用胶带固定: (1)患者仰卧:探头放置在患者腹部剑状软骨和肚脐之间,注意避免肝脏部位; (2)患者趴卧:探头放置在患者背部,最好是在肾脏部位; (3)患者侧卧:遵照主治医师的指导;
2、设备工作时,操作人员必须时刻关注患者状况,定时为患者补充水分,并每半小时
监控和记录患者体温; 3、X光拍片:用手转动辐射箱,将辐射箱移开婴儿床上方,插入X光拍片板; 4、关机:关闭控制仪电源开关、照明开关和总电源开关,拔下电源连接线,断开皮肤 温度传感器与患者的连接; 5、使用后对设备进行清洁消毒并铺好一次性使用无菌单。 四、维护保养 1、一级维护保养 1)每天早晨进行一次校验操作,若校验任何一项出现故障,尽快联系医学装备科(3698727 处理; 2)未使用时电源总开关必须关闭; 3)设备附近不得放置任何射频通信设备,禁止在有机玻璃挡板上放置电线; 4)清洁及消毒:断开电源连接,等待加热器冷却,拔下皮肤温度传感器,拆下有机玻璃挡板,用蘸有酸水的软抹布擦拭设备和有机玻璃挡板,再用蘸有清水的软抹布将酸水擦拭干净,晾干后铺好一次性使用无菌单。 2、二级维护保养 1)每周检查有机玻璃挡板是否安装牢固、有无裂缝和锐边,检查脚轮是否松动和进行校验操作; 2)每3个月检查一次内置电池性能; 3)每半年校准一次皮肤温度传感器; 4)每年对电源插头端子之间的区域进行清洁和,检查一次设备符号标记是否清晰,电气性能是否符合设备要求; 5)每两年更换一次皮肤温度传感器;
环境减灾星座AB星各载荷在轨绝对辐射定标系数
环境减灾星座A/B 星各载荷在轨绝对辐射定标系数 1、HJ1A/B 星各载荷在轨绝对辐射定标系数见表1和表2。 表1 HJ1A/B 星CCD 与IRS 绝对辐射定标系数 定标系数 卫星 传感器 增益 参数 Band1 Band2 Band3 Band4 a (DN/W ?m ?2 ?sr ?1?μm ?1)0.57630.54100.6824 0.7209 1 L 0 (W ?m ?2 ?sr ?1?μm ?1) 9.31839.17587.5072 4.1484 a (DN/W ?m ?2 ?sr ?1?μm ?1)0.9160 0.9228 1.1277 1.0753 CCD1 2 L 0 (W ?m ?2 ?sr ?1?μm ?1) 7.3250 6.0737 3.6123 1.9028 a (DN/W ?m ?2 ?sr ?1?μm ?1)0.63600.59100.8142 0.8768 1 L 0 (W ?m ?2 ?sr ?1?μm ?1) 7.55757.0944 4.1319 1.2232 a (DN/W ?m ?2 ?sr ?1?μm ?1)0.9997 1.0016 1.3777 1.3043 HJ1A CCD2 2 L 0 (W ?m ?2 ?sr ?1?μm ?1) 4.6344 4.0982 3.7360 0.7385 a (DN/W ?m ?2 ?sr ?1?μm ?1)0.53290.528950.68495 0.72245 1 L 0 (W ?m ?2 ?sr ?1?μm ?1) 1.6146 4.0052 6.2193 2.8302 a (DN/W ?m ?2 ?sr ?1?μm ?1)0.86850.9367 1.2433 1.3002 CCD1 2 L 0 (W ?m ?2 ?sr ?1?μm ?1) 3.0089 4.4487 3.2144 2.5609 a (DN/W ?m ?2 ?sr ?1?μm ?1) 0.57820.50870.6825 0.6468 1 L 0 (W ?m ?2 ?sr ?1?μm ?1) 3.4608 5.8769 8.0069 8.8583 a (DN/W ?m ?2 ?sr ?1?μm ?1)0.9076 0.8502 1.1635 0.9800 CCD2 2 L 0 (W ?m ?2 ?sr ?1?μm ?1) 2.2219 4.0683 5.2537 6.3497 g (DN/W ?m ?2 ?sr ?1?μm ?1) 4.285718.557912.662 61.472 HJ1B IRS 1 b (DN) - - 11.489 -44.598 表2 HJ1A 星HSI 绝对辐射定标系数(DN/W ?m ?2?sr ?1?μm ?1) HJ1AHSI 绝对定标系数 波长 定标系数 波长 定标系数 波长 定标系数 460.04 0.2927 561.88 1.5462 721.61 5.8620 462.14 0.3050 565.00 1.5896 726.77 5.1258 464.25 0.3447 568.16 1.6073 732.01 5.5057 466.38 0.3786 571.36 1.6783 737.33 4.3242
作业标准1:辐射定标及波段运算
一总述 1 遥感图像处理的目的 遥感的目的是为了获得地物的几何属性和物理属性.但是由于受到大气,目标,传感器等诸多因素的影响,原始的遥感影像中除了有目标地物的信息以外还包含有大气,传感器的运行状态等信息,如果我们只是利用原始的遥感影像,将不能提取出所感兴趣的有效信息, 所以为了实现遥感的最终目的,提取所需的信息,我们必须对遥感影像进行处理. 2 ENVI简介 目前已经开发了一些进行遥感图像处理的软件,例如ENVI,PCI,ERDAS等.现在就简单介绍一下ENVI. ENVI是由美国RSI公司开发的一套功能齐全的遥感图像处理系统,是处理、分析并显示多光谱数据、高光谱数据和雷达数据的高级工具。其完全是由IDL开发,方便灵活,可扩展性强,并可用IDL进行二次开发。现在最高版是4.7版本的. 我们来大概熟悉一下 ENVI的主菜单: 可以看出ENVI的主菜单中主要有以下一些工具: 基本工具,分类,空间变换,滤波,波谱工具,制图工具,矢量工具,地形分析,雷达工具 来看一下主菜单中的FILE菜单, 通过选择Open Image File可以打开ENVI 图像文件或其它已知格式的二进制图像文件。ENVI 自动地识别和读取下列类型的文件:TIFF、GeoTIFF、GIF、JPEG、BMP、SRF、HDF、PDS、MAS-50、NLAPS、RADARSAT 和A VHRR 。数据仍保留它原有格式,必要的信息从数据头文件中读取。ENVI也直接读取其它几种文件类型(参见“O pen External File”)。 注意: 若你得到“File does not appear to be a valid Radarsat file” 这样一个错误消息,使用File > Open External File 来选择正确的数据类型。 当ENVI 第一次打开一个文件,它需要关于文件特征的特定信息。通常,这些信息存储在与图像文件同名的一个独立的文本头文件,但是文件扩展名为.hdr 。若文件打开时没有找到ENVI头文件,你必须在Header Information 对话框中输入一些基本的参数. 另外一些数据格式没有.hdr 文件也能自动打开。这些格式包括:TIFF、GeoTIFF、GIF、JPEG、BMP、SRF、HDF、PDS、MAS-50、NLAPS、RADARSAT 和A VHRR 。(ENVI 头文件中含有丰富的信息,例如: ENVI description = { Create New File Result [Tue Oct 19 15:47:45 2004]} samples = 2000 lines = 2000 (图像的大小) bands = 7 header offset = 0 file type = ENVI Standard
辐射定标
辐射定标(像元亮度值,辐射亮度/亮温)、表观反射率、地表反射率、反照率、比辐射率(转) (2012-11-28 13:58:29) 转载▼ 分类:科研 标签: 杂谈 (2012-01-26 01:18:44) 标签: 校园分类:工作篇
定标系数为:增益53.473,单位:DN/(W?m-2?sr-1?μm-1);截距26.965,单位:DN。利用绝对定标系数将DN值图像转换为辐亮度图像的公式为L=(DN-b)/coe,式中coe为绝对定标系数的增益,b为截距,转换后辐亮度单位为 W?m-2?sr-1?μm-1。HJ1B红外相机中红外波段则条带较为严重,不利于定量化应用。 遥感数字图像 遥感数字图像是以数字形式记录的二维遥感信息,即其内容是通过遥感手段获得的,通常是地物不同波段的电磁波谱信息。其中的像素值称为亮度值(或称为灰度值、DN值)。 遥感概念DN值(Digital Number )是遥感影像像元亮度值,记录的地物的灰度值。无单位,是一个整数值,值大小与传感器的辐射分辨率、地物发射率、大气透过率和散射率等有关。 遥感图像量化image quantification。释文:按一定的函数关系将图像所代表的物理量分割成有限的离散等级,以使观测数据可用一定字长的二进制码表示,因此又称为数据编码。量化后的级别称为图像的像元值、灰度或亮度,记为 DN(digital number)。 DN值没有单位,数量级与像素深度有关,如果是无符号整型的就是0-255,符点型,无符号16位均根据其类型确定。 在遥感领域,定标一般分为几何定标和辐射定标两种。 几何定标即指对遥感图像几何特性进行校正,以还原为真实情况。 辐射定标指对遥感图像的辐射度进行校准,以实现定量遥感。 辐射定标一般也可称为校准,其主要目的是保证传感器获取遥感数据的准确性。通常,采用系统自身内部监视环路和外部标准目标方法对系统链路中的各个环节进行误差修正,来实现辐射定标过程。 一般在主动式遥感系统中,辐射定标可以作得很好,可以认为在一定误差范围内实现了定量遥感。而被动式遥感系统相对困难些。 几何定标相对简单,就不多说了。 辐射定标是对传感器引起的误差校正,将影像校正为星上反射率 辐射定标和辐射校正——遥感数据定量化的最基本环节 由于遥感图像成像过程的复杂性,传感器接收到的电磁波能量与目标本身辐射的能量是不一致的。传感器输出的能量包含了由于太阳位置、大气条件、地形影响和传感器本身的性能等所引起的各种失真,这些失真不是地面目标的辐射,因此对图像的使用和理解造成影响,必须加以校正和消除,而校正和消除的基本方法就是辐射定标和辐射校正。
星上比辐射定标器及性能评估方法研究
星上比辐射定标器及性能评估方法研究 高精度的星上定标是实现遥感数据定量化的重要途径之一。以太阳照明反射特性已知的聚四氟乙烯漫射板作为光源,采用比值辐射计进行漫反射板响应率衰减的监测和修正,实现对遥感器全光路、全视场、全口径的高精度绝对辐射定标,是当前可见短波红外波段星上定标技术的主要发展趋势。 星上比辐射定标器性能评估准确与否直接影响其在轨应用性能。在此背景下,本论文开展了星上比辐射定标器及其性能评估方法研究。 论文介绍了星上比辐射定标器工作原理,详细阐述了各关键环节设计方案。根据定标器原理和物理模型,分析得出星上定标不确定度主要来源为漫射板BRDF实时量值的不确定度,其关键在于比值辐射计对漫射板在轨衰减的修正精度。 对星上比辐射定标器性能参数测试需求进行了分析,识别出太阳观测几何因子波段比、辐射比、动态范围和信噪比等比值辐射计的关键表征参数。建立了定标器测试方案和流程,并在实验室内完成了比值辐射计、漫反射板以及星上比辐射定标器整机级的性能参数测试。 以卤钨灯作为测试光源,获取了比值辐射计太阳观测几何因子波段比查找表,不确定度优于0.18%;通过灯-板模拟系统完成了辐射比验证,预估在轨辐射比测量不确定度优于0.4%;使用已标定的大口径、多能级积分球光源对比值辐射计的动态范围、信噪比和稳定性进行了测试。结合漫射板和定标器整机测试结果,比值辐射计对漫反射板稳定性监视不确定度优于1.3%,漫射板BRDF实时量值不确定度优于1.76%,星上比辐射定标器的绝对辐射定标总不确定度优于3%。 本论文系统性地对星上比辐射定标器性能评估方法进行了研究,提出了定标
器测试方法以及测试流程,通过对星上比辐射定标器部件级以及整机级参数的测试,获取了定标器各项定标参数,完成星上定标不确定度的评估,验证了星上定标器设计以及性能评估方法的合理性,可以为定标器在轨应用以及定标精度预评估提供有效数据支撑。
ENVI-专题五 Landsat TM辐射定标与大气纠正
专题五Landsat TM辐射定标与大气纠正 图像处理流程分为以下几个步骤:图像的配准、重采样、定标以及大气纠正。其中,图像配准是做所有工作的前提,是图像的几何纠正。在进行定性或者定量遥感时都要进行图像配准来确定我们所要研究的目标。在进行完图像配准(几何纠正)之后,为了使得输出图像的配置与输入图像向对应,因此要进行重采样。定标以及大气纠正则是进行辐射量纠正的重要的过程,是进行定量遥感不可少的步骤。分类是图像处理的最后一步,按某种使用意图分类之后的图像,对实际应用有很大帮助。 辐射定标和大气纠正都属于图像的预处理,辐射定标的目的是把图像上的DN值转为辐亮度或者是反射率,大气纠正的目的是消除或减少大气对图像的干扰。 以下是图像预处理的流程: 一、辐射定标 要对图象进行辐射定标,将图象的DN值转化为表观反射率,该过程的实现是通过应用以下两个步骤来实现的: (1)首先将图象的DN值转化为辐亮度:radiance=gain*DN+offset (1)式(2)然后将图象的辐亮度转化为表观反射率: (reflectance) ρ=π*L*d2/(ESUN*cos(θ))(2)式其中ρ为表观反射率,L为表观辐亮度,d为日地距离,ESUN为太阳平均辐射强度,θ为太阳天顶角。 (3)将以上两个步骤结合得: ρ=π*(gain*DN+offset)* d2/(ESUN*cos(θ))(3)式 ①日地天文单位距离D: D=1 - 0.01674 cos(0.9856× (JD-4)×π/180);JD为遥感成像的儒略日(Julian Day) D = 1 + 0.0167 * Sin(2 * PI * (days - 93.5) / 365);days是拍摄卫片的日期在那一年的 天数,如2004年5月21号,则days=31+29+31+30+21=142。 计算得:D=1.01250756 ENVI中的具体实现(以Landsat 7 ETM+为例):采用简单的波段运算 例如,我们把2002-5-22的一幅ETM图像第3波段的DN值转化为表观反射率。 第一步,查找.FST文件(是该图像经过粗纠正后的数据信息说明文件),该图像第3波
婴儿辐射保暖台的操作规程
婴儿辐射保暖台的操作规程 一、适应症 适用于新生儿急救、治疗、护理及保暖。 二、操作流程 1、锁紧整机脚轮,防止机器工作时移动,接通电源。 2、将肤温传感器插入肤温传感器插座,将肤温传感器探头置于婴儿皮肤之上,金属面向 下,与婴儿皮肤紧贴并用胶布固定,探头往往放置于胸部、腹部等感热面积大且平整易固定又方便护理的部位为宜。 3、打开控制仪电源开关,控制仪自动进入预热模式,使保暖台预热,待床垫表面温度达 到适当温度后,再将患者放入或给患儿脱衣服。保暖台在预热模式下运行约30分钟必须改为“肤温模式”以维持患儿的体温。 4、想改变温度控制模式时,按一下“设置键”,再按“模式键”进行温度控制模式(预 热、手控、肤温)的选择,选定后再按一次“设置键”,即完成温度控制模式的设置。 5、使用肤温模式时,系统默认的设置温度值是36℃,若要改变设置值时,在设置状态下 (设置温度窗的数值闪烁),通过按加键或减键对温度值进行调整。 6、如需要打开床四围的挡板,可用手抓住挡板上缘向上提并向外翻下。 7、每次使用结束后,先切断电源,再用84消毒液擦试、清洁挡板及机器表面,更换床 单备用。 三、注意事项及保养 1、仪器必须接地,放置在环境干燥、无风的地方使用。 2、测温探头放在控制的区域内,不得用厚被子遮盖。 在手控模式时,皮肤温度显示窗将显示温度传感器所测得的实时温度,加热输出 比例是固定的,不受温度传感器所测得的皮肤温度控制,因此要密切注意患儿体 温的波动,而且操作人员不得离开,以保证患儿的安全。 3、为了确保患儿安全,一般情况下,推荐使用肤温模式。肤温模式下,必须使皮肤 温度传感器的探头与患者的适当部位保持可靠地接触,如果探头从患者身上脱离, 此时传感器所测的温度并非预期患者的皮肤温度,而可能是空气温度或床垫表面 温度,从而导致患者过度地接收热量或急剧地失热,甚至于被烫伤或死亡。 4、仪器不正常时,不得强行使用,需专业人员修理。 5、长时间使用,应考虑婴儿脱水问题,需加适量的水用以蒸发或婴儿床上摆上聚乙 烯薄膜。 6、在手控模式下及档板翻下时,使用者不得离开,以免对患儿造成危害。 7、每次使用后,及时清洁仪器及婴儿床、床垫。为避免有机玻璃挡板出现银丝裂纹, 不能使用酒精或其它有机溶液进行清洁,也不能让其处于紫外线的直接辐照之下。 三、温度控制模式的选择 (一)预热模式适用于患儿不在辐射台上,需要迅速提高床温。 预热模式是系统按预定的程序输出热量,运行约20分钟后,系统按70%(加热功率指示灯7格显示)的加热比例输出热量,约30分钟后按30%的加热比例输出热量直到模式改变,所以此模式不适宜保持患儿体温。 预热时,不受肤温传感器所测得的肤温控制,设置温度窗显示“--.-”,皮肤温度显示窗显示肤温传感器所测得的实时温度。 (二)手控模式 手控模式是保暖台按设定的加热比例固定输出热量的模式,该模式预期用于对患者作短
开放辐射抢救台使用操作规范
开放辐射抢救台使用操作规范 一、操作目的 1、保持患儿体温稳定,便于保暖。 2、便于抢救危重患儿。 二、评估要点 1、评估患儿的身体状况,(体位、体重、胎龄、面色、精神反应、皮肤状况及病情)。 2、告知家属使用辐射台的必要性。 三、物品准备 辐射台、床单、体温表、湿纸巾、手足保护套、酌情备纸尿 裤。四、操作要点 1、核对医嘱,准备用物。 2、检查辐射台的完整性。 3、将辐射台置于避风温暖处,检查床栏,调节床头高度。 4、接通电源,打开控制仪开关,检查控制仪各功能显示是否正常,使之预热温度至36℃。 5、洗手,戴口罩。 6、携用物至床旁,核对患儿床号、姓名、住院号,评估患儿。 7、铺床单,将患儿置于辐射台上,取仰卧位,头偏向一侧,保持呼吸道通畅。 8、将肤控传感器探头金属面紧贴患儿右上腹部,用胶布十字固
定好探头,以免探头脱落,必要时用75%乙醇清洗患儿右上腹部的皮肤。 9、调节设定体温,肤温设置在36-36.5℃。 10、为患儿测量体温、呼吸、观察患儿面色、精神反应及皮肤情况。戴手足保护套,酌情清洁皮肤,更换纸尿裤。 11、使用过程中根据体温情况调节所设置的肤控温度。 12、再次核对。 13、整理用物,洗手,取口罩。 14、记录患儿入辐射台的一般情况。 五、注意事项 1、新生儿病房室温调节在24-26℃,病房室温过低会导致升温过慢。 2、开放式辐射台无湿度调节系统,病房需进行湿式清洁或用湿化器保持室内湿度55%-65%。 3、避免将辐射台放置通风处。 4、注意加强液体补充,防止脱水。 5、每四小时测体温一次,体温保持在36.5-37.5℃。 6、加强巡视,防止探头脱落,探头金属面每天用75%乙醇擦拭,保持其灵敏度。 7、使用过程中每天用湿毛巾擦拭辐射台四周、床档。 8、停止使用时先关控制仪开关,再关电源开关,最后拔电源插头,用含氯消毒液擦拭后用清水擦拭进行终末处理。
高精度卫星光学遥感器辐射定标技术_郑小兵
收稿日期:2011-04-24 基金项目:国家863计划(2008AA121203)资助。 高精度卫星光学遥感器辐射定标技术 郑小兵1,2 (1中国科学院通用光学定标和表征技术重点实验室,合肥230031) (2中国科学院安徽光学精密机械研究所光学遥感中心,合肥230031) 摘要随着长期气候变化等观测新需求和高分辨对地观测等新手段的发展,空间光学仪器面临进一步提高辐射定标精度的要求。文章从空间光学仪器定标精度的制约因素和全过程定标的实现等方面,分析了国际相关领域的技术进展,并就新型定标技术的研究和应用提出建议与展望。 关键词辐射定标光学遥感卫星 中图分类号:V443+.5 文献标识码:A 文章编号:1009-8518(2011)05-0036-08High-Accuracy Radiometric Calibration of Satellite Optical Remote Sensors Zheng Xiaobing (1Key Laboratory of Optical Calibration and Characterization,Chinese Academy of Sciences ,Hefei 230031,China ) (2Anhui Institute of Optics and Fine Mechanics,Chinese Academy of Sciences ,Hefei 230031,China ) Abstract Climate change monitoring and high resolution earth observation demand higher accuracy of abso -lute calibration for space optical sensors.This paper briefly discusses the progress and constrained factors of cur -rent radiometric calibration techniques.New calibration approaches and instrumentations such as hyperspectral and spectrally tunable reference light sources,and global calibration site network are introduced,and their ap -plications are suggested. Key words Radiometric calibration Optical remote sensing Satellite 1引言 光学辐射定标主要研究光辐射传感器的输出与已知的、用SI 单位表述的输入光辐射之间的定量关系,包括各种光辐射效应的定量化、光辐射的精确测量及其不确定度评估,光辐射传感器的综合特性表征,以及光辐射传感器的工作条件对其性能影响的评估等方面的内容。 光辐射是光学遥感信息的基本载体。各种平台上光学传感器的几何和光谱分辩能力都与其光辐射的准确测量能力直接相关。辐射定标在空间对地观测观测过程中所发挥的主要作用表现为: 1)实现各类光学传感器从预研-工程研制-在轨运行的全过程定标,保证传感器的精度能够满足应用需求; 2)统一不同平台、不同传感器的辐射量化标准,使不同时间、空间条件下获得的遥感信息可以比对、转换和融合; 3)通过动态监测,校正传感器的性能衰变,修正大气、照明条件、环境变化等对测量结果的影响,保证测第32卷第5期 2011年10月 航天返回与遥感SPACECRAFT RECOVERY &REMOTE SENSING 36
ENVI--专题五辐射定标与大气纠正
专题五辐射定标与大气纠正 图像处理流程分为以下几个步骤:图像的配准、重采样、定标以及大气纠正。其中,图像配准是做所有工作的前提,是图像的几何纠正。在进行定性或者定量遥感时都要进行图像配准来确定我们所要研究的目标。在进行完图像配准(几何纠正)之后,为了使得输出图像的配置与输入图像向对应,因此要进行重采样。定标以及大气纠正则是进行辐射量纠正的重要的过程,是进行定量遥感不可少的步骤。分类是图像处理的最后一步,按某种使用意图分类之后的图像,对实际应用有很大帮助。 辐射定标和大气纠正都属于图像的预处理,辐射定标的目的是把图像上的DN值转为辐亮度或者是反射率,大气纠正的目的是消除或减少大气对图像的干扰。 以下是图像预处理的流程: 一、辐射定标 要对图象进行辐射定标,将图象的DN值转化为表观反射率,该过程的实现是通过应用以下两个步骤来实现的: (1)首先将图象的DN值转化为辐亮度:radiance=gain*DN+offset (1)式(2)然后将图象的辐亮度转化为表观反射率:ρ=π*L*d2/(ESUN*cos(θ))(2)式其中ρ为表观反射率,L为表观辐亮度,d为日地距离,ESUN为太阳平均辐射强度,θ为太阳天顶角。 (3)将以上两个步骤结合得:ρ=π*(gain*DN+offset)* d2/(ESUN*cos(θ))(3)式ENVI中的具体实现:采用简单的波段运算 例如,我们把2002-5-22的一幅ETM图像第3波段的DN值转化为表观反射率。 第一步,查找.FST文件(是该图像经过粗纠正后的数据信息说明文件),该图像第3波段的gain和offset,可知: gain=0.619215662339154,offset=-5.0000000000000 第二步,查找.FST文件可知S =90-62.7=27.3度,cos(θ)=0.8886;查找Table 11.4 (Earth-Sun Distance in Astronomical Units)可知d=1.10109天文单位;查找Table 11.3 (ETM+ Solar Spectral Irradiances)可知ESUN=1551。 第三步,把这些参数的值带入(1)式:L3=0.619*b3-5.0 代入(3)式:ρ3=3.1415* (0.619*b3-5.0)*1.10109^2/(1551*0.4602)
新生儿抢救复苏台-新生儿仪器使用操
新生儿抢救复苏台标准操作规程 Ⅰ、目的:建立新生儿抢救复苏台标准操作规程 Ⅱ、范围:适用于新生儿抢救复苏台操作 Ⅲ、规程 1.使用前准备 1.1固定好输液架,调节好升降杆并固定紧,调节床体倾斜手柄,使床体平衡并稳固。 1.2检查婴儿床四周的有机玻璃护板是否安装牢固,以防婴儿滑落。 1.3按下脚轮制动装置,固定锁紧。 1.4接通电源,接要求铺好婴儿床。 2、使用与操作 2.1打开复苏xxxx侧面的电源开关。 2.2确定加热方式(自动或手动)。 a、若选择自动方式,传石器扦入肤温传感器扦座内,把“选择”键按到“自动”状态,此时自动指示灯亮。 b、若选择手动方式则把“选择”按键到“手动”状态,此时手动指示灯亮。 2.3设定温度,手动方式下无须给定设定值,在自动方式下,肤温设定范围36℃-38℃,若原来温度为37℃,预设定为36.7℃,操作步骤如下: a.按“设定”键,个位数“7”闪动; b.按递减健“↓”一次,则“7”转化为“6” c.按移位健“→”小数后“0”在闪动 d.按递增健“↑”七次,则“0”转化为“7”
2.4复苏台在使用过程中把肤温传感器置于婴儿腹部或根据医嘱置于最外层包被上面。 3、清洗与消毒 3.1拆卸 a.拆卸前须切断电源,拔掉电源插头. b.取出婴儿床上的床垫. C.拔下传感器,并保存好. d.拔出婴儿床四周的有机玻璃护板 3.2用清水手巾拧干,轻轻擦拭热辐射头和上立柱及婴儿床周围和外表面部分,切忌用汽油、酒精、香蕉水等液体擦拭。 3.3婴儿床垫应保持干燥、清白、不得有任何污迹,否则应换新,使用前应经过消毒。 3.4婴儿床四周有机玻璃护板应干净、透明、用医用消毒剂清洗其表面,然后用干净布擦干。 3.5传感器清洗,应用医用消毒剂清洗表面,然后用干净布擦干。 4、维护与保养 4.1保持设备清洁干净,外面完好,附件齐全,在热辐射头和婴儿床的床垫上不得放置任何杂物或盛有液体的容器。 4.2调备正常工作时应保持周围整洁、宽敞、有序。 4.3定期做好维护、保养工作,并记录。 4.4若复苏台长期不用时必须取出电池,套好防尘罩。 4.5复苏台久置未用或新患儿放入之前,应彻底检查各功能。更换干净床垫,开消毒灭菌。
2014年国产遥感卫星外场绝对辐射定标系数1、高分一号(GF-1)卫星
2014年国产遥感卫星外场绝对辐射定标系数 1、 高分一号(GF-1)卫星绝对辐射定标系数 表1 GF-1卫星各载荷的绝对辐射定标系数 注:利用绝对定标系数将GF-1卫星CCD 图像DN 值转换为辐亮度图像的公式为: ()e e L Gain DN λ=? 式中:式中()e e L λ为转换后辐亮度,单位为211W m sr m μ---???,DN 为卫星载荷观测值;Gain 为定标斜率,单位为211W m sr m μ---???。
2、 环境减灾-AB (HJ-1A/B )卫星绝对辐射定标系数 表2 HJ-1A/B 星CCD 相机(增益2)的定标系数 注:利用绝对定标系数将HJ-1A/B 卫星CCD 图像DN 值转换为辐亮度图像的公式为: ()e e L Gain DN Offset λ=?+ 式中:式中()e e L λ为转换后辐亮度,单位为211W m sr m μ---???,DN 为卫星载荷观测值;Gain 为定标斜率,单位为211W m sr m μ---???,Offset 为绝对定标系数偏移量,单位为211W m sr m μ---???。
3、 资源三号(ZY-3)卫星绝对辐射定标系数 表3 ZY-3卫星在轨绝对辐射定标系数 注:利用绝对定标系数将ZY-3卫星CCD 图像DN 值转换为辐亮度图像的公式为: ()e e L Gain DN λ=? 式中:式中()e e L λ为转换后辐亮度,单位为211W m sr m μ---???,DN 为卫星载荷观测值;Gain 为定标斜率,单位为211W m sr m μ---???。
辐射定标
辐射定标 辐射定标定义:建立遥感传感器的数字量化输出值DN与其所对应视场中辐射亮度值之间的定量关系。 分为三类: 1.实验室定标:在遥感器发射之前对其进行的波长位置、辐射精度、空间定位等的定标,将仪器的输出值转换为辐射值。有的仪器内有内定定标系统。但是在仪器运行之后,还需要定期定标,以监测仪器性能的变化,相应调整定标参数。 1光谱定标,其目的是确定遥感传感器每个波段的中心波长和带宽,以及光谱响应函数 2辐射定标 绝对定标:通过各种标准辐射源,在不同波谱段建立成像光谱仪入瞳处的光谱辐射亮度值与成像光谱仪输出的数字量化值之间的定量关系相对定标:确定场景中各像元之间、各探测器之间、各波谱之间以及不同时间测得的辐射量的相对值。 2.机上和星上定标 机上定标用来经常性的检查飞行中的遥感器定标情况,一般采用内定标的方法,即辐射定标源、定标光学系统都在飞行器上,在大气层外,太阳的辐照度可以认为是一个常数,因此也可以选择太阳作为基准光源,通过太阳定标系统对星载成像光谱仪器进行绝对定标。 3.场地定标(是最难的一个) 场地定标指的是遥感器处于正常运行条件下,选择辐射定标场地,通过地面同步测量对遥感器的定标,场地定标可以实现全孔径、全视场、全动态范围的定标,并考虑到了大气传输和环境的影响。该定标方法可以实现对遥感器运行状态下与获取地面图像完全相同条件的绝对校正,可以提供遥感器整个寿命期间的定标,对遥感器进行真实性检验和对一些模型进行正确性检验。但是地面目标应是典型的均匀稳定目标,地面定标还必须同时测量和计算遥感器过顶时的大气环境参量和地物反射率。 原理:在遥感器飞越辐射定标场地上空时,在定标场地选择偌干个像元区,测量成像光谱仪对应的地物的各波段光谱反射率和大气光谱等参量,并利用大气辐射传输模型等手段给出成像光谱仪入瞳处各光谱带的辐射亮度,最后确定它与成像光谱仪对应输出的数字量化值的数量关系,求解定标系数,并估算定标不确定性。 基本技术流程:获取空中、地面及大气环境数据,计算大气气溶胶光学厚度,计算大气中水和臭氧含量,分析和处理定标场地及训练区地物光谱等数据,获取定标场地数据时的几何参量和时间,将获取和计算的各种参数带入大气辐射传输模型,求取遥感器入瞳时的辐射亮度,计算定标系数,进行误差分析,讨论误差原因。 方法:
遥感图像辐射定标
遥感图像辐射定标 时间:2010-02-19 17:10来源:未知作者:admin 我们常用影像的像元值大多是经过量化的、无量纲的DN值,而进行遥感定量化分析时,常用到辐射亮度值、反射率值、温度值等物理量。传感器定标就是要获得这些物理量的过程。传感器定标很多地方又名为辐射定标,严格意义上讲,辐射定标是传感器定标的一部分内容 我们常用影像的像元值大多是经过量化的、无量纲的DN值,而进行遥感定量化分析时,常用到辐射亮度值、反射率值、温度值等物理量。传感器定标就是要获得这些物理量的过程。 传感器定标很多地方又名为辐射定标,严格意义上讲,辐射定标是传感器定标的一部分内容。以下是国内的定义,如赵英时等《遥感应用分析原理与方法》上描述:定标是将遥感器所得的测量值变换为绝对亮度或变换为与地表反射率、表面温度等物理量有关的相对值的处理过程。或者说,遥感器定标就是建立遥感器每个探测器输出值与该探测器对应的实际地物辐射亮度之间的定量关系;建立遥感传感器的数字量化输出值DN与其所对应视场中辐射亮度值之间的定量关系(陈述彭)。辐射亮度的典型的单位为:W/cm2.μm.sr(瓦特/平方厘米.微米.球面度)我们总结以上的定义,通俗的说法:传感器定标就是将图像的数字量化值(DN)转化为辐射亮度值或者反射率或者表面温度等物理量的处理过程。其中反射率又分为大气外层表观反射率和地表实际反射率,后者又属于大气校正的范畴,有的时候也会将大气校正纳入传感器定标的一种途径。 传感器定标可分为绝对定标和相对定标。绝对定标是获取图像上目标物的绝对辐射值等物理量;相对定标是将图像目标物辐射量归一化某个值范围内,比如以其他数据作为基准。 传感器定标可分为三个阶段或者说三个方面内容:①发射前的实验室定标;②基于星载定标器的星上定标;③发射后的定标(场地定标)。 ENVI支持很多数据的定标,包括ASTER、MODIS、AVHRR, MSS, TM ,QuickBird, WorldView-1,TIMS等。也可以根据定标参数利用BandMath工具很方便的完成定标。