THROUGHPUT CALCULATIONS FOR MULTIHOP PACKET RADIO NETWORKS
THROUGHPUT CALCULATIONS FOR MULTIHOP PACKET RADIO NETWORKS
Richard A.McClain
Lockheed Martin Advanced Technology Laboratory
1Federal Street(AE-3W)
Camden,NJ08102
ABSTRACT
The main result of this paper is an ef?cient algorithm for
evaluating throughput in a multihop packet radio network
(PRN).The algorithm is needed for a Differentiated Services
Quality of Service(QoS)framework for managing the allo-
cation and policing of throughput in a PRN.But the known
algorithm for conducting analyzing throughput in a PRN is
not scalable because it requires computation on the order
of an exponential of the size of the array,and it requires
complete knowledge of the network topology.This paper
proposes and evaluates an approximation to the original al-
gorithm which scales linearly with network size and requires
only local network topology.
INTRODUCTION
The Differentiated Services architecture for network QoS is
being developed within an IETF(Internet Engineering Task
Force)working group[1].The key idea of the architecture
is to minimize the processing and storage at the core routers
which make up most of the network,by carefully control-
ling traf?c as it enters the network.Nodes at entry points
perform classi?cation,policing,and shaping to force com-
pliance to agreed?ow https://www.360docs.net/doc/f68750379.html,pliant traf?c is marked
by setting bits in the IP header.Core routers inspect these
bits when scheduling packets for forwarding.Various ser-
vices can be built up using these principles.For example,a
high priority,low delay service can be implemented by ar-
ranging for high priority traf?c to receive preferred service
compared to the rest of the traf?c which is handled as best-
effort.Making sure that the priority traf?c actually receives
low delay through the network requires a throughput model
of the network,so that the service can make rational alloca-
tion decisions,a process known as provisioning.
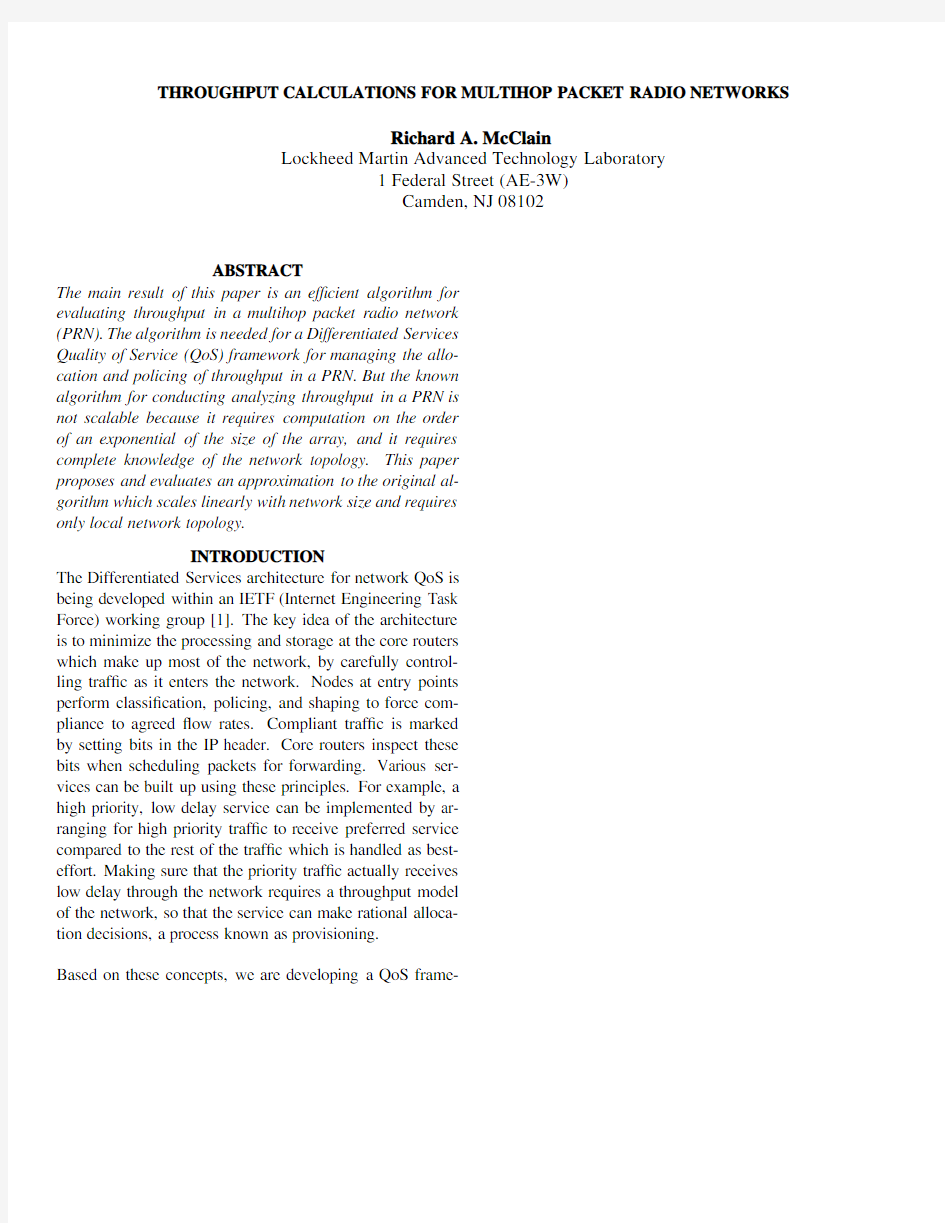
Based on these concepts,we are developing a QoS frame-
Figure1:QoS Framework
LINK DESCRIPTION
Consider a multihop PRN of mobile stations during an in-terval of time when the topology of the network is?xed. Stations contain a transmitter and receiver and can send and receive packets to/from other stations within range.A uni-directional communication path will be called a channel. Channels will be labeled by the combination of transmitting and receiving stations.
Stations are adjacent to those neighbor stations with which communications can occur in both directions.Bidirectional communications are a de?ned requirement for adjacency, since acknowledgements will normally be needed for reli-able communications.Also,to avoid hidden terminal inter-ference,we assume that stations employ a Request to Send (RTS)/Clear to Send(CTS)protocol and that stations which hear a CTS response will remain off the air during the inter-val when another station has been granted the clearance to send.This is the approach taken by the IEEE802.11stan-dard to avoid problems with“hidden terminals.”Let Adj be the set of stations adjacent to station.Adjacency rela-tionships are symmetric:Adj when Adj. Each(unordered)pair of adjacent stations forms a radio link. Link connects stations and bearing packets trans-mitted from or to the other.Let be the effective capacity of the link in bits per second(bps),assuming that no other station contends
for the link.The angle bracket notation will be used to indicate a bidirectional link, consisting of channels and.
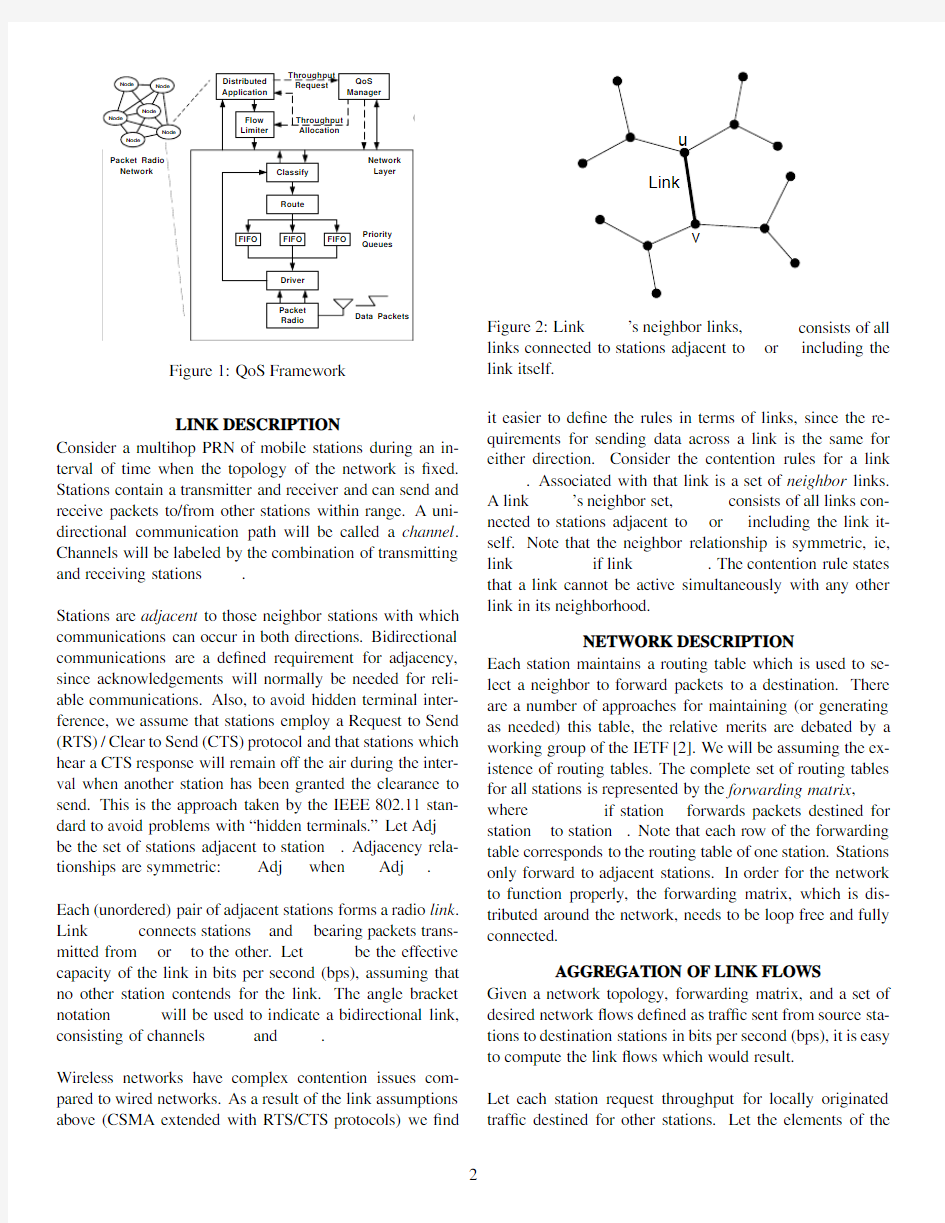
Wireless networks have complex contention issues com-pared to wired networks.As a result of the link assumptions above(CSMA extended with RTS/CTS protocols)we?nd Figure2:Link’s neighbor links,consists of all links connected to stations adjacent to or including the link itself.
it easier to de?ne the rules in terms of links,since the re-quirements for sending data across a link is the same for either direction.Consider the contention rules for a link .Associated with that link is a set of neighbor links.
A link’s neighbor set,consists of all links con-nected to stations adjacent to or including the link it-self.Note that the neighbor relationship is symmetric,ie, link if link.The contention rule states that a link cannot be active simultaneously with any other link in its neighborhood.
NETWORK DESCRIPTION
Each station maintains a routing table which is used to se-lect a neighbor to forward packets to a destination.There are a number of approaches for maintaining(or generating as needed)this table,the relative merits are debated by a working group of the IETF[2].We will be assuming the ex-istence of routing tables.The complete set of routing tables for all stations is represented by the forwarding matrix, where if station forwards packets destined for station to station.Note that each row of the forwarding table corresponds to the routing table of one station.Stations only forward to adjacent stations.In order for the network to function properly,the forwarding matrix,which is dis-tributed around the network,needs to be loop free and fully connected.
AGGREGATION OF LINK FLOWS
Given a network topology,forwarding matrix,and a set of desired network?ows de?ned as traf?c sent from source sta-tions to destination stations in bits per second(bps),it is easy to compute the link?ows which would result.
Let each station request throughput for locally originated traf?c destined for other stations.Let the elements of the
network?ow request matrix,be the request for through-put from station to station.De?ne a channel distribution vector,.Element of is the quantity of traf?c on channel destined for station and can be computed as follows:
Adj
otherwise The elements of the channel?ow request matrix,can be computed by adding the elements of the channel distribution vector at each channel:
We can compute the elements of the raw link?ow request matrix,by simply adding the channel?ows associated with each direction of the link(in bps):
The normalized link?ow requests are obtained by dividing the link?ow request matrix elements by the maximum ca-pacity of the links,(also in bps):
The normalized link?ow requests can range from0(no traf-?c)to greater than1(a fully saturated link).Henceforth,the normalized link?ow requests will be referred to as just link ?ow requests.
THROUGHPUT ANALYSIS Implementing a Differentiated Services approach to QoS, requires a method for estimating available capacity of links in the PRN to carry additional traf?c.This is not an easy task,since each link contends for airtime with other links. Fortunately,an approach to modeling this complex situa-tion was developed by Boorstyn,Kershenbaum,et.al.in a series of papers from1980-87.The primary references used here are[4]and[5].They model CSMA packet radio networks as a Markovian system.The states of the Marko-vian system correspond to the combinations of active nodes in the network which can be transmitting simultaneously. The state probabilities are proportional to products of the active node sending rates and can be used to evaluate net-work throughput.But the evaluation requires calculations that are NP-hard,and although they found innovative meth-ods for speeding up the analysis,the run-times for moderate sized40node networks was measured in minutes.Also, their analysis required that all information,ie,the network topology and?ows,be gathered at a central location.
The contribution here is to implement their analytical pro-cedure ef?ciently enough for online QoS management.To adapt their analysis,a number of modi?cations are needed. First,we use the link-to-link contention rules given earlier, instead of the station-to-station contention rules used in the papers cited.Then we develop an approximation to their result,which allows the estimation of a links capacity us-ing only topology and?ows in the local vicinity of the link. This will also replace their NP-hard,exponentially complex, global,exact computation,with an approximate,scalable, distributed computation of complexity linear in the number of links.We will use their exact calculation to evaluate how well our approximation works.
The network is modeled as a continuous time Markov chain. Stations on both ends of a link attempt to initiate transmis-sions.The combined scheduling point process for link
is Poisson with rate packets/sec1.If the link is avail-able at the scheduling point,which occurs when is idle, then a packet is sent over the link whose size is exponen-tially distributed with mean length sec/packet.For convenience,we de?ne the attempted sending rate: The attempted sending rate is the fraction of the link capac-ity that would be consumed if the scheduling process always found the link available2.We must assume that all random samples are redrawn from their distributions,independent of past history.
The achieved throughput on the link,will be given by:
Prob is idle(1) The attempted sending rate satis?es whereas the achieved throughput will satisfy.
At any point in time,the network will be in a particular dis-crete Markov state,identi?ed by the combination of links which are active at that time.The states will be identi?ed by the set of active links.With links,there will be pos-sible states.Because we assume that the network protocol avoids collisions,the only states that the network reaches are the legal states which have an independent set of active links,ie,for all we have.
To evaluate the probabilities in(1),we?rst need to un-derstand the equilibrium behavior of the network by de-termining the equilibrium state probabilities,for le-gal states.Note that if the system is in state and state
is also legal,then it enters state at rate .It enters (the necessarily legal)state at rate .That observation is all that is needed to write the bal-ance equations for the steady state probability ?ow out of and into state :
These equations are satis?ed by 3:
(2)
To ?nd the probability of the null state,we use the
requirement that all state probabilities sum to 1.The sum
runs over all
which is to say for all that are independent subsets of the set of all links.(Independence was de?ned above.)
SP
Finally,from (1),we ?nd the throughput on a link is:
SP
2and
the achieved throughput on the link that depends on the at-tempted sending rates on all links (the ’s)and the topology of the network.To show that a set of throughputs is fea-sible,we must solve for the ’s which result in the desired throughputs.
To solve (5)for
’s,given a set of desired throughputs,’s,the iteration described in [5]works well.Let be the vector of attempted sending rates,.And
de?ne functions
SP SP so that (5)becomes:.We can solve for ’s by the following iteration:
If the throughputs are not feasible,then at least one of the
which is equal to the probability that the link’s neigh-bors are idle,will approach 0,so we can just terminate the
iteration if any
drops below a threshold (.001was used).Unfortunately,the evaluation of
for all re-quires the enumeration of all the legal combinations of ac-tive senders and is exponential in the number of network links.Although the papers cited above describe signi?cant progress towards optimizing the calculation,the algorithm will still not scale to networks of arbitrary size.Before we describe our approach to avoiding this problem,we ?rst de-scribe in the next section how (5)can be used to estimate the available throughput on a link.
A V AILABLE LINK THROUGHPUT
To make QoS allocation decisions,we need to estimate how much additional throughput can be sent across links in the network.As pointed out in [6],one indicator of the available link throughput is the additional fraction of time that a link could be transmitting,which we denote as .From (1),
we can express
in terms of variables from the throughput analysis:
Prob
is idle
We suggest controlling high priority allocations to maintain a minimum probability,min of each link being idle (ac-tually,just idle with respect to the transmission of priority traf?c).Now we see that all of a links time is divided be-tween being active,represented by the achieved throughput,being busy due to a neighbor link being active,denoted
as and,being idle,represented by By de?nition, The behavior of these three variables is critical to the analy-sis.What we expect is that increases in will largely be compensated with corresponding decreases in.Neigh-boring links will maintain their throughput,and the size of will be relatively inelastic to increases in a links throughput.Increasing an should cause the network to spend more time in states where more links are active simul-taneously,increasing the ef?ciency of the whole network. So generally,will decrease slightly with increasing Therefore,if we assume that does not change with in-creasing we will be taking a conservative outlook. So,agreeing to maintain a minimum idle probability,min for all links,and assuming a constant usage by neighbors, allows us to estimate the extra available throughput on a link,as:
min
ALLOCATION OF THROUGHPUT
The general plan is to assign allocations,by scaling re-quests,to keep the idle probability,above the min-imum value.(Choose,such that achieves min).The scale factor is set to unity as long as requests do not reduce the idle probability below the min-imum.The scale factor actually assigned to a link will be the minimum of all scale factors in its neighborhood.These link scale factors will then be used to develop a network scale matrix,which factors?ows depending on their source and destination.These factors determine the allocations de-livered to applications.
IMPLEMENTATION OF SUM OF PRODUCTS
CALCULATION
A major concern is the evaluation of the sum of products ex-pression(4).Our implementation of(4)is apparently sim-pler than that described in[5],although it is based on their key observation:
SP SP SP
SP
where is any member of and is the null set.This recursion allows the evaluation of each sum of products in terms of a pair of simpler sum of products.For a given num-ber of sets for which we wish to evaluate SP ie,those in(5),this recursion will expand into a much larger num-ber of SP’s,with many repeats.By creating a hash ta-ble of SP’s,indexed by their argument bitset,we create an acyclic directed graph of SP’s.In[5],they were con-cerned about choosing a proper order in which to evaluate the SP’s.We observe that since each SP depends on SP’s which have fewer bits set,we can simply order the evaluation of SP’s by the number of bits which are set to guarantee a valid order.
LOCAL APPROXIMATION
Our local approximation to the full algorithm is exceedingly simple:we compute the throughput for each link with a separate calculation of the exact same algorithm,but restricted to a subgraph of the overall link graph which in-cludes only the second neighborhood of the link.To state it precisely,to evaluate throughput on each link we con-struct a graph consisting only of links for which either (includes)or and. We have to perform the local calculation separately for each link in the network.Hence,we are replacing one large cal-culation with many smaller ones.Since we expect the com-pute time of the local calculation to be essentially constant, independent of the overall network size,we will have an al-gorithm which is linear in the size of the array and which requires only knowledge of network topology in the vicinity of a link to estimate throughput on the link.
We expect that this simpli?cation might provide reasonable estimates.Obviously,the major in?uence on the throughput of a link is its immediate neighbors which directly contend with it.The in?uence of the second neighbors on a link’s throughput are via pressure on the link’s direct neighbors to more often transmit simultaneously when they are not them-selves neighbors.The in?uence of links three edges away has much less impact.
EV ALUATION OF APPROXIMATE ALGORITHM To evaluate the approximate algorithm an experiment was conducted using randomly generated networks and traf?c models.For each test network,station locations were ran-domly placed within a square area,and nodes within a de-?ned range were designated as adjacent.The range was cal-ibrated so that stations would on average have5neighbors. Links were added if necessary to create a fully connected network.The representation of the network was an undi-rected graph with a vertex for each station and an edge for each link.Routing tables were generated using a shortest path algorithm(Floyd-Warshall[7]).The link topology was represented with a second graph,with a vertex for each link and an edge connecting each pair of adjacent links.A net-work?ow request matrix was created by randomly selecting source-destination pairs so that each station was on average originating2?ows.Both versions(original and approxi-mate)of the throughput algorithm would be run on the net-work/traf?c model and results compared.
0.2
0.4
0.6
0.8
1
-0.050
0.050.1
Absolute Error
Error Density Error Distribution
Figure 3:Absolute error in estimate of load using approxi-mate algorithm compared to the original algorithm.We conducted the comparison on 195networks (5samples for each size ranging from 10to 48stations).We measured the absolute differences in the calculated throughputs.The distribution of absolute error in throughput for all links is shown in Figure 3.The approximation tends to overestimate the original algorithm slightly,but over 95%of the time the error is less than 5%of the link bandwidth.We believe this is accurate enough for allocating throughput within our QoS framework,where some margin for error will have to be in-cluded in any case.The average runtime of these runs is shown in Figure 4.The original algorithm exhibits an ex-ponential runtime curve,and the approximate algorithm ex-hibits a linear runtime curve,as expected.Since in the QoS framework this calculation will be distributed among the QoS Managers at each node,it only requires a constant cal-culation for each node ,independent of network size,clearly a scalable algorithm.
CONCLUSION 4
A QoS framework was described and motivated the main technical body of the paper.The framework is based on providing QoS assurances to applications by aggregating re-quests and examining the overall load on the network to de-termine how much throughput can actually be allocated to individual applications.
A key enabler of the framework is the ability to estimate how much load a set of QoS throughput requests represents.For packet radio networks,we found an established prior
性能测试培训——基础知识
性能测试培训(一) ——基础知识 1.软件性能测试的概念 1.1软件性能与性能测试 软件性能:覆盖面广泛,对一个系统而言,包括执行效率、资源占用、稳定性、安全性、兼容性、可扩展性、可靠性等。 性能测试:为保证系统运行后的性能能够满足用户需求,而开展的一系列的测试组织工作。 1.2不同角色对软件性能的认识 用户眼中的软件性能: ?软件对用户操作的响应时间 如用户提交一个查询操作或打开一个web页面的链接等。 ?业务可用度,或者系统的服务水平如何 管理员眼中的软件性能:
开发人员眼中的软件性能: 1.3性能测试的对象 服务器端: ?负载均衡系统; ?服务器(单机、双机热备、集群); ?存储系统、灾备中心; ?数据库、中间件。 网络端: ?核心交换设备、路由设备; ?广域网络、专线网络、局域网络、拨号网络等; 应用系统: 由此可见,性能测试是一个系统性的工作,被测对象包括系统运行时使用的所有软硬件。但在实际操作时,将根据项目的特点,选择特定的被测对象。 1.4性能测试的目标 评价系统当前的性能:
?系统刚上线使用,即处于试运行时,用户需要确定当前系 统是否满足验收要求; ?系统已经运行一段时间,如何保证一直具有良好的性能。分析系统瓶颈、优化系统: ?用户提出业务操作响应时间长,如何定位问题,调整性能; ?系统运行一段时间后,速度变慢,如何寻找瓶颈,进而优 化性能。 预见系统未来性能、容量可扩充性: ?系统用户数增加或业务量增加时,当前系统是否能够满足 需求,如果不能,需要进行哪些调整?提高硬件配置?增 加应用服务器?提高数据库服务器的配置?或者是需要对 代码进行调整? 1.5性能测试的分类 按照测试压力级别: ?负载测试; ?压力测试; 按照测试实施目标: ?应用在客户端的测试; ?应用在网络的测试; ?应用在服务器端的测试; 按照测试实施策略:
性能测试报告-模板
Xxx系统性能测试报告 拟制:****日期:****审核:日期: 批准:日期:
1.概述 1.1.编写目的 本次测试报告为xxx系统的性能测试总结报告,目的在于总结性能测试工作,并分析测试结果,描述系统是否符合xxx系统的性能需求。 预期参考人员包括用户、测试人员、开发人员、项目管理者、质量管理人员和需要阅读本报告的高层经理。 1.2.项目背景 腾讯公司为员工提供一个网上查询班车的入口,分析出哪些路线/站点比较紧张或宽松,以进行一些合理调配。 1.3.测试目标 (简要列出进行本次压力测试的主要目标)完善班车管理系统,满足腾讯内部员工的班车查询需求,满足500个用户并发访问本系统。 1.4.名词解释 测试时间:一轮测试从开始到结束所使用的时间 并发线程数:测试时同时访问被测系统的线程数。注意,由于测试过程中,每个线程都是以尽可能快的速度发请求,与实际用户的使用有极大差别,所以,此数据不等同于实际使用时的并发用户数。 每次时间间隔:测试线程发出一个请求,并得到被测系统的响应后,间隔多少时间发出下一次请求。 平均响应时间:测试线程向被测系统发请求,所有请求的响应时间的平均值。 处理能力:在某一特定环境下,系统处理请求的速度。 cache影响系数:测试数据未必如实际使用时分散,cache在测试过程中会比实际使用时发挥更大作用,从而使测试出的最高处理能力偏高,考虑到这个因素而引入的系数。 用户习惯操作频率:根据用户使用习惯估算出来的,单个用户在一段时间内,使用此类功能的次数。通常以一天内某段固定的高峰使用时间来统计,如果一天内没有哪段时间是固定的高峰使用时间,则以一天的工作时间来统计。
详解网站性能测试指标
网站的性能测试指标包括了Web应用服务器、数据库服务器及系统服务器等各种性能测试。每一项测试中都需要根据项目要求完成测试,本文重点讲述了网站性能测试指标,并加以案例分析。 通用指标(指Web应用服务器、数据库服务器必需测试项) Web服务器指标 数据库服务器性能指标 系统的瓶颈定义
稳定系统的资源状态 通俗理解: ·日访问量 ·常用页面最大并发数 ·同时在线人数 ·访问相应时间 案例: 最近公司一个项目,是个门户网站,需要做性能测试,根据项目特点定出了主要测试项和测试方案: 一种是测试几个常用页面能接受的最大并发数(用户名参数化,设置集合点策略) 一种是测试服务器长时间压力下,用户能否正常操作(用户名参数化,迭代运行脚本) 一种则需要测试服务器能否接受10万用户同时在线操作,如果是用IIS做应用服务器的话,单台可承受的最大并发数不可能达到10万级,那就必须要使用集群,
通过多台机器做负载均衡来实现;如果是用websphere之类的应用服务器的话,单 台可承受的最大并发数可以达到10万级,但为性能考虑还是必须要使用集群,通 过多台机器做负载均衡来实现;通常有1个简单的计算方式,1个连接产生1个session,每个session在服务器上有个内存空间大小的设置,在NT上是3M,那么10万并发就需要300G内存,当然实际使用中考虑其他程序也占用内存,所以准备 的内存数量要求比这个还要多一些。还有10万个用户同时在线,跟10万个并发数是完全不同的2个概念。这个楼上已经说了。但如何做这个转换将10万个同时在 线用户转换成多少个并发数呢?这就必须要有大量的历史日志信息来支撑了。系统日志需要有同时在线用户数量的日志信息,还需要有用户操作次数的日志信息,这 2个数据的比例就是你同时在线用户转换到并发数的比例。另外根据经验统计,对 于1个JAVA开发的WEB系统(别的我没统计过,给不出数据),一般1台双CPU、2G内存的服务器上可支持的最大并发数不超过500个(这个状态下大部分 操作都是超时报错而且服务器很容易宕机,其实没什么实际意义),可正常使用(单步非大数据量操作等待时间不超过20秒)的最大并发数不超过300个。假设 你的10万同时在线用户转换的并发数是9000个,那么你最少需要这样的机器18台,建议不少于30台。当然,你要是买个大型服务器,里面装有200个CPU、 256G的内存,千兆光纤带宽,就算是10万个并发用户,那速度,也绝对是嗖嗖的。 另外暴寒1下,光设置全部进入运行状态就需要接近6个小时。具体的可以拿1个 系统来压一下看看,可能会出现以下情况: 1、服务器宕机; 2、客户端宕机; 3、从某个时间开始服务器拒绝请求,客户端上显示的全是错误; 4、勉强测试完成,但网络堵塞或测试结果显示时间非常长。假设客户端和服务器 之间百兆带宽,百兆/10000=10K,那每个用户只能得到10K,这个速度接近1个 64K的MODEM上网的速度;另外以上分析全都没考虑系统的后台,比如数据库、中间件等。 1、服务器方面:上面说的那样的PC SERVER需要50台; 2、网络方面:按每个用户50K,那至少5根百兆带宽独享,估计仅仅网络延迟就 大概是秒一级的; 3、如果有数据库,至少是ORACLE,最好是SYSBASE,SQL SERVER是肯定顶 不住的。数据库服务器至少需要10台4CPU、16G内存的机器; 4、如果有CORBA,那至少再准备10台4CPU、16G内存的机器;再加上负载均衡、防火墙、路由器和各种软件等,总之没个1000万的资金投入,肯定搞不定。
CMU200测试仪使用规范
1.目的: 规范综测仪的正确使用, 保证CDMA/GSM手机的射频参数测试的合理性与正确性。 2.参考资料: YDN 055-1997《900/1800MHz TDMA 数字蜂窝移动通信网移动台设备技术规范》 EN 300 607-1(GSM 11.10-1)《数字蜂窝无线电通信系统(第2阶段)移动台一致性要求:部分1:CDMA2000数字蜂窝移动通信网设备总测试规范:移动台 《R&S CMU200 使用说明书》 3.仪器名称: 射频综测仪(型号:CMU200, 双模_GSM & CDMA2000) 4.仪器自检和校准: 为了能够保证每次的测试数据是准确的,经常需要对综测仪进行校准。 (1)打开综测仪的电源; (2)去掉与综测仪连接的全部射频线; (3)按“Menu Select”键选择“Basic Functions”→“Base”→“Maintenance”进“Maintenance” 界面; (4)按“Select”键进行校准项选择,需校准项项目有“RXTX Selftest”和“FM Modulation Calibration” (5)按“Test“键后再按”ON/OFF”键开始校准,校准通过时会显示“Passed”提示。 5. 试验操作: 5.1开机: (1)接好电源线(在仪器背面电源接口处标识相应的输入电压范围,通常接220V/50Hz电源), 按开机键, 进入待机界面; (2)开机预热30分钟后再准备测试。 (3)恢复仪器的原始设置:按“Reset”键后再按两次“Enter”键; 5.2选择测试模块及网络标准: (1)此型号CMU200可以兼容不同制式的测试模块, 目前有GSM900, GSM1800, CDMA2000)。选 择不同制式测试模块(GSM或CDMA),所用选择和确认可用旋钮操作完成:选择为滚动旋钮,确认则按一下旋钮。 (2)GSM测试模块及网络标准选择:在待机界面按“Menu Select”选择“GSM Mobile Station” →“GSM900”或“GSM1800”,按“Enter”,选择GSM测试模块后“Network Standard”缺 省为“GSM only”。 (3)CDMA测试模块及网络标准选择:在待机界面按“Menu Select”→“IMT-2000 Mobile Station” →选择“CDMA2000 450”(适用CDMA450MHz), 或“CDMA2000 Cellular”(适用 CDMA800MHz),或“CDMA2000 PCS”(适用CDMA1900MHz)”,之后按“Enter”确认进 入CDMA测试界面。 (4)在CMU200待机界面,按下方“Network”键→选择“Network Standard”→选择“BC 0: US Cellular”(适用CDMA800MHz),或“BC1:North America PCS(NAPC)”(适用CDMA1900MHz)或“BC5:NMT-450(N45T)” (适用CDMA450MHz)。 5.3 连接射频接口: (1)进行射频测试时选择综测仪的输入输出端口“RF2”。(注意:CMU200射频接口有四个,测试时 可以选择RF1或RF2。(RF1发射峰值功率为50W, RF2发射峰值功率为2W, GSM和CDMA手机发射功
服务器性能测试典型工具介绍
服务器性能测试典型工具介绍 https://www.360docs.net/doc/f68750379.html,/ 2008-11-17 16:42 IT168 我要评论(2) ?摘要:本文介绍了几个比较典型的服务器评测软件,无论什么评测工具,基本的技术都是利用线程技术模仿和虚拟用户,在这里主要的难点在于测试脚本的编写,每种工具使用的脚本都不一样,但是大多数工具都提供录制功能就算是不会编码的测试人员同样可以测试。 ?标签:服务器评测测试工具 ? Oracle帮您准确洞察各个物流环节众所周知,服务器是整个网络系统和计算平台的核心,许多重要的数据都保存在服务器上,很多网络服务都在服务器上运行,因此服务器性能的好坏决定了整个应用系统的性能。 现在市面上不同品牌、不同种类的服务器有很多种,用户在选购时,怎样从纷繁的型号中选择出所需要的,适合于自己应用的服务器产品,仅仅从配置上判别是不够的,最好能够通过实际测试来筛选。而各种的评测软件有很多种,你应该选择哪个软件测试?下面就介绍一些较典型的测试工具: (一)服务器整机系统性能测试工具 一台服务器系统的性能可以按照处理器、内存、存储、网络几部分来划分,而针对不同的应用,可能会对某些部分的性能要求高一些。 Iometer(https://www.360docs.net/doc/f68750379.html,):存储子系统读写性能测试 Iometer是Windows系统下对存储子系统的读写性能进行测试的软件。可以显示磁盘系统的最大IO能力、磁盘系统的最大吞吐量、CPU使用率、错误信息等。用户可以通过设置不同的测试的参数,有存取类型(如sequential ,random)、读写块大小(如64K、256K),队列深度等,来模拟实际应用的读写环境进行测试。
(完整版)LTE系统峰值速率的计算
LTE系统峰值速率的计算 我们常听到” LT网络可达到峰值速率100M、150M、300M ,发展到LTE-A更是可以达到 1Gbps “等说法,但是这些速率的达成究竟受哪些因素的影响且如何计算呢?为了更好的学习峰值速率计算,我们可以带着下面的问题来一起阅读: 1、LTE系统中,峰值速率受哪些因素影响? 2、FDD-LTE系统中,Cat3和Cat4,上下行峰值速率各为多少? 3、T D-LTE系统中,以时隙配比3:1、特殊子帧配比10:2:2为例,Cat3、Cat4上下行峰值速率各为多少? 3、LTE-A ( LTE Advaneed要实现IGbps的目标峰值速率,需要采用哪些技术? 影响峰值速率的因素有哪些? 影响峰值速率的因素有很多,包括: 1. 双工方式——FDD、TDD FDD-LTE为频分双工,即上、下行采用不同的频率发送;而TD-LTE采用时分双工,上、下行 共享频率,采用不同的时隙发送。 因此如果采用相同的带宽和同样的终端类型,FDD-LTE能达到更高的峰值速率。 2. 载波带宽 LTE网络采用5MHz、10MHz、15MHz、20MHz等不同的频率资源,能达到的峰值速率不同。 3. 上行/ 下行 上行的业务需求本就不及下行,因此系统设计的时候也考虑“下行速率高些、上行速率低些” 的原则,实际达到的效果也是这样的。 4. UE能力级 即终端类型的影响,Cat3和Cat4是常见的终端类型,FDD-LTE系统中,下行峰值速率分别能达到100Mbps和150Mbps,上行都只能支持最高16QAM的调制方式,上行最高速率50Mbps。 5. TD-LTE系统中的上下行时隙配比、特殊子帧配比 不同的上下行时隙配比以及特殊时隙配比,会影响TD-LTE系统中的峰值速率水平。 上下行时隙配比有1:3和2:2等方式,特殊时隙配比也有3:9:2和10:2:2等方式。考虑尽量提升下行速率,国内外目前最常用的是DL:UL=3:1、特殊时隙配比10:2:2这种配置。 6. 天线数、MIMO 配置 Cat4 支持2*2MIMO ,最高支持双流空间复用,下行峰值速率可达150Mbps;Cat5 支持 4*4MIMO ,最高支持四层空间复用,下行峰值速率可达300Mbps。 7. 控制信道开销 计算峰值速率还要考虑系统开销,即控制信道资源占比。实际系统中,控制信道开销在20~30% 的水平内波动。 总之,有很多因素影响所谓的“峰值速率”,所以提到峰值速率的时候,要说明是在什么制式下、采用了多少带宽、在什么终端、什么方向、什么配置情况下达到的速率。 下行峰值速率的计算: 计算峰值速率一般采用两种方法: 第一种:是从物理资源微观入手,计算多少时间内(一般采用一个TTI或者一个无线帧)传 多少比特流量,得到速率; 另一种:是直接查某种UE类型在一个TTI (LTE系统为1ms)内能够传输的最大传输块,得到速率。
性能测试报告
方欣科技有限公司 密级:限项目内使用 性能测试报告 (V1.0.0) 方欣科技有限公司 修订记录
目录 1.简介 ----------------------------------------------------- 4 1.1.概述 (4) 1.2.读者范围 (4) 1.3.参考资料 (4) 2.测试环境 ------------------------------------------------- 4 2.1.服务器 (4) 2.2.客户机 (5) 2.3.测试工具 (5) 3.性能指标 ------------------------------------------------- 6 4.测试用例 ------------------------------------------------- 7 5.测试结果 ------------------------------------------------- 8 5.1.登录:2000并发,主页+登录+申报首页 (8) 5.1.1.TPS汇总 (9) 5.1.2.响应时间 (9) 5.1.3.点击率 (10) 5.2.通用申报 (10) 5.2.1.200并发 (10) 5.2.2.500并发 (11) 5.2.3.小结 (13) 5.3.申报查询 (13) 5.3.1.500并发 (13) 5.3.2.小结 (14) 6.风险与建议 ---------------------------------------------- 14
1.简介 1.1.概述 (对文档目的进行说明,描述系统与测试执行的概况示例如下:) 本报告主要说明项目组对***系统进行性能测试的环境要求、测试场景、测试关键点、测试记录,测试结果等具体内容。 1.2.读者范围 (列出可能的读者范围,报告提交对象) 1.3.参考资料 (列出参考资料,没有可忽略) 2.测试环境 2.1.服务器 (列出测试环境服务器资源情况,示例如下:)
WEB服务器性能测试基本指标
WEB服务器性能测试基本指标 1说明 随着公司业务的发展,公司网站、管理后台、app服务器的访问量在不断增加,但通常在软件设计开发的时候很难模拟出大量用户同时访问系统的实际情况,因此,当Web网站遇到访问高峰时,容易发生服务器响应速度变慢甚至服务中断。为了避免这种情况,需要一种能够真实模拟大量用户访问Web应用系统的性能测试工具进行压力测试,来测试静态HTML页面的响应时间,甚至测试动态网页(包括PHP、JSP 等)的响应时间,为服务器的性能优化和调整提供数据依据。 Web性能测试的部分概况一般来说,一个Web请求的处理包括以下步骤: (1)客户发送请求 (2)web server接受到请求,进行处理; (3)web server 向DB获取数据; (4)web server生成用户的object(页面),返回给用户。给客户发送请求开始到最后一个字节的时间称为响应时间(第三步不包括在每次请求处理中)。
2网络拓扑图 3系统配置
4主要指标 4.1事务(Transaction) 在web性能测试中,一个事务表示一个“从用户发送请求->web server接受到请求,进行处理-> we b server向DB获取数据->生成用户的object(页面),返回给用户”的过程,一般的响应时间都是针对事务而言的。 4.2请求响应时间 请求响应时间指的是从客户端发起的一个请求开始,到客户端接收到从服务器端返回的响应结束,这个过程所耗费的时间,在某些工具中,响应通常会称为“TTLB”,即"time to last byte",意思是从发起一个请求开始,到客户端接收到最后一个字节的响应所耗费的时间,响应时间的单位一般为“秒”或者“毫秒”。一个公式可以表示:响应时间=网络响应时间+应用程序响应时间。标准可参考国外的3/5/10原则: (1)在3秒钟之内,页面给予用户响应并有所显示,可认为是“很不错的”; (2)在3~5秒钟内,页面给予用户响应并有所显示,可认为是“好的”; (3)在5~10秒钟内,页面给予用户响应并有所显示,可认为是“勉强接受的”; (4)超过10秒就让人有点不耐烦了,用户很可能不会继续等待下去; 4.3事务响应时间 事务可能由一系列请求组成,事务的响应时间主要是针对用户而言,属于宏观上的概念,是为了向用户说明业务响应时间而提出的.例如:跨行取款事务的响应时间就是由一系列的请求组成的.事务响应时间是直接衡量系统性能的参数. 4.4并发用户数 并发一般分为2种情况。一种是严格意义上的并发,即所有的用户在同一时刻做同一件事情或者操作,这种操作一般指做同一类型的业务。比如在信用卡审批业务中,一定数目的拥护在同一时刻对已经完成的审批业务进行提交;还有一种特例,即所有用户进行完全一样的操作,例如在信用卡审批业务中,所有的用户可以一起申请业务,或者修改同一条记录。 另外一种并发是广义范围的并发。这种并发与前一种并发的区别是,尽管多个用户对系统发出了请求或者进行了操作,但是这些请求或者操作可以是相同的,也可以是不同的。对整个系统而言,仍然是有很多用户同时对系统进行操作,因此也属于并发的范畴。 可以看出,后一种并发是包含前一种并发的。而且后一种并发更接近用户的实际使用情况,因此对于大多数的系统,只有数量很少的用户进行“严格意义上的并发”。对于WEB性能测试而言,这2种并发情况一般都需要进行测试,通常做法是先进行严格意义上的并发测试。严格意义上的用户并发一般发生在使用比较频繁的模块中,尽管发生的概率不是很大,但是一旦发生性能问题,后果很可能是致命的。严格意义
LTE计算汇总
如对你有帮助,请购买下载打赏,谢谢! 1.RSRP及RSRQ计算 RSRP=-140+RsrpResult(dBm); ●-44<=RSRP<-140dbm ●0<= RsrpResult<=97 下行解调门限:18.2dBm来计算的话,下行支持的最小RSRP为18.2-130.8= -112.6 下行解调门限:上行支持的最小RSRP为23-126.44= -103.44dBm RSRQ=-20+1/2RsrqResult(dB) RSRQ=N×RSRP/(E-UTRA carrier RSSI),即RSRQ = 10log10(N) + UE所处位置接收到主服务小区的RSRP – RSSI。 RSRQ=20+RSRP – RSSI 2.W及dBm换算 “1个基准”:30dBm=1W “2个原则”: 1)+3dBm,功率乘2倍;-3dBm,功率乘1/2 33dBm=30dBm+3dBm=1W× 2=2W 27dBm=30dBm-3dBm=1W× 1/2=0.5W 2)+10dBm,功率乘10倍;-10dBm,功率乘1/10 40dBm=30dBm+10dBm=1W× 10=10W 20dBm=30dBm-10dBm=1W× 0.1=0.1W 3.功率计算 其中max transmissionpower = 43dBm 等效于20W Partofsectorpower=100(%) ; confOutputpower=20(W) Sectorpower=20(W) 需确保Sectorpower=confOutputpower*Partofsectorpower*% 如Partofsectorpower=50(%) ; confOutputpower=40(W) Sectorpower(20W)=confOutputpower(40W) *Partofsectorpower(50%) 4.参考信号接收功率计算 RSRP功率=RU输出总功率-10lg(12*RB个数) , 如果是单端口20W的RU,那么可以推算出 RSRP功率为43-10lg1200=12.2dBm. 1)A类符号指整个OFDM符号子载波上没有RS符号,位于时隙的索引为1、2、3、5、6
性能测试报告范例
测试目的: 考虑到各地区的用户数量和单据量的增加会给服务器造成的压力不可估计,为确保TMS系统顺利在各地区推广上线,决定对TMS系统进行性能测试,重点为监控服务器在并发操作是的资源使用情况和请求响应时间。 测试内容 测试工具 主要测试工具为:LoadRunner11 辅助软件:截图工具、Word
测试结果及分析 5个用户同时生成派车单的测试结果如下: Transaction Summary(事务摘要) 从上面的结果我们可以看到该脚本运行47秒,当5个用户同时点击生成派车单时,系统的响应时间为41.45秒,因为没有设置持续运行时间,所以这里我们取的响应时间为90percent –time,且运行的事物已经全部通过
事务概论图,该图表示本次场景共5个事务(每个用户点击一次生成派车单为1个事务),且5个事务均已pass,绿色表色pass,如出现红色则表示产生error
从上图可以看到服务器的CPU平均值为14.419% ,离最大参考值90%相差甚远;且趋势基本成一直线状,表示服务器响应较为稳定,5个用户操作5个900托运单的单据对服务器并没有产生过大的压力。
“Hits per Second(每秒点击数)”反映了客户端每秒钟向服务器端提交的请求数量,这里服务器每秒响应9,771次请求;如果客户端发出的请求数量越多,与之相对的“Average Throughput (吞吐量)”也应该越大。图中可以看出,两种图形的曲线都正常并且几乎重合,说明服务器能及时的接受客户端的请求,并能够返回结果。 按照上述策略,我们得出的最终测试结果为: 生成派车单: 1个用户,300个托运单点击生成派车单,响应时间7.34秒 5个用户,900个托运单点击生成派车单,响应时间41.45秒 单据匹配: 单用户1000箱,20000个商品,上传匹配时间8秒 五个用户2500箱,40000个商品,同时上传匹配耗时2分25秒 自由派车: 单条线路917个托运单下载,响应时间1分40秒 上述结果是在公司内网,测试环境上进行的测试,可能与实际会有偏差
cmu200测试仪使用详解.pdf
CMU200操作培训 第一章CMU200简述 一 CMU200应用及其基本功能 CMU200在测试中模拟基站,通过U m接口,对无线终端产品的性能指标进行测试的综合测试仪。除此之外,CMU200还能作为信号源以及频谱分析仪,跟其他仪表配合起来使用。作为一台综合测试仪,它几乎支持所有的协议:MS Test GSM400、900、1800、1900,TDMA IS 136,AMPS,CDMA IS 95,WCDMA,CDMA2000,EDGE等等。当然不同协议的支持需要我们加载不同版本的软件。因此,可以说CMU200是完全面向未来的模块化设计。 由于CMU200的基本单元中包含了信号源/功率计,示波器和简单的频谱分析仪的功能,CMU200广泛的应用于下列各个领域: RF开发 模块设计 生产中的模块测试 生产中的最终测试 功能测试 特性测试 高级维修 质量检验 测试系统的基本仪表 基站模拟 二 CMU200的主要优点 CMU200的设计不仅满足现在的测试需求,而且为以后的升级提供了很多备用资源。它的有点主要体现在以下几个方面: 多标准支持的测试平台 很快的测试速度 很高的测试精度 重量轻 耗电省 兼容性好 三 CMU200的按键及接口 CMU200的前面板主要是由VGA显示屏以及VGA两旁的软件以及下面的热键和右面的各类硬按键(FUNCTION、SYSTEM、DATA、V ARIATION、CONTROL)以及各类接口组成。下图为CMU200的前视图。
图2-1 CMU200前视图 CMU200的后面板如下图所示,主要由信号、同步的输入输出口以及远程控制、外围设备的接口和电源及其开关组成。 图2-2 CMU200后视图 下面简单介绍一下各类按键以及接口。 FUNCTION 预选择菜单: MENU SELECT 菜单选择 DATA 文件管理 CTRL 保留为以后扩展用 DATA
服务器性能测试指标介绍
服务器性能测试指标介绍 当前业界常见的服务器性能指标有: TPC-C TPC-E TPC-H SPECjbb2005 SPECjEnterprise2010 SPECint2006 及SPECint_rate_2006 SPECfp2006 及SPECfp_rate_2006 SAP SD 2-Tier LINPACK RPE2 一、TPC (Transaction Processing Performance Council) 即联机交易处理性能协会, 成立于1988年的非盈利组织,各主要软硬件供应商均参与,成立目标: 为业界提供可信的数据库及交易处理基准测试结果,当前发布主要基准测试为: TPC-C : 数据库在线查询(OLTP)交易性能 TPC-E : 数据库在线查询(OLTP)交易性能 TPC-H : 商业智能/ 数据仓库/ 在线分析(OLAP)交易性能 1.TPC-C测试内容:数据库事务处理测试, 模拟一个批发商的订单管理系统。实际衡量服务器及数据库软件处理在线查询交易处理(OLTP)的性能表现. 正规TPC-C 测试结果发
布必须提供tpmC值, 即每分钟完成多少笔TPC-C 数据库交易(TPC-C Transaction Per Minute), 同时要提供性价比$/tpmC。如果把TPC-C 测试结果写成为tpm, TPM, TPMC, TPCC 均不属正规。 2.TPC-E测试内容:数据库事务处理测试,模拟一个证券交易系统。与TPC-C一样,实际衡量服务器及数据库软件处理在线查询交易处理(OLTP)的性能表现。正规TPC-E测试结果必须提供tpsE值,即每秒钟完成多少笔TPC-E数据库交易(transaction per second),同时提供$/tpsE。测试结果写成其他形式均不属正规。 对比:TPC-E测试较TPC-C测试,在测试模型搭建上增加了应用服务器层,同时增加了数据库结构的复杂性,测试成本相对降低。截止目前,TPC-E的测试结果仅公布有50种左右,且测试环境均为PC服务器和windows操作系统,并无power服务器的测试结果。除此之外,TPC官方组织并未声明TPC-E取代TPC-C,所以,说TPC-E取代TPC-C并没有根据。 附TPC-C与TPC-E数据库结构对比 3.TPC-H测试内容:对大型数据仓库进行决策支持(decision support)的基准测试。TPC-H包含一组复杂的业务查询及修改操作,属于商业智能/数据仓库/在线分析(OLAP)
系统测试报告
xxxxxxxxxxxxxxx 系统测试报告 xxxxxxxxxxx公司 20xx年xx月
版本修订记录
目录 1引言 (1) 1.1编写目的 (1) 1.2项目背景 (1) 1.3术语解释 (1) 1.4参考资料 (1) 2测试概要 (2) 2.1系统简介 (2) 2.2测试计划描述 (2) 2.3测试环境 (2) 3测试结果及分析 (3) 3.1测试执行情况 (3) 3.2功能测试报告 (3) 3.2.1系统管理模块测试报告单 3 3.2.2功能插件模块测试报告单 4 3.2.3网站管理模块测试报告单 4 3.2.4内容管理模块测试报告单 4 3.2.5辅助工具模块测试报告单 4 3.3系统性能测试报告 (4) 3.4不间断运行测试报告 (5) 3.5易用性测试报告 (5) 3.6安全性测试报告 (6) 3.7可靠性测试报告 (6) 3.8可维护性测试报告 (7) 4测试结论与建议 (9) 4.1测试人员对需求的理解 (9) 4.2测试准备和测试执行过程 (9) 4.3测试结果分析 (9) 4.4建议 (9)
1引言 1.1 编写目的 本测试报告为xxxxxx软件项目的系统测试报告,目的在于对系统开发和实施后的的结果进行测试以及测试结果分析,发现系统中存在的问题,描述系统是否符合项目需求说明书中规定的功能和性能要求。 预期参考人员包括用户、测试人员、开发人员、项目管理者、其他质量管理人员和需要阅读本报告的高层领导。 1.2 项目背景 ?项目名称:xxxxxxx系统 ?开发方: xxxxxxxxxx公司 1.3 术语解释 系统测试:按照需求规格说明对系统整体功能进行的测试。 功能测试:测试软件各个功能模块是否正确,逻辑是否正确。 系统测试分析:对测试的结果进行分析,形成报告,便于交流和保存。 1.4 参考资料 1)GB/T 8566—2001 《信息技术软件生存期过程》(原计算机软件开发规范) 2)GB/T 8567—1988 《计算机软件产品开发文件编制指南》 3)GB/T 11457—1995 《软件工程术语》 4)GB/T 12504—1990 《计算机软件质量保证计划规范》 5)GB/T 12505—1990 《计算机软件配置管理计划规范》
CMU200操作培训教材
CMU200操作培训教材
CMU200操作培训 第一章CMU200简述 一CMU200应用及其基本功能 CMU200在测试中模拟基站,通过U m接口,对无线终端产品的性能指标进行测试的综合测试仪。除此之外,CMU200还能作为信号源以及频谱分析仪,跟其他仪表配合起来使用。作为一台综合测试仪,它几乎支持所有的协议:MS Test GSM400、900、1800、1900,TDMA IS 136,AMPS,CDMA IS 95,WCDMA,CDMA2000,EDGE等等。当然不同协议的支持需要我们加载不同版本的软件。因此,可以说CMU200是完全面向未来的模块化设计。 由于CMU200的基本单元中包含了信号源/功率计,示波器和简单的频谱分析仪的功能,CMU200广泛的应用于下列各个领域: ●RF开发 ●模块设计 ●生产中的模块测试 ●生产中的最终测试
●功能测试 ●特性测试 ●高级维修 ●质量检验 ●测试系统的基本仪表 ●基站模拟 二CMU200的主要优点 CMU200的设计不仅满足现在的测试需求,而且为以后的升级提供了很多备用资源。它的有点主要体现在以下几个方面: ●多标准支持的测试平台 ●很快的测试速度 ●很高的测试精度 ●重量轻 ●耗电省 ●兼容性好 三CMU200的按键及接口 CMU200的前面板主要是由VGA显示屏以及VGA两旁的软件以及下面的热键和右面的各类硬按键(FUNCTION、SYSTEM、DATA、
V ARIATION、CONTROL)以及各类接口组成。下图为CMU200的前视图。 图2-1 CMU200前视图 CMU200的后面板如下图所示,主要由信号、同步的输入输出口以及远程控制、外围设备的接口和电源及其开关组成。 图2-2 CMU200后视图 下面简单介绍一下各类按键以及接口。FUNCTION 预选择菜单: MENU SELECT 菜单选择 DATA 文件管理 CTRL 保留为以后扩展用
通信人才网-LTE峰值速率的计算详解
LTE系统峰值速率的计算 我们常听到”LTE网络可达到峰值速率100M、150M、300M,发展到LTE-A 更是可以达到1Gbps“等说法,但是这些速率的达成究竟受哪些因素的影响且如何计算呢? 为了更好的学习峰值速率计算,我们可以带着下面的问题来一起阅读: 1、LTE系统中,峰值速率受哪些因素影响? 2、FDD-LTE系统中,Cat3和Cat4,上下行峰值速率各为多少? 3、TD-LTE系统中,以时隙配比3:1、特殊子帧配比10:2:2为例,Cat3、Cat4上下行峰值速率各为多少? 3、LTE-A(LTE Advanced)要实现1Gbps的目标峰值速率,需要采用哪些技术? 影响峰值速率的因素有哪些? 影响峰值速率的因素有很多,包括: 1. 双工方式——FDD、TDD FDD-LTE为频分双工,即上、下行采用不同的频率发送;而TD-LTE采用时 分双工,上、下行共享频率,采用不同的时隙发送。 因此如果采用相同的带宽和同样的终端类型,FDD-LTE能达到更高的峰值速率。 2. 载波带宽 LTE网络采用5MHz、10MHz、15MHz、20MHz等不同的频率资源,能达到的峰值速率不同。 3. 上行/下行 上行的业务需求本就不及下行,因此系统设计的时候也考虑“下行速率高些、上行速率低些”的原则,实际达到的效果也是这样的。 4. UE能力级 即终端类型的影响,Cat3和Cat4是常见的终端类型,FDD-LTE系统中,下行峰值速率分别能达到100Mbps和150Mbps,上行都只能支持最高16QAM的调制方式,上行最高速率50Mbps。 5. TD-LTE系统中的上下行时隙配比、特殊子帧配比
服务器性能测试相关的常用工具概要
服务器性能测试相关的常用工具 (一服务器整机系统性能测试工具 一台服务器系统的性能可以按照处理器、内存、存储、网络几部分来划分,而针对不同的应用,可能会对某些部分的性能要求高一些。 Iometer(https://www.360docs.net/doc/f68750379.html,:存储子系统读写性能测试 Iometer是Windows系统下对存储子系统的读写性能进行测试的软件。可以显示磁盘系统的最大IO能力、磁盘系统的最大吞吐量、CPU使用率、错误信息等。用户可以通过设置不同的测试的参数,有存取类型(如sequential,random、读写块大小(如64K、256K,队列深度等,来模拟实际应用的读写环境进行测试。Iometer操作简单,可以录制测试脚本,可以准确有效的反映存储系统的读写性能,为各大服务器和存储厂商所广泛采用。 SisoftSandra(https://www.360docs.net/doc/f68750379.html,:WINDOWS下基准评测 SiSoft发行的Sandra系列测试软件是Windows系统下的基准评测软件。此软件有超过三十种以上的测试项目,能够查看系统所有配件的信息,而且能够对部分配件(如CPU、内存、硬盘等进行打分(benchmark,并且可以与其它型号硬件的得分进行对比。另外,该软件还有系统稳定性综合测试、性能调整向导等附加功能。SisoftSandra软件在最近发布的Intelbensley平台上测试的内存带宽性能并不理想,不知道采用该软件测试的FBD内存性能是否还有参考价值,或许软件应该针对FBD 内存带宽的测试项目做一个升级。 Iozone(https://www.360docs.net/doc/f68750379.html,:linux下I/O性能测试 现在有很多的服务器系统都是采用linux操作系统,在linux平台下测试I/O性能可以采用iozone。iozone是一个文件系统的benchmark工具,可以测试不同的操作系统中文件系统的读写性能。可以测试Read,write,re-read,re-write, read backwards, read strided, fread, fwrite,random read,pread,mmap, aio_read,aio_write等等不同的模式
存储服务器性能测试报告
2005年度存储服务器公开比较测试报告 我来说两句(0) 存储服务器 搜索 【来源:计世网】 【作者:张峰】 每当我们讨论网络存储时,首先就会想到光纤通道SAN (存储区域网)与NAS (网络附加存储),然而,当我们与众多中小用户交流之后发现,仅简单地采用这两种架构还不能够完全满足他们的存储需求。 对于中小企业用户来说,希望采用的存储设备能够满足迅速增长的业务需求。 数据量越来越大是他们最关心的一个方面,因此需要 一台大容量的存储设备。比较重要的一点是,中小企 业用户一般没有专业的存储技术人员,他们寻找的是 一个易用的“盒子”。那么,这个盒子应该具备哪些 功能呢?下列三方面是用户最关心的。 一,文件服务。由于大多数需要存储数据为文件 类型,因此他们最重要的需求是一台独立的存储设备 能够透明地满足客户端文件服务,把它插入用户原有 的以太网环境中就能够为用户各类客户端提供方便 的文件服务,包括Windows 、Linux 以及Mac 等客户 端。 二,iSCSI 功能。中小用户并不是所有数据都为 文件,还有一部分的块数据。在无法承受光纤通道SAN 高昂投资之前,iSCSI 是一个不错的选择,在用户原有的以太网环境中就可以轻松构建一个iSCSI SAN 。同时能够随着业务的增长而同步扩展,并且能够在用户最终采用光纤通道SAN 架构时协同工作。 三,服务器功能。许多厂商的NAS 是构建在标准服务器硬盘平台之上的,许多用户在性能要求不高的情况下,就干脆把一些应用服务器安装在存储设备中,尤其是一些简单的Web 服务器、邮件服务器以及FTP 服务器等。这样做的好处是,有些时候甚至可以为用户节省一台服务器硬件的投资。 满足上述三项功能的设备主要定位在中低端,有些厂商把它称之为“存储服务器”。当然,有些传统NAS 厂商并不这样称呼它们的产品,但是iSCSI 是广泛被NAS 产品支持的,而且在NAS 产品中也越来越多的支持一些服务器功能,在实质上越来越像一台存储服务器。 数量众多的中小企业用户对存储服务器存在巨大需求,为此《网络世界》评测实验室组织了本次存储服务器公开比较测试。 由于中小用户对价格的敏感性也是最强的,他们在存储方面的投资一般都较小,希望能够少花钱多办事,所以我们还特别考察了参测产品的总价格以及每GB 有效存储容量价格。 我们本次测试邀请征集的产品要求是:此次评测的产品范围限制在总价在10万元人民币以内的产品,需要有强大的文件服务功能、有效容量至少为800GB (建议RAID 5),各厂商的存储服务器、NAS 产品均可参加。
服务器测试报告
服务器测试报告服务器测试报告 概述
此次测试针对新的服务器进行性能测试,主要有5个方面的测试:服务器基本性能测试,InfoDB性能测试,BinaryDB性能测试,Apache性能测试,LINUX下MYSQL性能测试,此文档仅针对机器硬件基本性能和BinaryDB 的性能测试进行描述 测试结果概述:
基本硬件性能概要:(此部分数据使用互联网下载的相应测试工具测得) CPU浮点运算方面:服务器约是232服务器性能的238% CPU多核心间带宽:服务器约是232服务器性能的10倍 高速缓存和内存间的带宽:服务器约是232服务器性能的300% 内存带宽方面:服务器约是232服务器性能的%87. 内存随机访问性能:服务器的内存带宽约是232服务器性能的86% 内部网络性能:服务器和232服务器几乎没有
差别(同处一个交换机,性能不可能有差距……) 硬盘读取性能:服务器约是232服务器性能的6倍。 硬盘写入性能: 打开写入缓存前:服务器约是232服务器性能的10%。(16KB数据包) 打开写入缓存后:服务器约是232服务器性能的290%。(16KB数据包) BinaryDB性能概要:
写入效率方面(写入数据包为16KB) 文件模式服务器约是232服务器性能的 23% 磁盘模式服务器约是232服务器性能的 61% 打开磁盘缓存后文件模式提高了1倍的速度,但效率也仅达到232的 50% 磁盘模式并没有因为打开磁盘缓存而加快 速度,仅达到了232的67% 但是和服务器的速度稍好,读取效率方面, 硬盘读取效率的比值还是有很大差距。 文件模式服务器约是232服务器性能的125%
CMU200的基本设置及测试基本操作
CMU200的基本设置及测试基本操作 -----CDMA2000 1.CMU200仪器简介 (2) 2.CMU200各功能模块相关设置简介 (2) 2.1CMU手动测试前基本参数设置: (2) 2.2SERVICE.CFG (3) 2.3BSSIGNAL (4) 2.4AF/RF (4) 2.5NETwork (5) 2.6NETworkstandard (5) 2.71stServiceClass (6) 2.8呼叫并建立连接 (6) 3.具体测试项目 (7) 3.1接收机灵敏度和动态范围 (7) 3.2频率准确度 (10) 3.3波形质量和频率准确度 (11) 3.4最大射频输出功率 (12) 3.5最小发射功率 (14) 3.6门控输出功率 (14) 3.7开环输出功率时间响应 (17) 3.8发射机带内杂散抑制 (18) 3.9码域功率 (18) 3.10单频抗扰度 (19) 3.11互调杂散响应衰减 (20) 3.12接收机传导性杂散发射 (21) 3.13闭环功率控制 (22) 4.待定..................................................................................... 错误!未定义书签。
1.CMU200仪器简介 CMU200是Rohde & Schwarz公司研制出的移动台测试仪,可以测试NMT-450,US Celluar,Korean Celluar,TACS ,JTACS,North American 700,Secondary 800,US PCS,Korean PCS,1800MHz,IMT-2000等各个Band Class的移动台;可以进行CDMA One ,CDMA2000 1 X,WCDMA,Bluetooth,TDMA,GSM等各种系统的测试。对于移动台的测试,测试项目基本含盖EIA/TIA-98D协议中的所有测试项,仪器本身已经按照98D协议要求设置了各项指标的协议要求,使用者可以一次设定所有测试所有测试项目的测试条件。此外CMU200与计算机进行通信的接口很丰富,包括GPIB,串口,PCMCIA接口等等,而且CMU200可以连接许多外设,如键盘等便于测试工作的进行。CMU200是测试移动台性能比较重要的工具之一 图(1)是仪器的外观,上边用红线标明的是基本按键说明。将移动台和测试仪CMU200连接起来,可以用直连电缆,也可以利用屏蔽盒将移动台和测试仪连接起来。 2.CMU200各功能模块相关设置简介 2.1CMU手动测试前基本参数设置: 1、将CMU200安放在0~50℃工作温度环境的实验室。接上后面板220V交流电源,打开仪器前面板的ON按钮,仪器开始进入自检状态和启动状态,然后进入正常的工作状态,为了保证仪器内部温度与环境温度一致,确保参数稳定,一般要求仪器开机预热30分钟钟~60分钟。 3 仪器初始化后,会进入如下图(2)所示界面,在此界面可以选择不同的频段类别。以800M